Copyright
©The Author(s) 2023.
World J Clin Cases. Apr 26, 2023; 11(12): 2753-2765
Published online Apr 26, 2023. doi: 10.12998/wjcc.v11.i12.2753
Published online Apr 26, 2023. doi: 10.12998/wjcc.v11.i12.2753
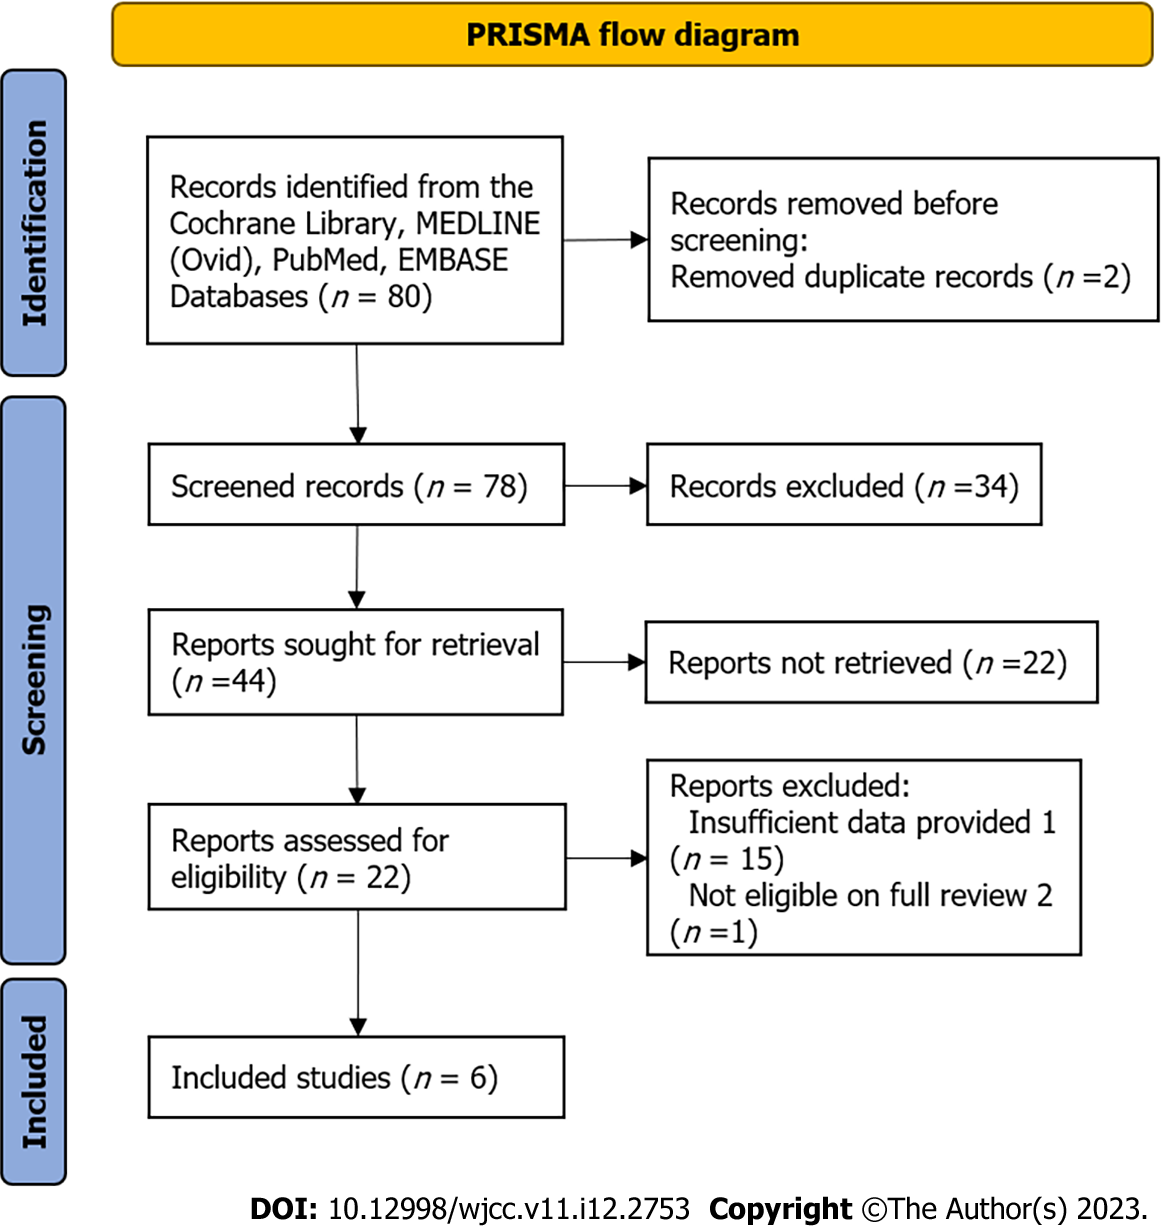
Figure 1 PRISMA flow diagram.
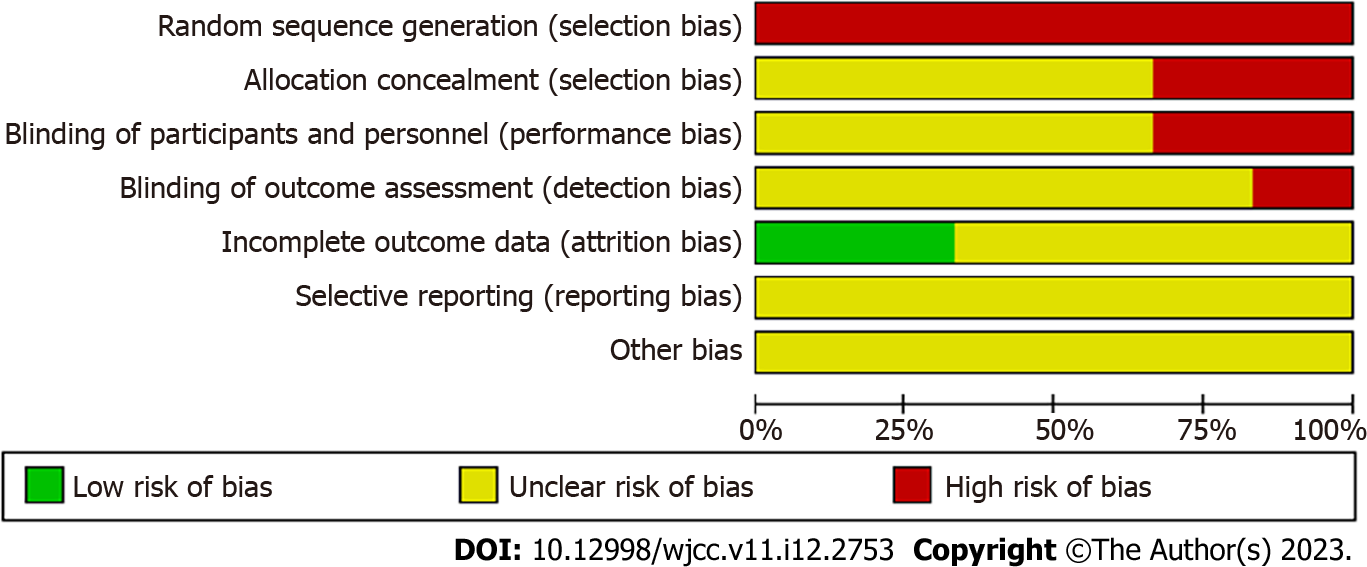
Figure 2 Risk of bias graph.
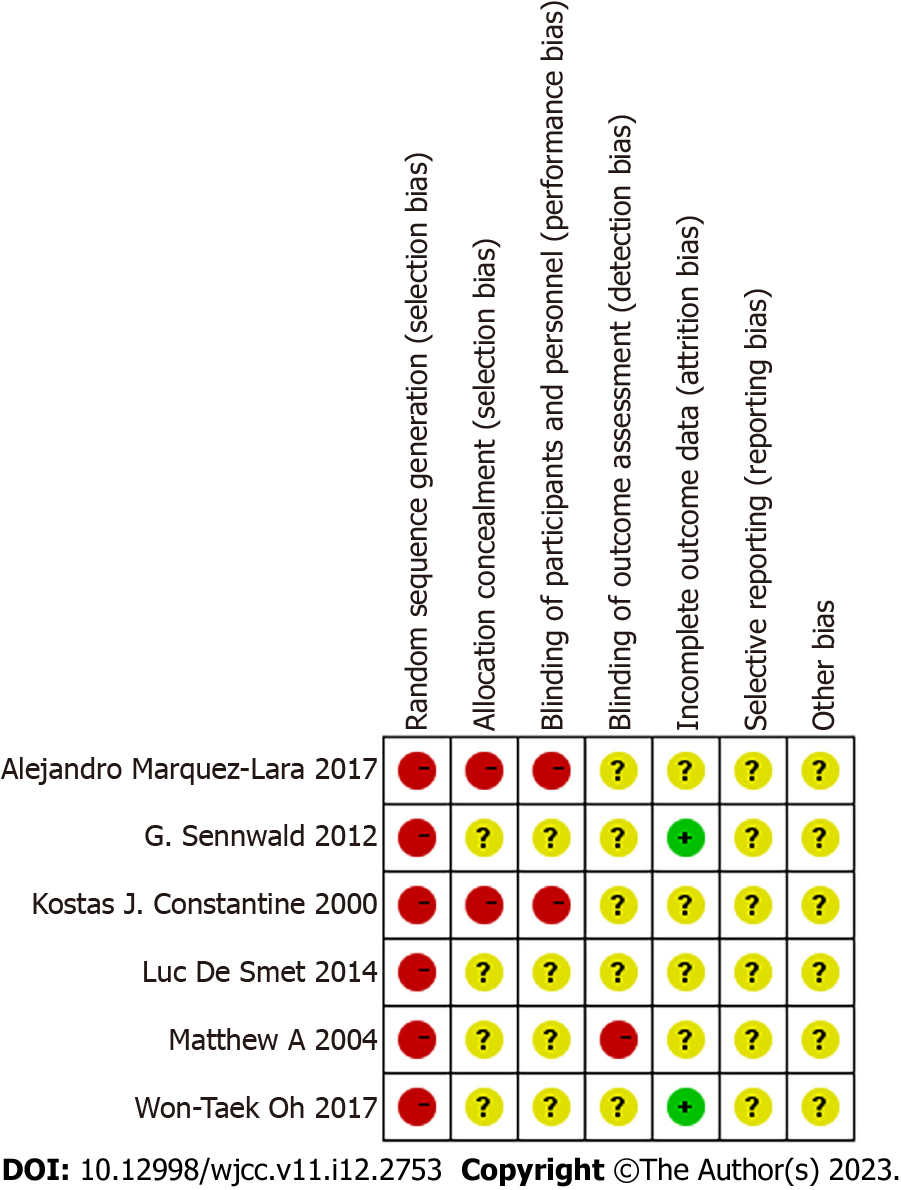
Figure 3 Risk of bias summary.
Figure 4 Complication rates.
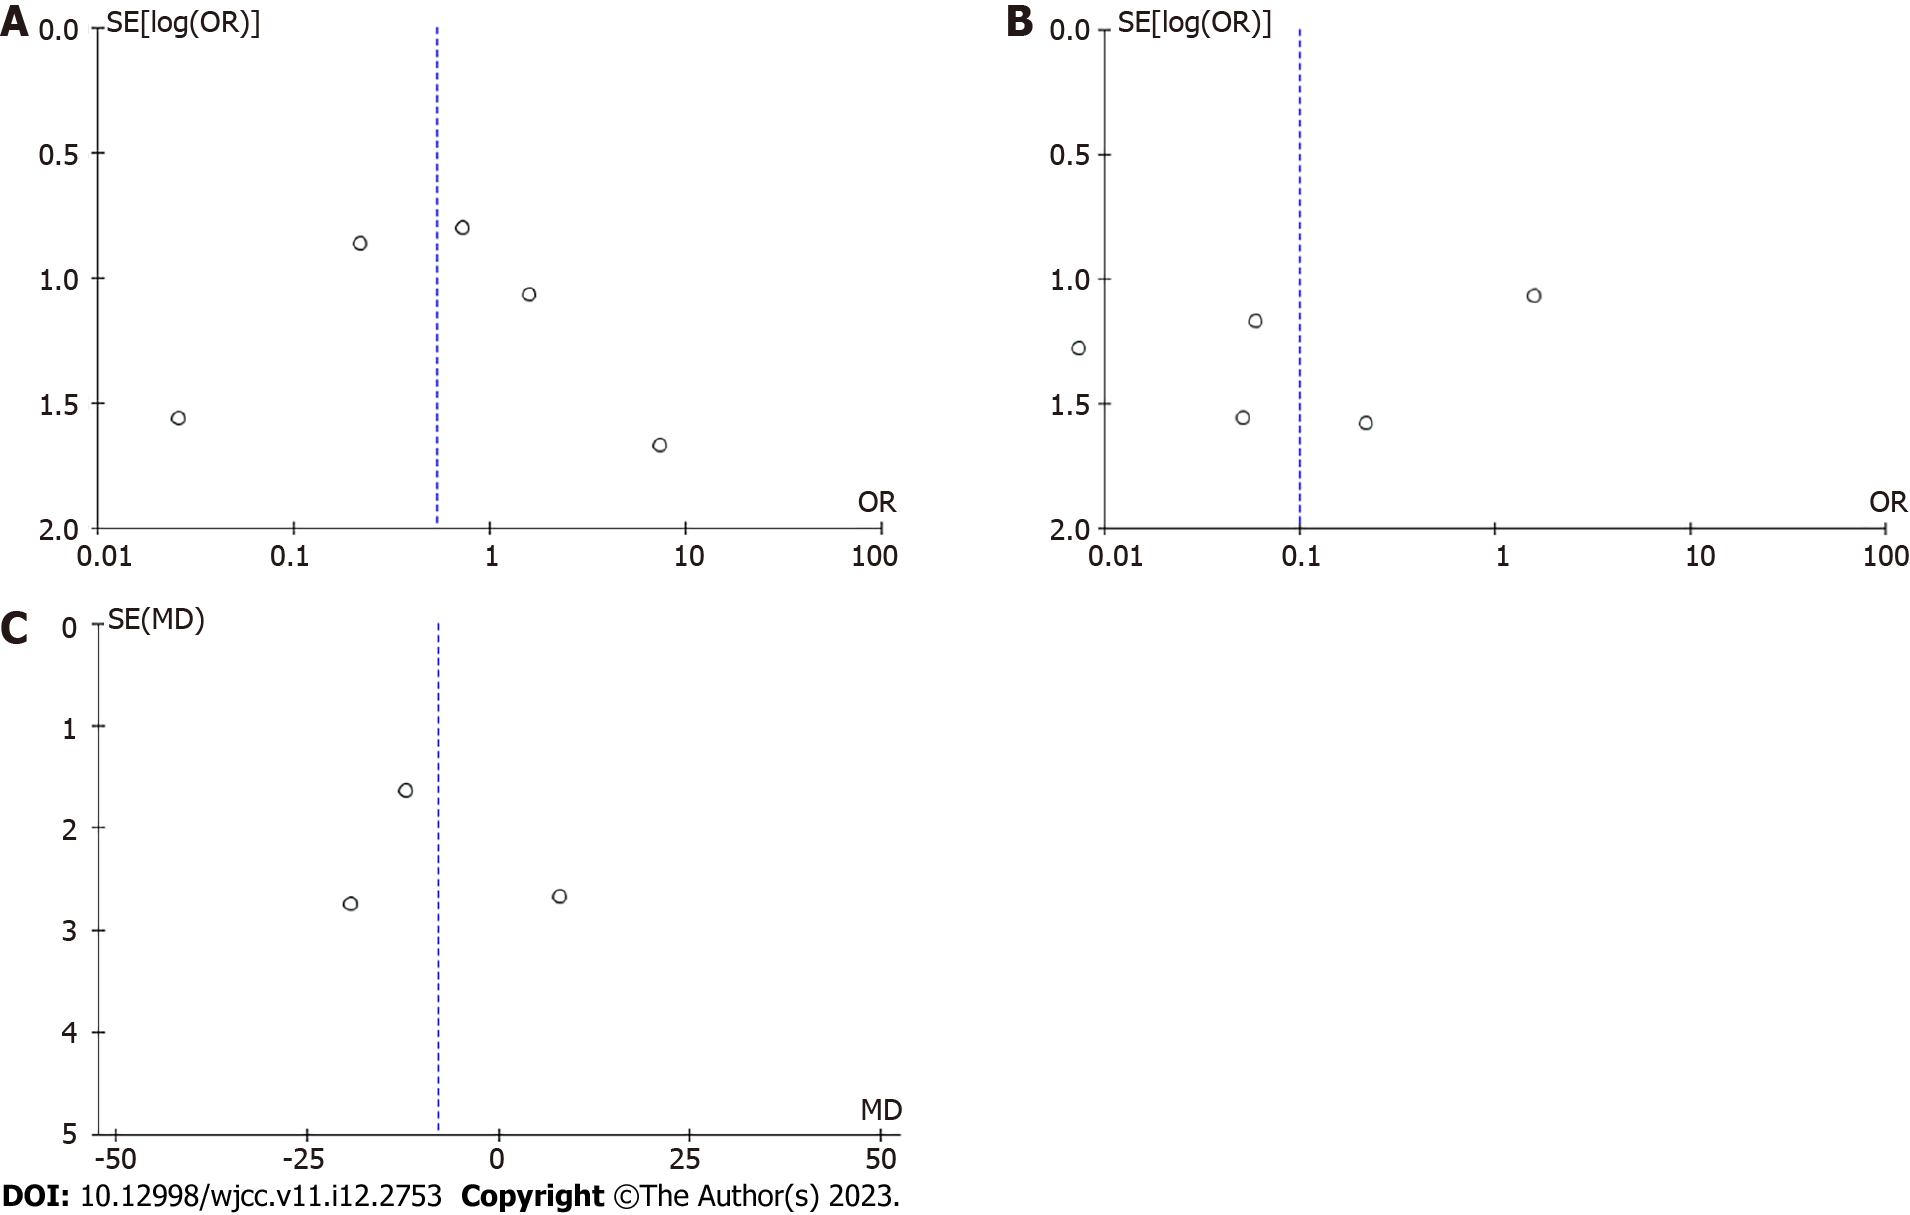
Figure 5 Funnel plot.
A: The incidence of complications; B: The secondary procedure rate; C: Pos-op DASH score.
Figure 6 Secondary procedure rate.
Figure 7 Postoperative DASH score outcome.
- Citation: Deng HL, Lu ML, Tang ZM, Mao QL, Zhao JM. Is metaphyseal ulnar shortening osteotomy superior to diaphyseal ulnar shortening osteotomy in the treatment of ulnar impaction syndrome? A meta-analysis. World J Clin Cases 2023; 11(12): 2753-2765
- URL: https://www.wjgnet.com/2307-8960/full/v11/i12/2753.htm
- DOI: https://dx.doi.org/10.12998/wjcc.v11.i12.2753


