Copyright
©The Author(s) 2023.
World J Clin Cases. Jan 6, 2023; 11(1): 92-103
Published online Jan 6, 2023. doi: 10.12998/wjcc.v11.i1.92
Published online Jan 6, 2023. doi: 10.12998/wjcc.v11.i1.92
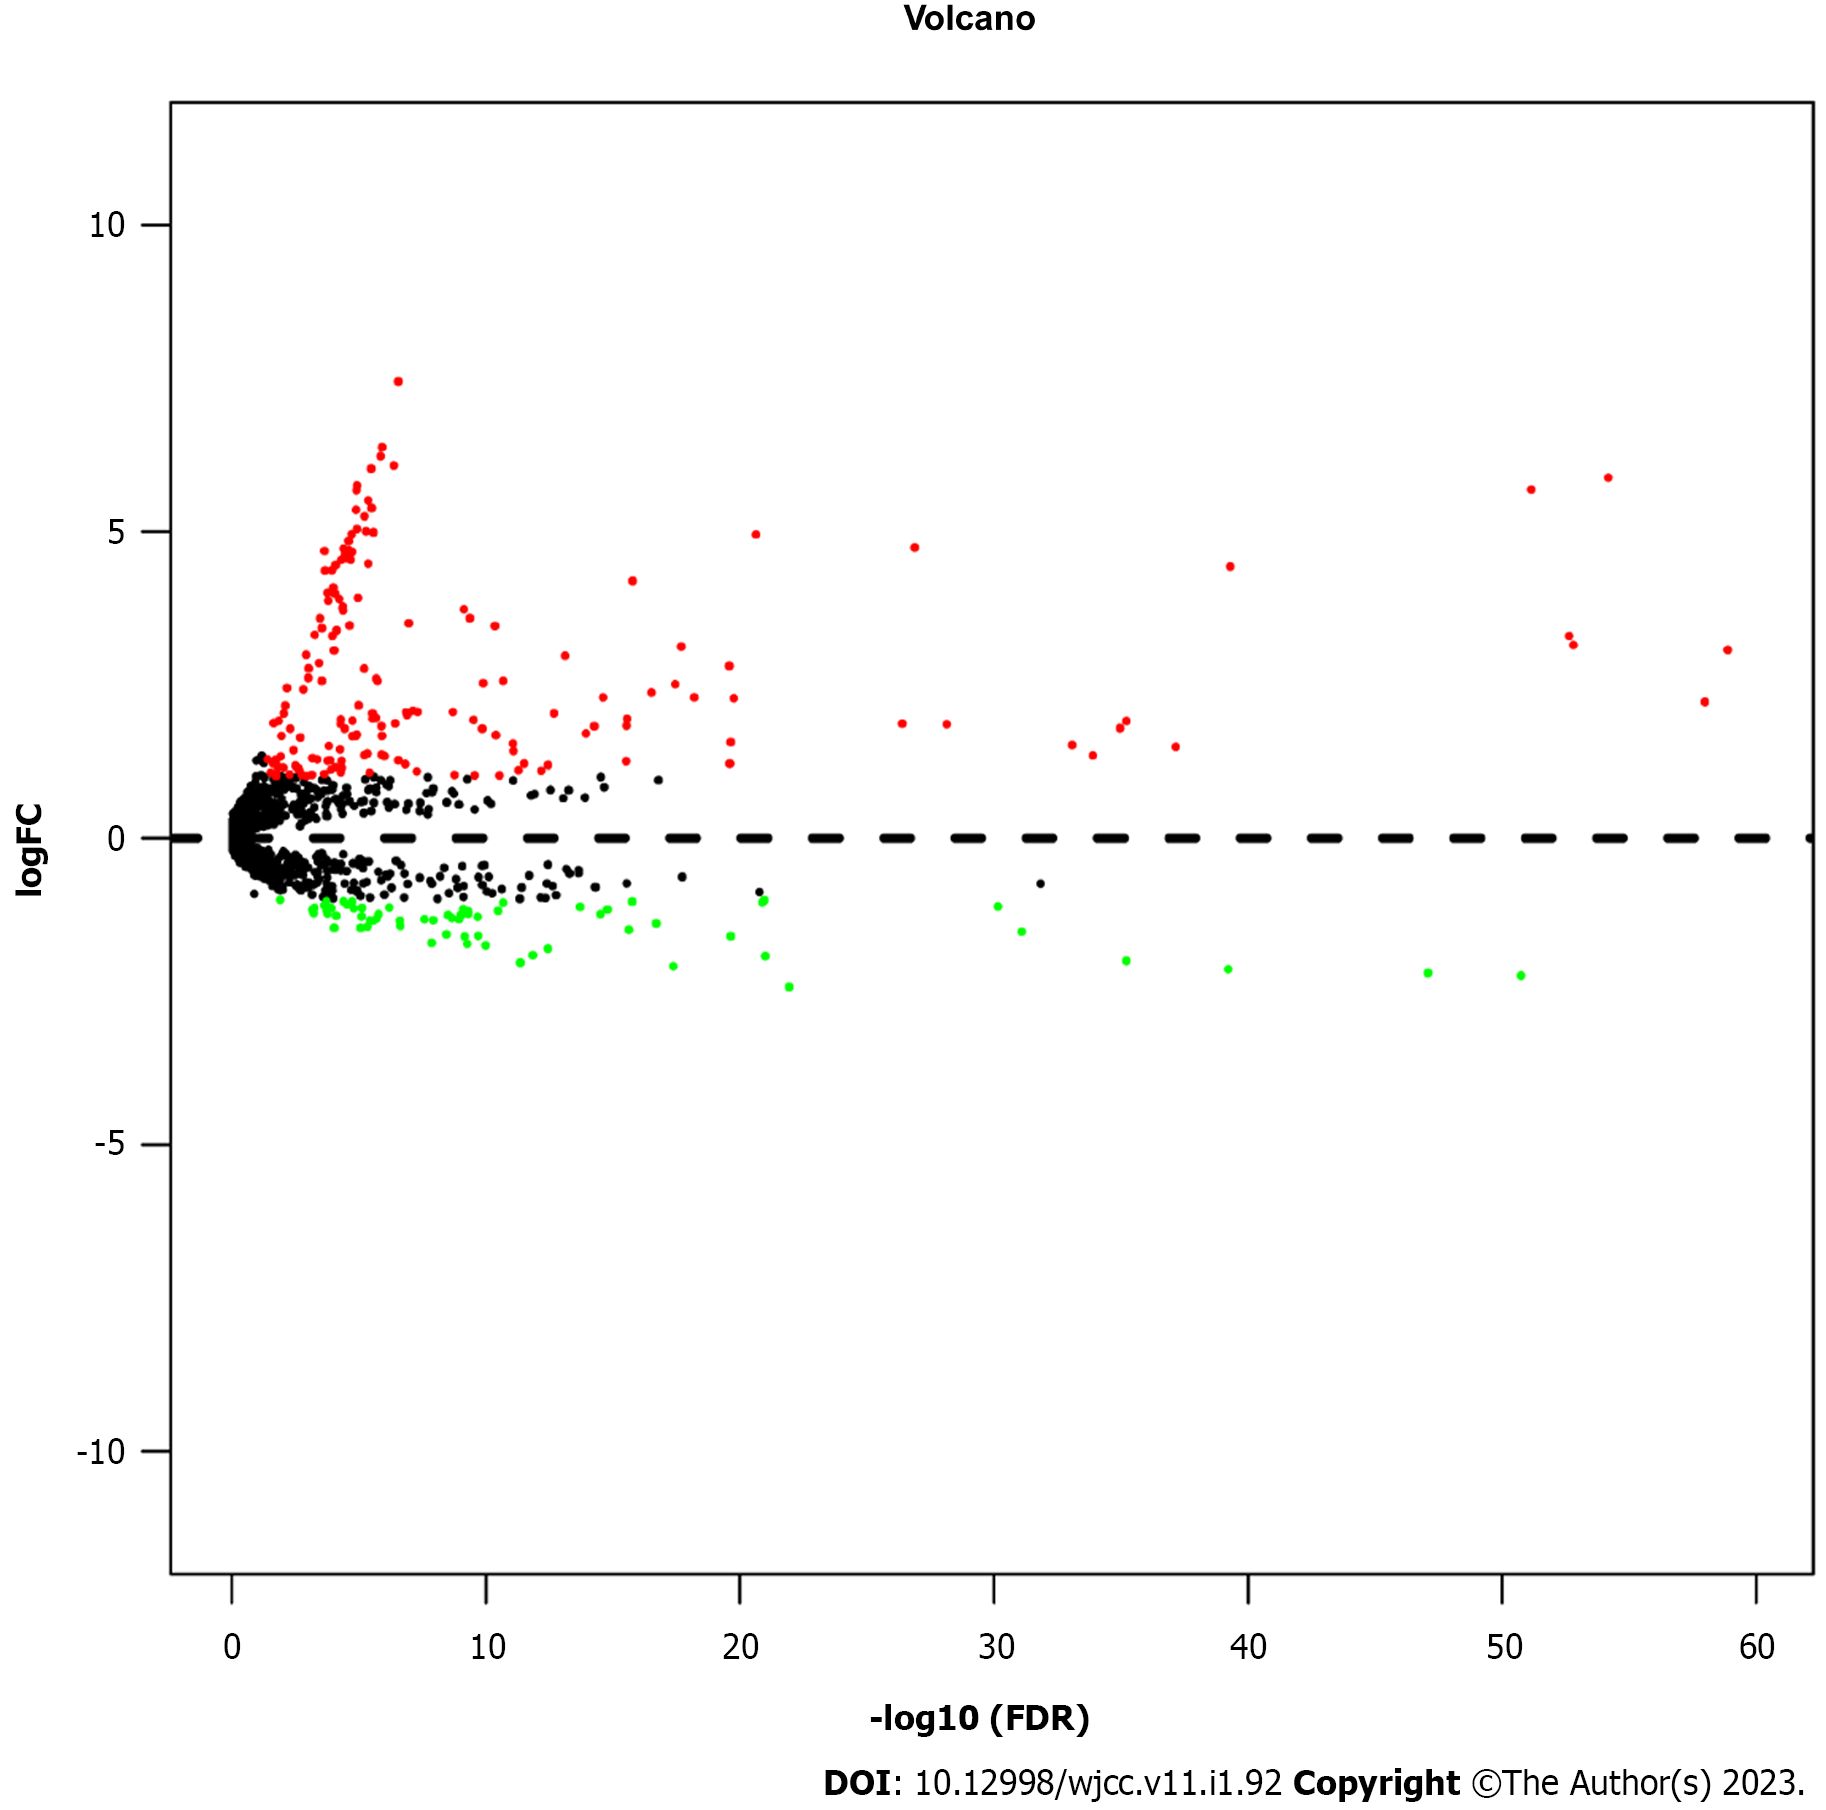
Figure 1 Volcano plot of 2202 miRNAs in papillary thyroid cancer patients.
The red color indicates up-regulated expression, and the green color represents down-regulated expression. FDR: False discovery rate; FC: Fold change.
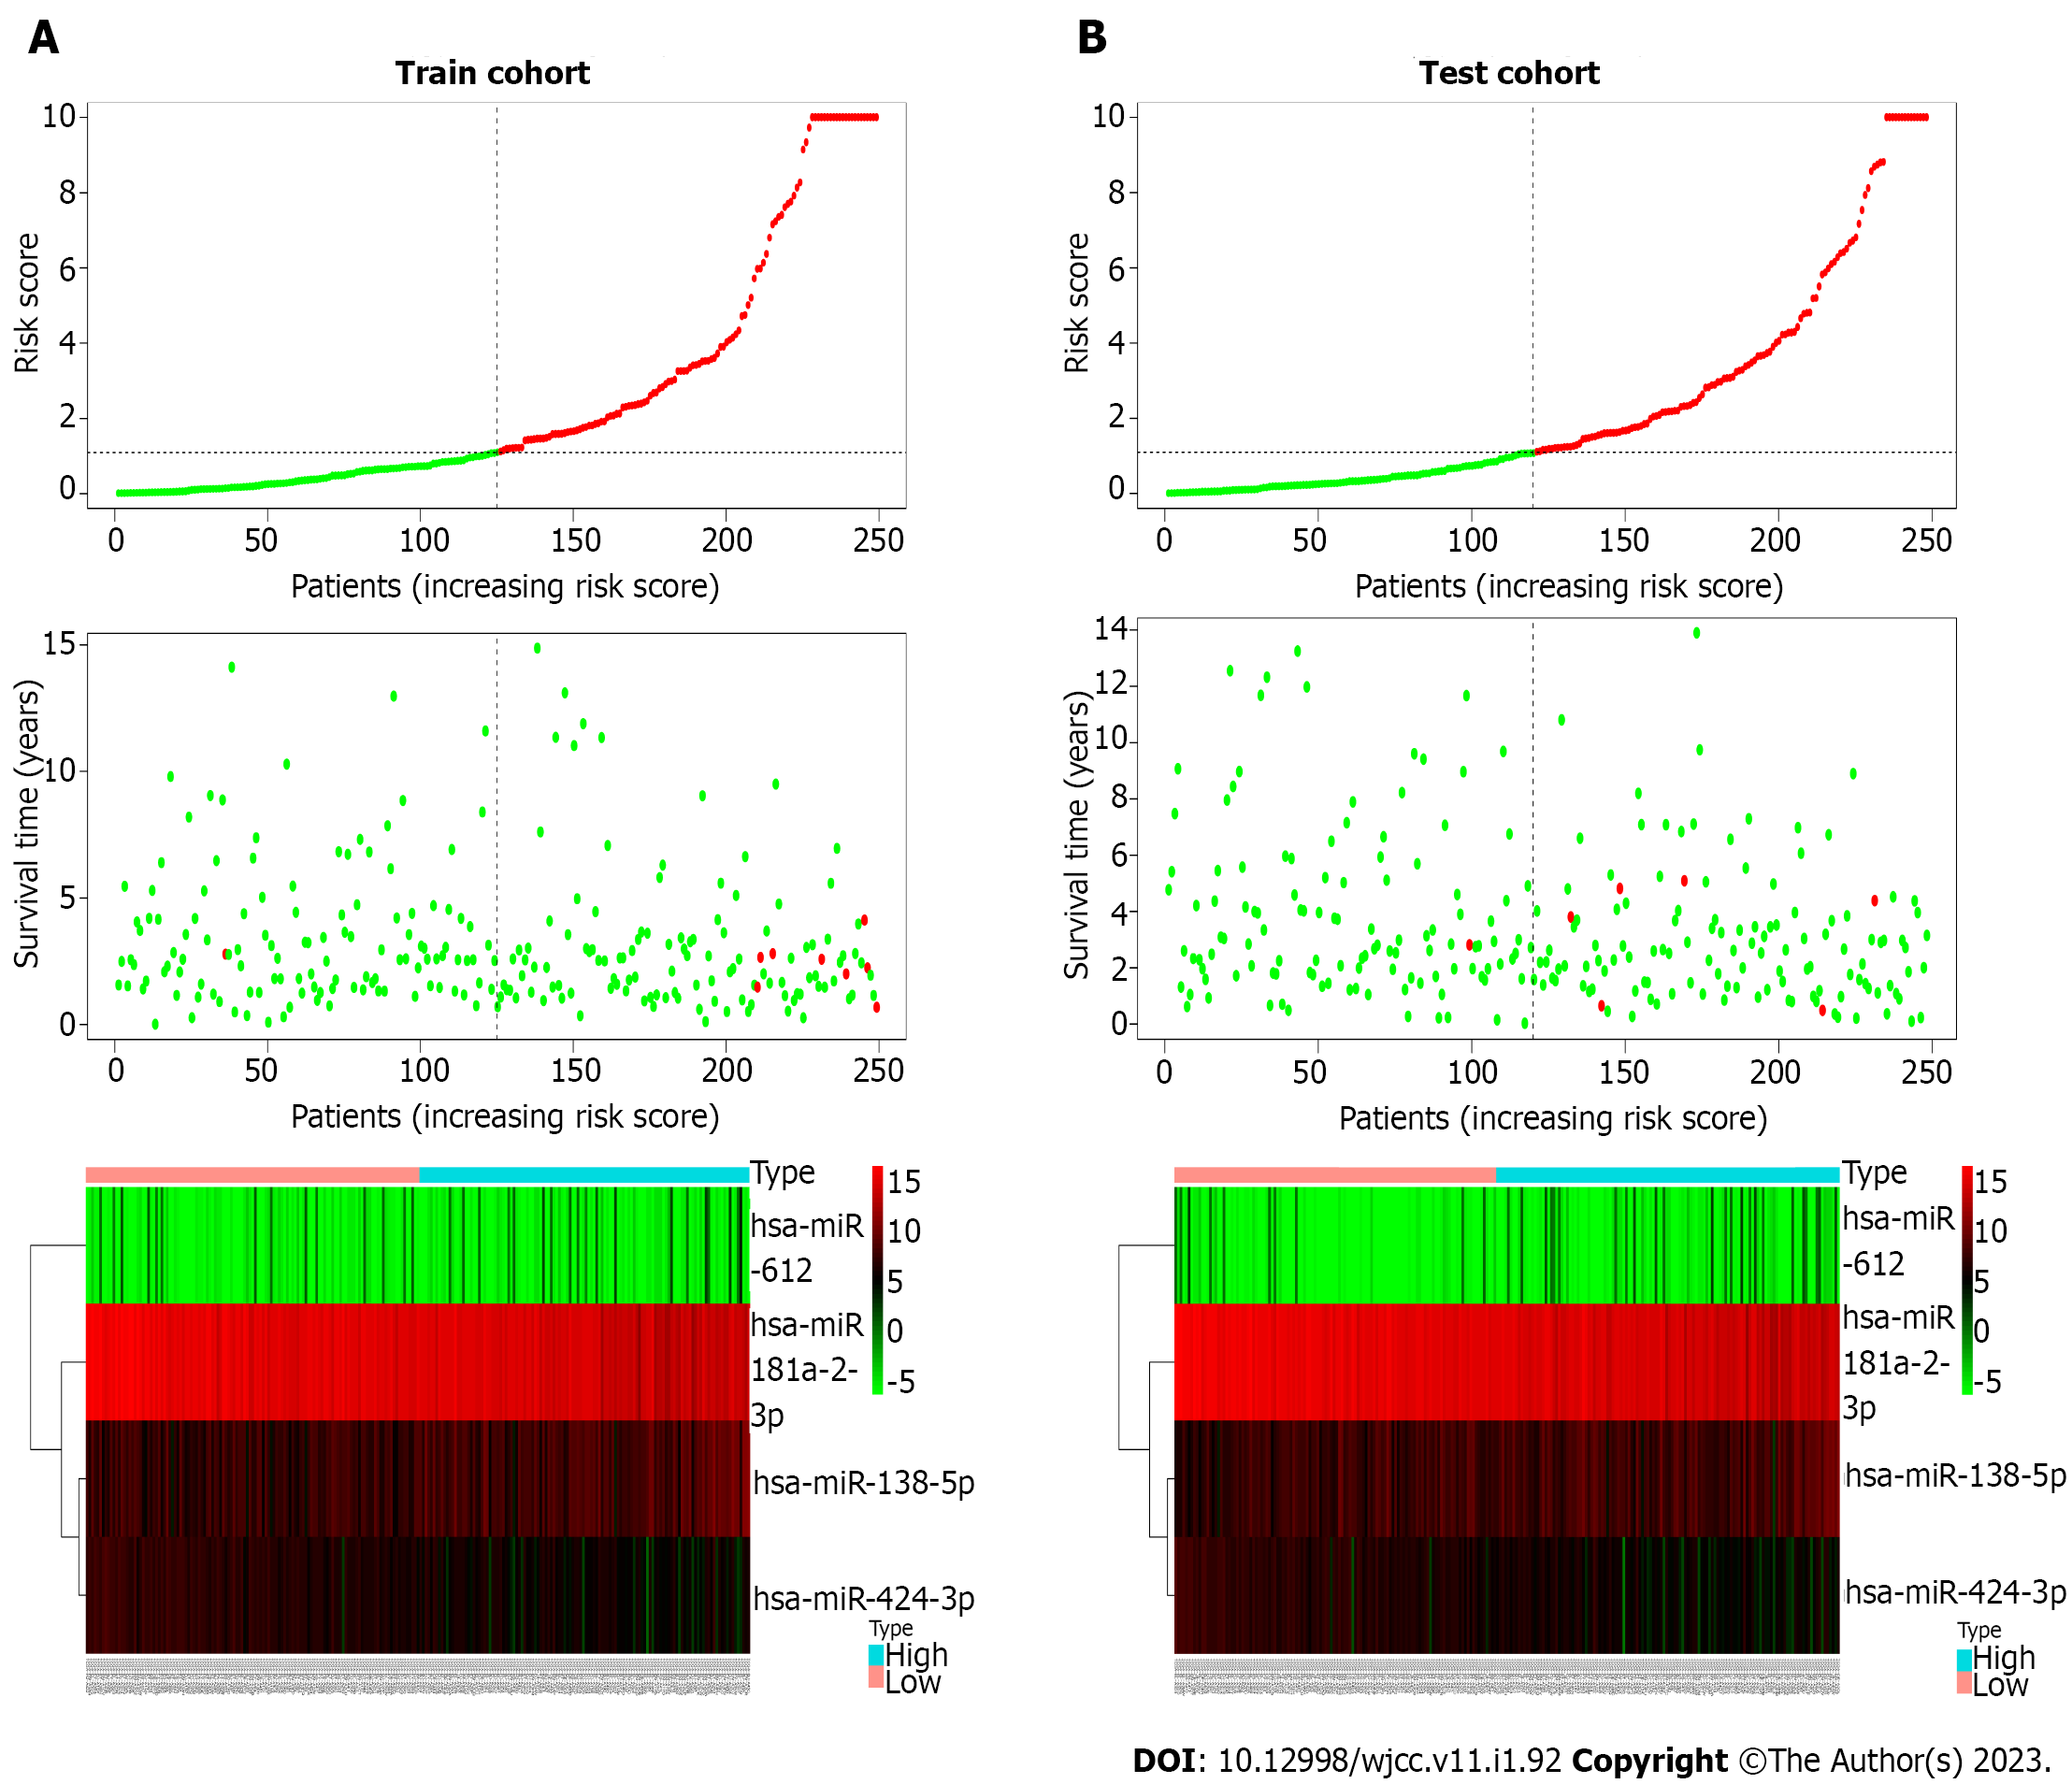
Figure 2 The distribution of the risk score, overall survival, and overall survival status and the heat map of the prognostic four-miRNA signature.
A: The training cohort; B: Test cohort. The dotted line indicates the cutoff point of the median risk score, which is used to stratify patients into the low-risk and high-risk groups.
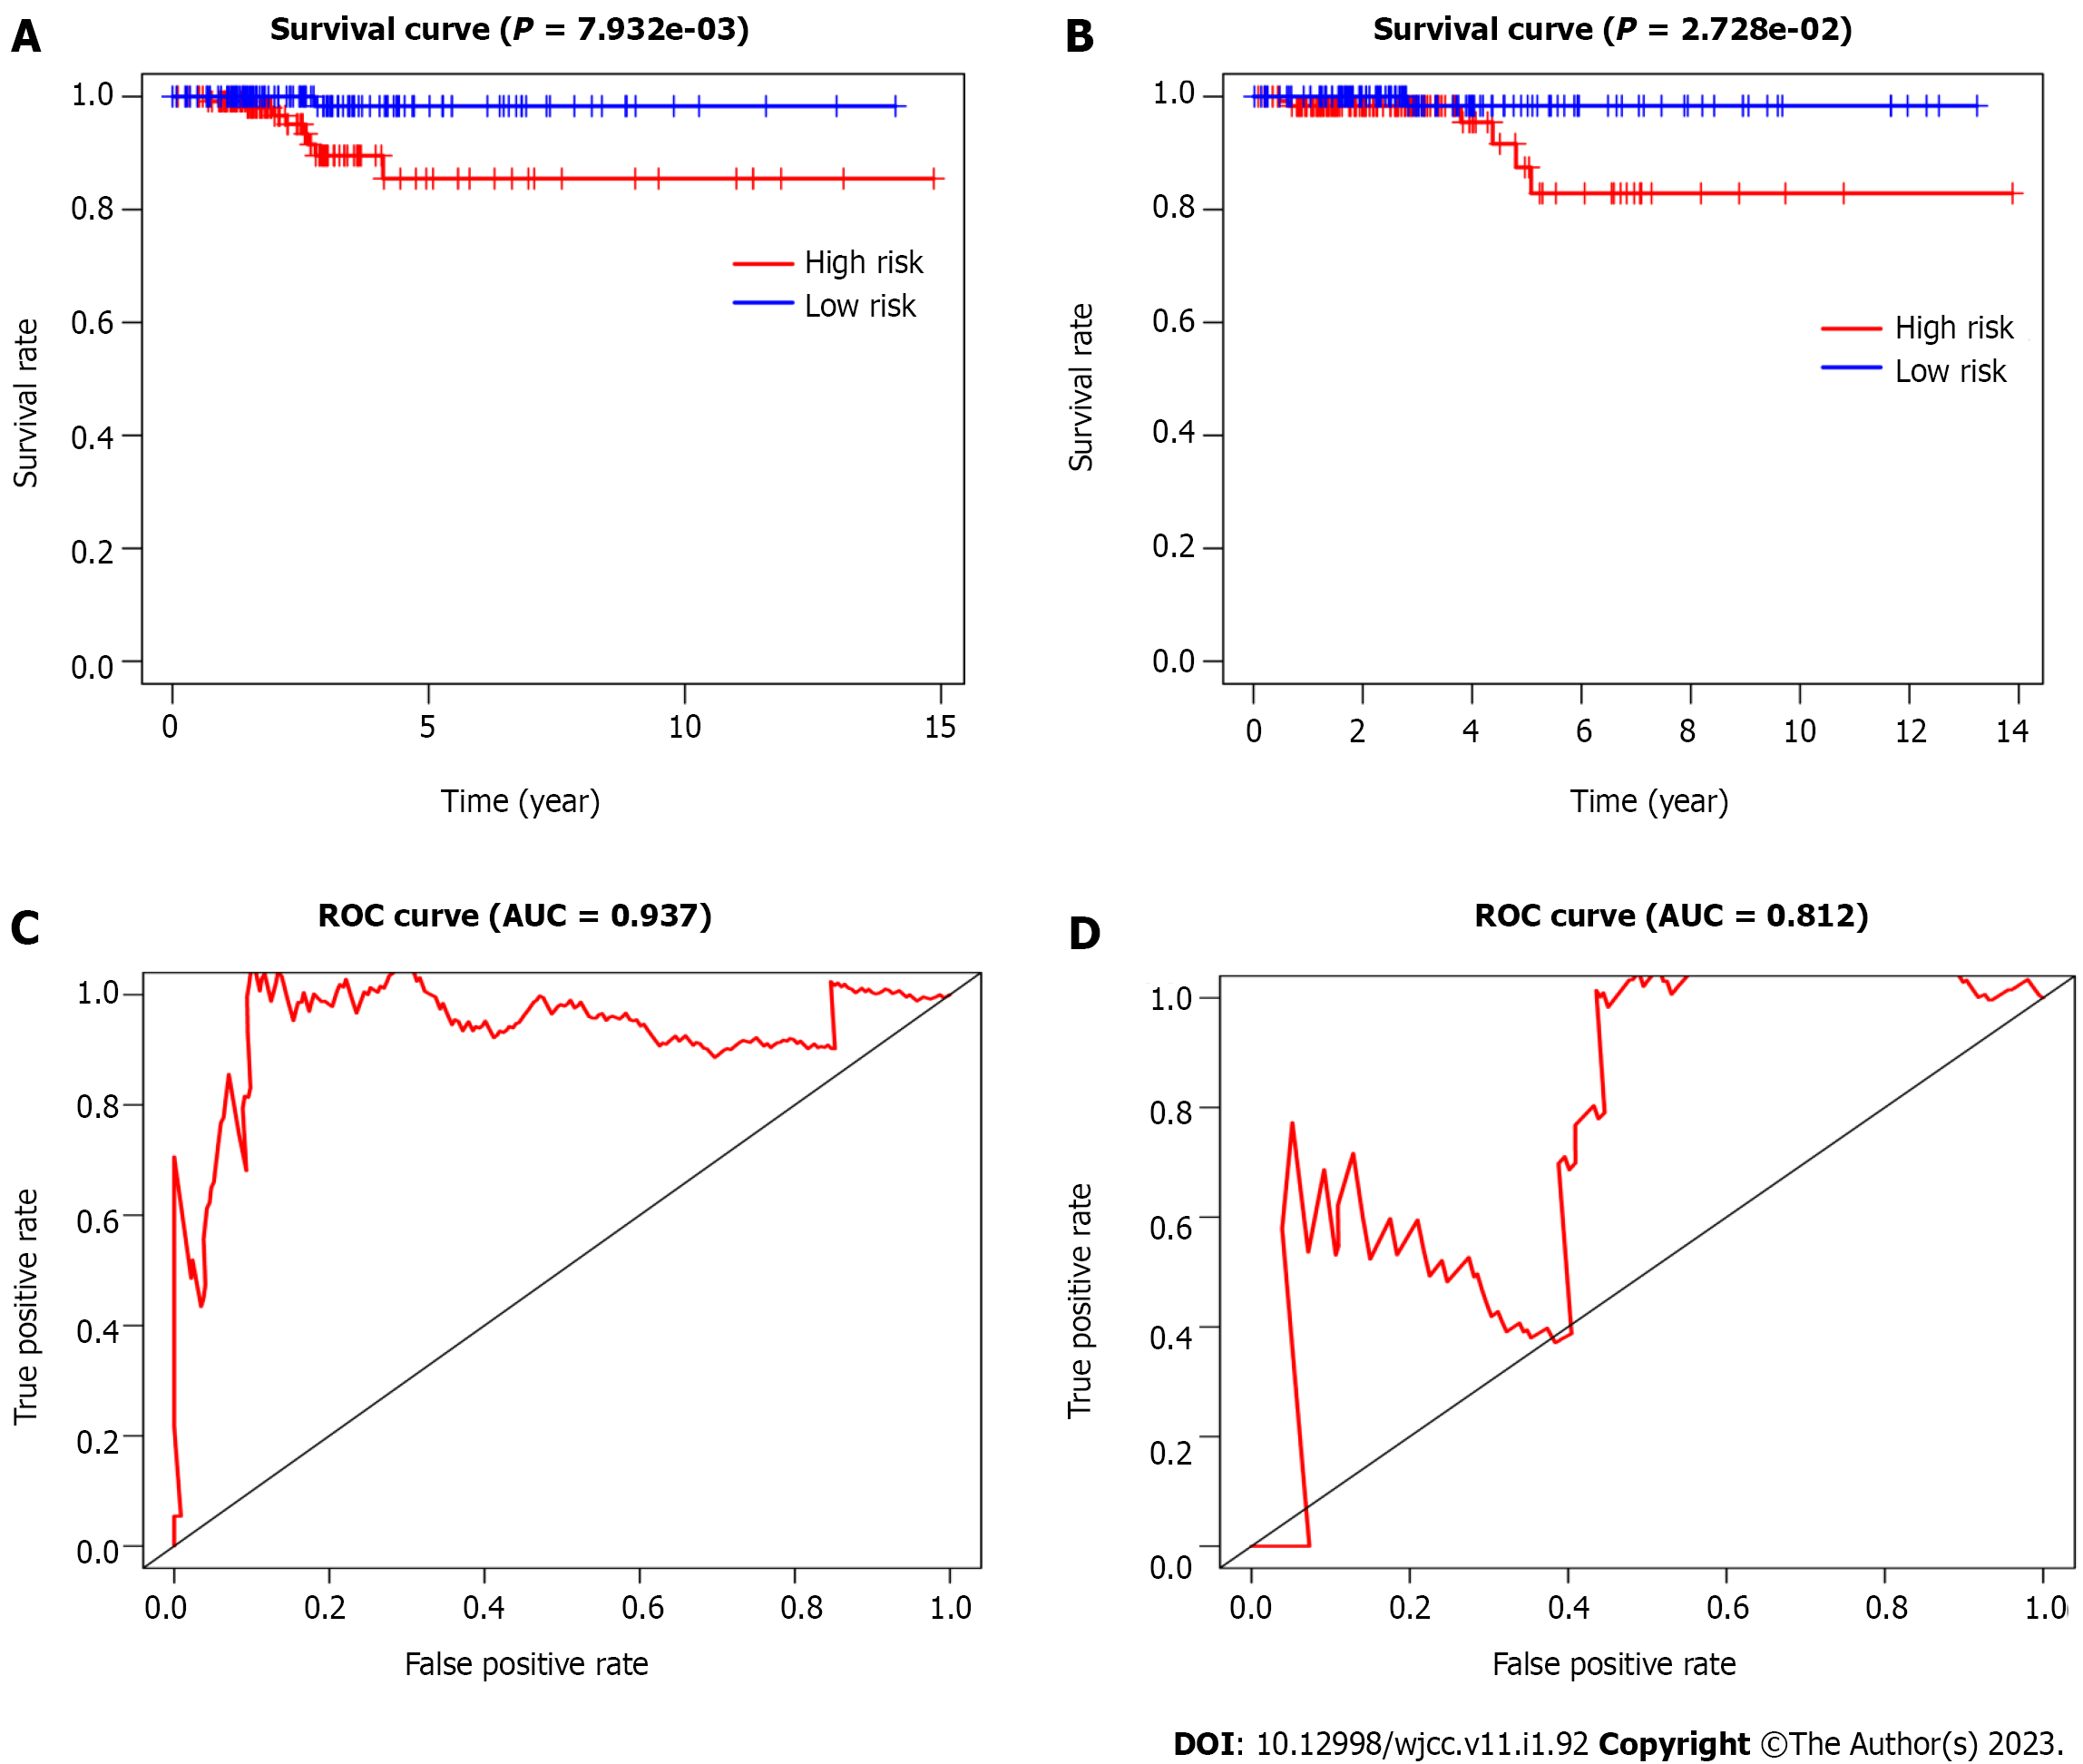
Figure 3 Kaplan-Meier curves of overall survival and time-dependent receiver operating characteristic curves of the 5-year survival rate for papillary thyroid cancer patients based on the four-miRNA signature.
A and C: Training cohort; B and D: Test cohort. AUC: Area under the curve; ROC: Receiver operating characteristic.
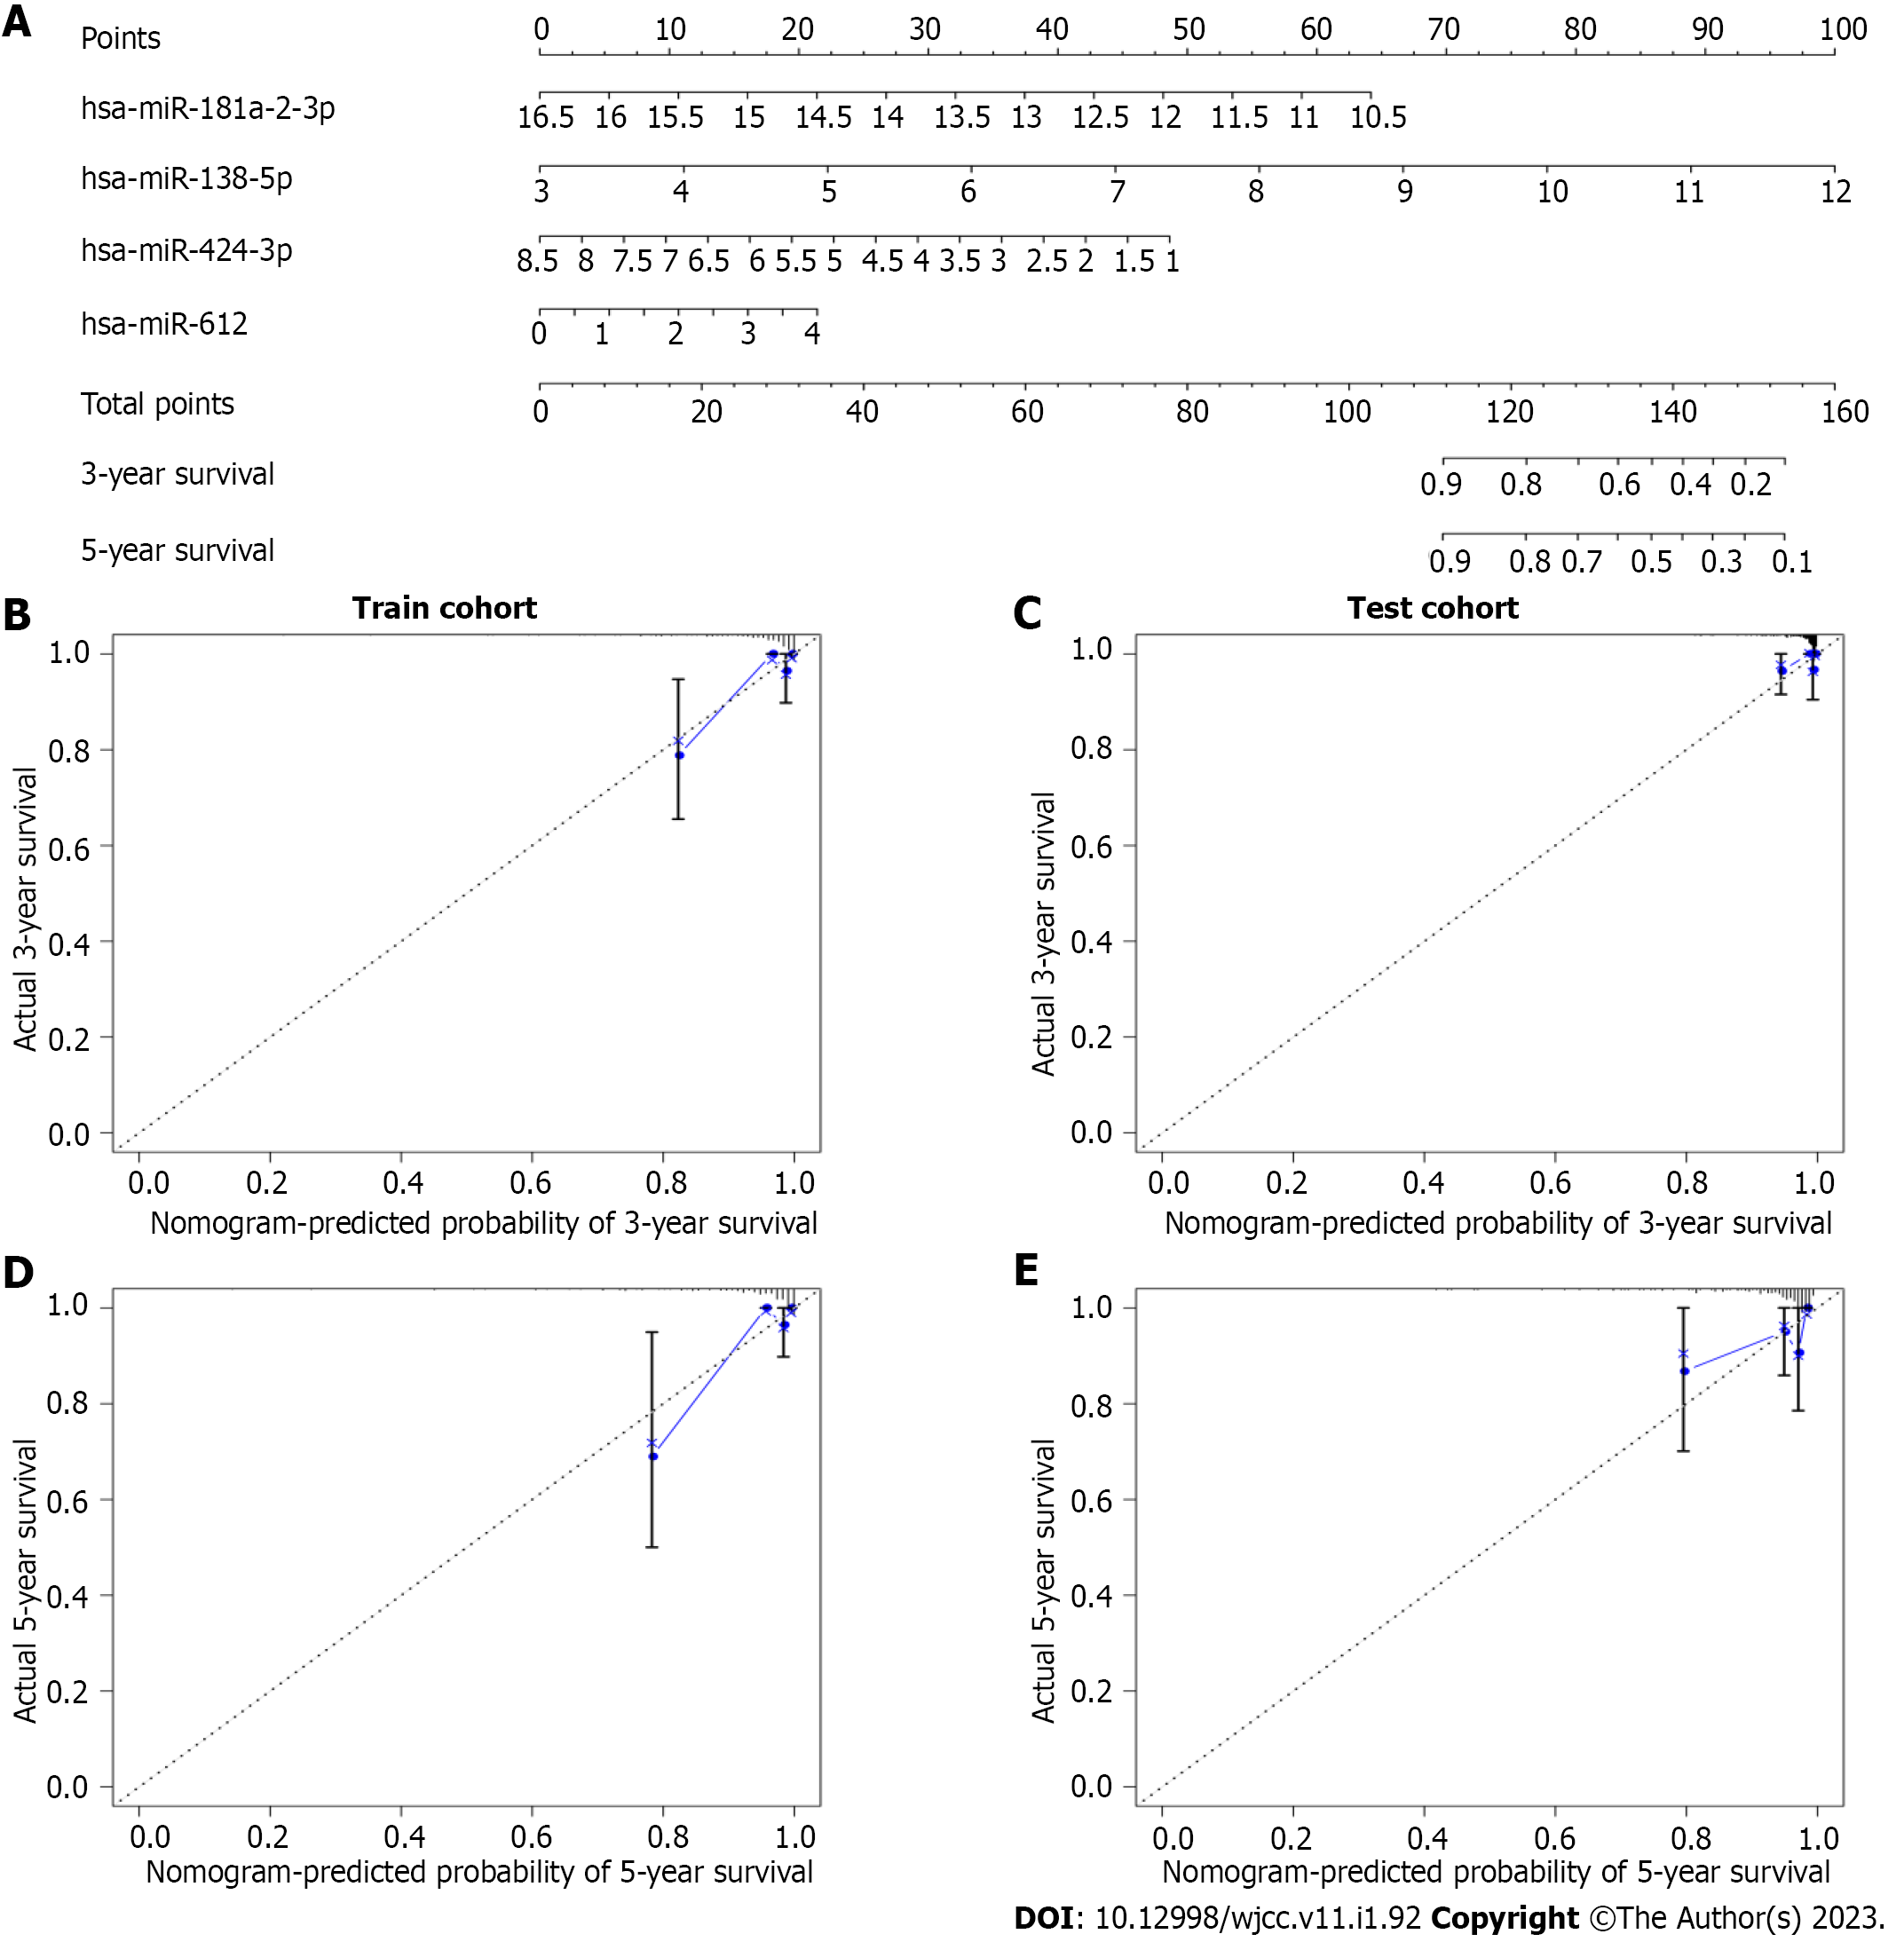
Figure 4 Prognostic nomogram and calibration plots of the four-miRNA signature.
A: The prognostic nomogram based on the four-miRNA signature; B and C: Calibration plots of the four-miRNA-based prognostic model in the training and test cohorts of the 3-year survival rate; D and E: Calibration plots of the four-miRNA-based prognostic model in the training and test cohorts of the 5-year survival rate.
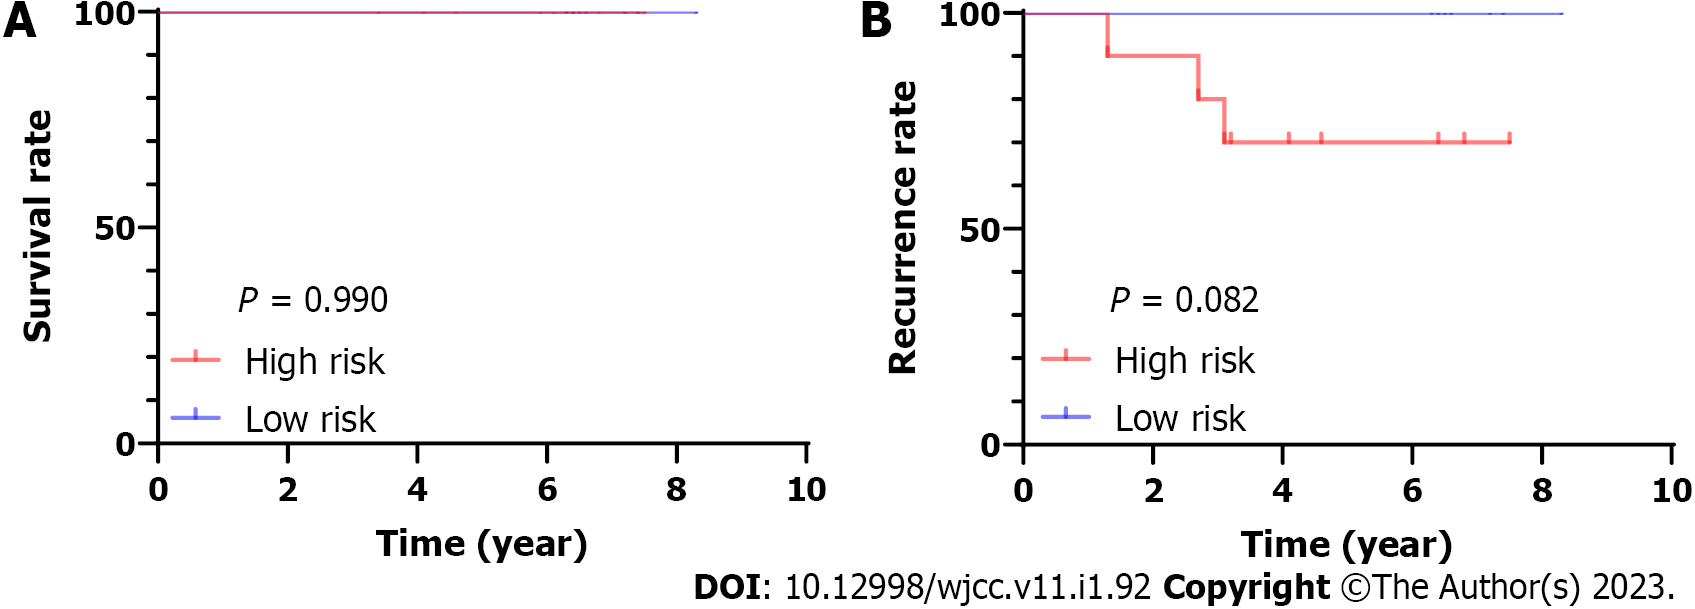
Figure 5 Validation the four-miRNA signature in transcriptome sequencing cohort.
A: Overall survival curves; B: Recurrence-free survival curves in the whole-transcriptome sequencing cohort.
- Citation: Yang F, Zhou YL. Identification of a four-miRNA signature predicts the prognosis of papillary thyroid cancer. World J Clin Cases 2023; 11(1): 92-103
- URL: https://www.wjgnet.com/2307-8960/full/v11/i1/92.htm
- DOI: https://dx.doi.org/10.12998/wjcc.v11.i1.92


