Copyright
©The Author(s) 2022.
World J Clin Cases. Mar 26, 2022; 10(9): 2908-2915
Published online Mar 26, 2022. doi: 10.12998/wjcc.v10.i9.2908
Published online Mar 26, 2022. doi: 10.12998/wjcc.v10.i9.2908
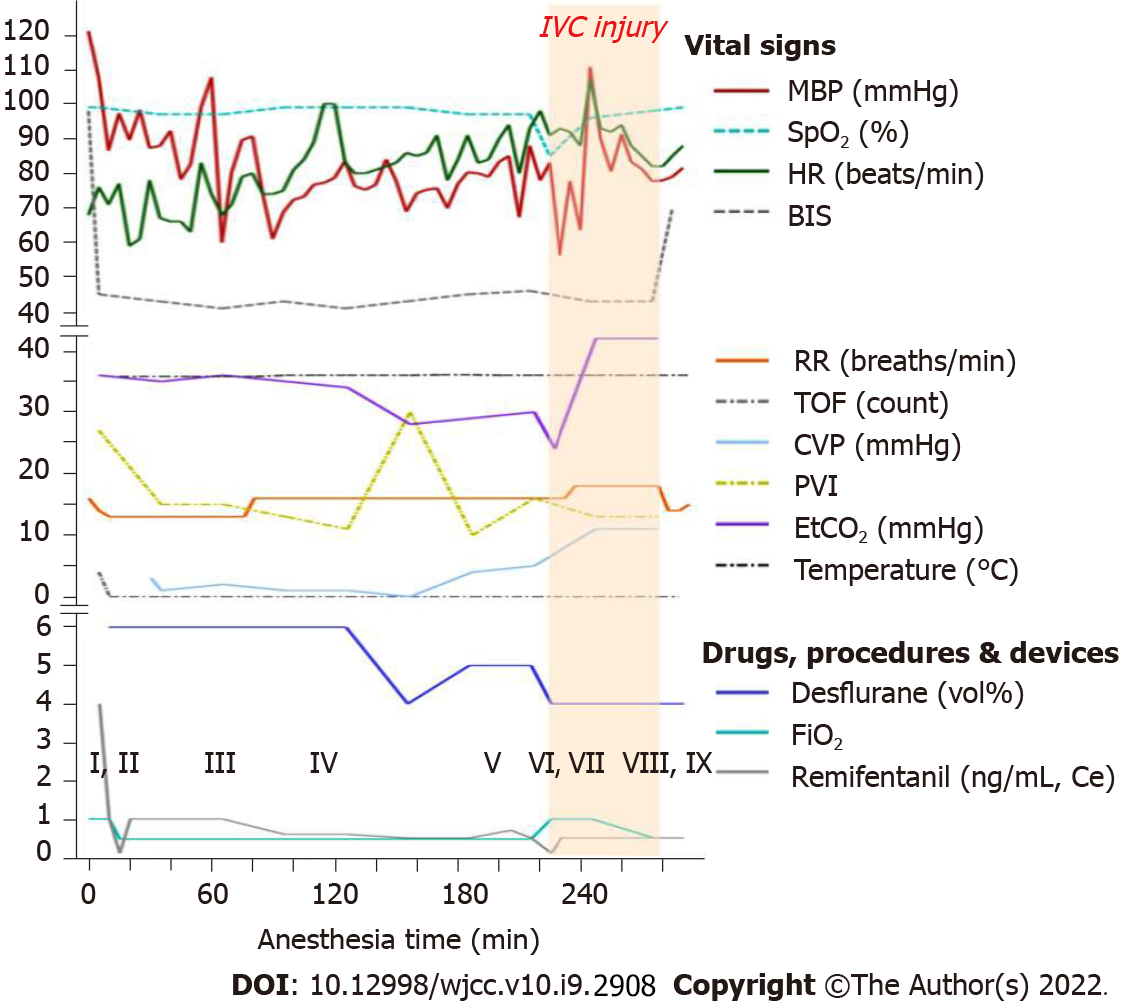
Figure 1 Case report timeline.
The vital signs, administered drugs, and laboratory findings during the operation. I: Propofol (70 mg) and atracurium (25 mg) i.v., start of phenylephrine infusion; II: Hydrocortisone (100 mg) i.v.; III: End of phenylephrine infusion and start of norepinephrine infusion; IV: 1st ABGA (pH, 7.300; PCO2, 48.2 mmHg; PO2, 100.7 mmHg; Hb, 13.9 g/dL; Na+, 140 mmol/L; K+, 4.3 mmol/L; lactic acid, 1.43 mmol/L); V: 2nd ABGA (pH, 7.161; PCO2, 70.9 mmHg; PO2, 121.8 mmHg; Hb, 13.1 g/dL; Na+, 142 mmol/L; K+, 4.2 mmol/L; lactic acid, 2.23 mmol/L); VI: “Mill-wheel” murmur auscultated over the precordium; 3rd ABGA (pH, 7.112; PCO2, 78.8 mmHg; PO2, 73.3 mmHg; Hb, 12.7 g/dL; Na+, 142 mmol/L; K+, 4.2 mmol/L; lactic acid, 2.47 mmol/L]; TEE: gas bubble scattered in right and left heart, and ascending aorta; VII: Start of transfusion of 1 unit packed red blood cells; VIII: 4th ABGA (pH, 7.282; PCO2, 50.5 mmHg; PO2, 111.1 mmHg; Hb, 13.1 g/dL; Na+, 141 mmol/L; K+, 4.6 mmol/L; lactic acid, 2.31 mmol/L); TEE: CO2 gas bubble reduced; IX: The patient was transferred to a surgical intensive care unit. IVC: Inferior vena cava, MBP: Mean blood pressure, SpO2: Pulse oximetry, HR: Heart rate, BIS: Bispectral index, RR: Respiratory rate, TOF: Train of four, CVP: Central venous pressure, PVI: Pleth variability index, EtCO2: End-tidal CO2, Ce: Effect-site concentration, iv: Intravenous, ABGA: Arterial blood gas analysis, PCO2: Arterial carbon dioxide partial pressure, PO2: Arterial oxygen partial pressure, TEE: Transesophageal echocardiography.
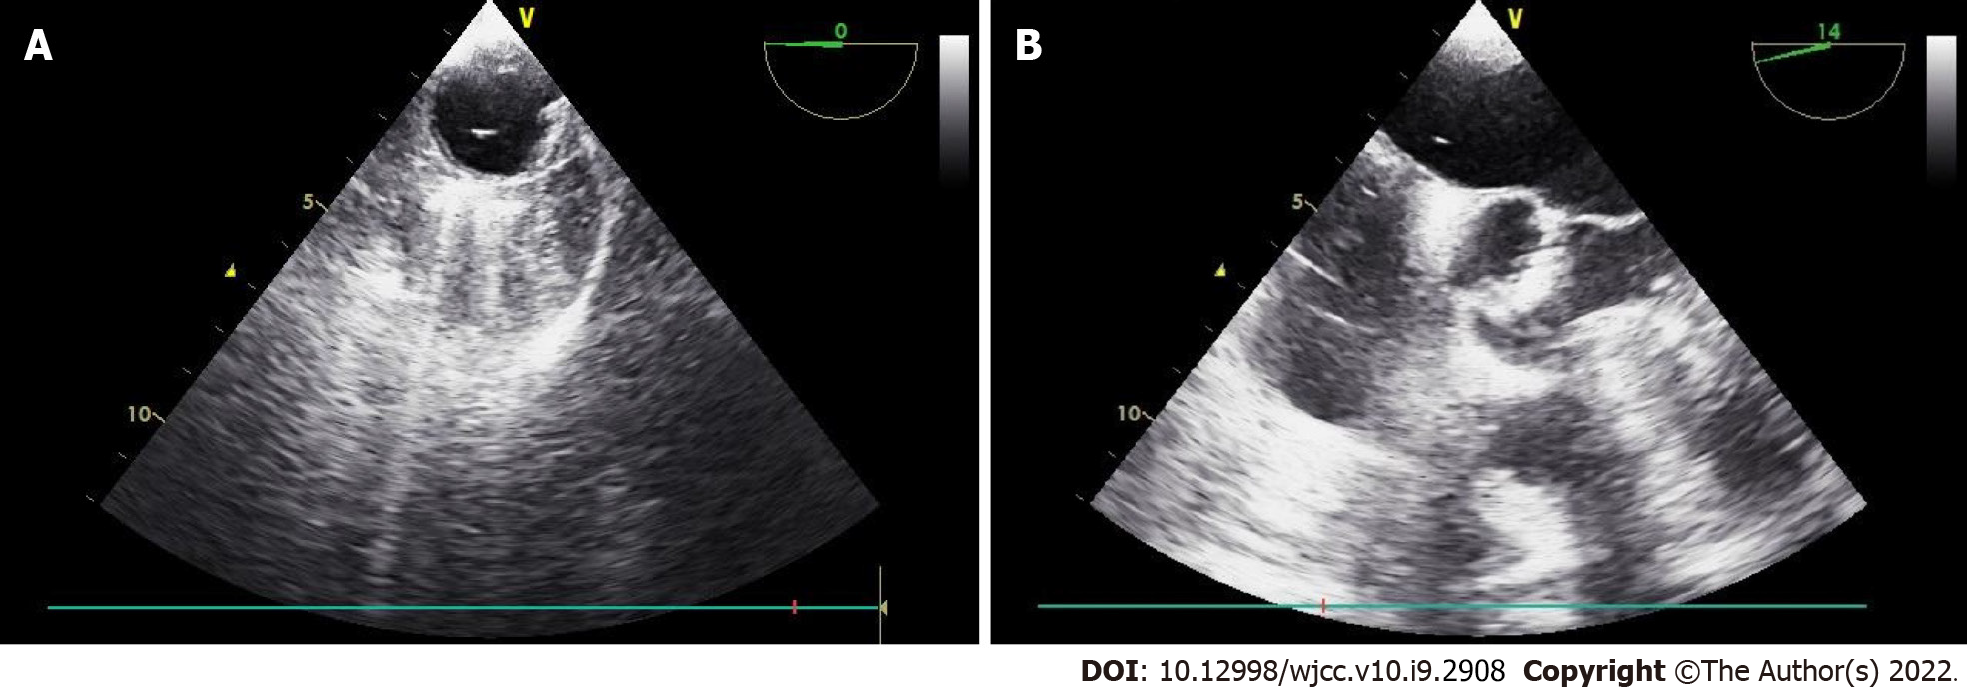
Figure 2 Intraoperative transesophageal echocardiography.
A: On the descending aortic short axis view, transesophageal echocardiography (TEE) shows gas bubbles in the aorta. B: On the mid-esophageal aortic valve short axis view, TEE shows gas bubbles in both the atrium and aortic valve.
Figure 3 Intraoperative transesophageal echocardiography after 30 minutes.
A: On the descending aortic short axis view, gas bubbles are not seen. B: On the mid-esophageal aortic valve short axis view, gas bubbles are not seen.
- Citation: Jeon S, Hong JM, Lee HJ, Kim Y, Kang H, Hwang BY, Lee D, Jung YH. Paradoxical carbon dioxide embolism during laparoscopic hepatectomy without intracardiac shunt: A case report. World J Clin Cases 2022; 10(9): 2908-2915
- URL: https://www.wjgnet.com/2307-8960/full/v10/i9/2908.htm
- DOI: https://dx.doi.org/10.12998/wjcc.v10.i9.2908


