Copyright
©The Author(s) 2022.
World J Clin Cases. Mar 26, 2022; 10(9): 2818-2828
Published online Mar 26, 2022. doi: 10.12998/wjcc.v10.i9.2818
Published online Mar 26, 2022. doi: 10.12998/wjcc.v10.i9.2818
Figure 1 Treatment course.
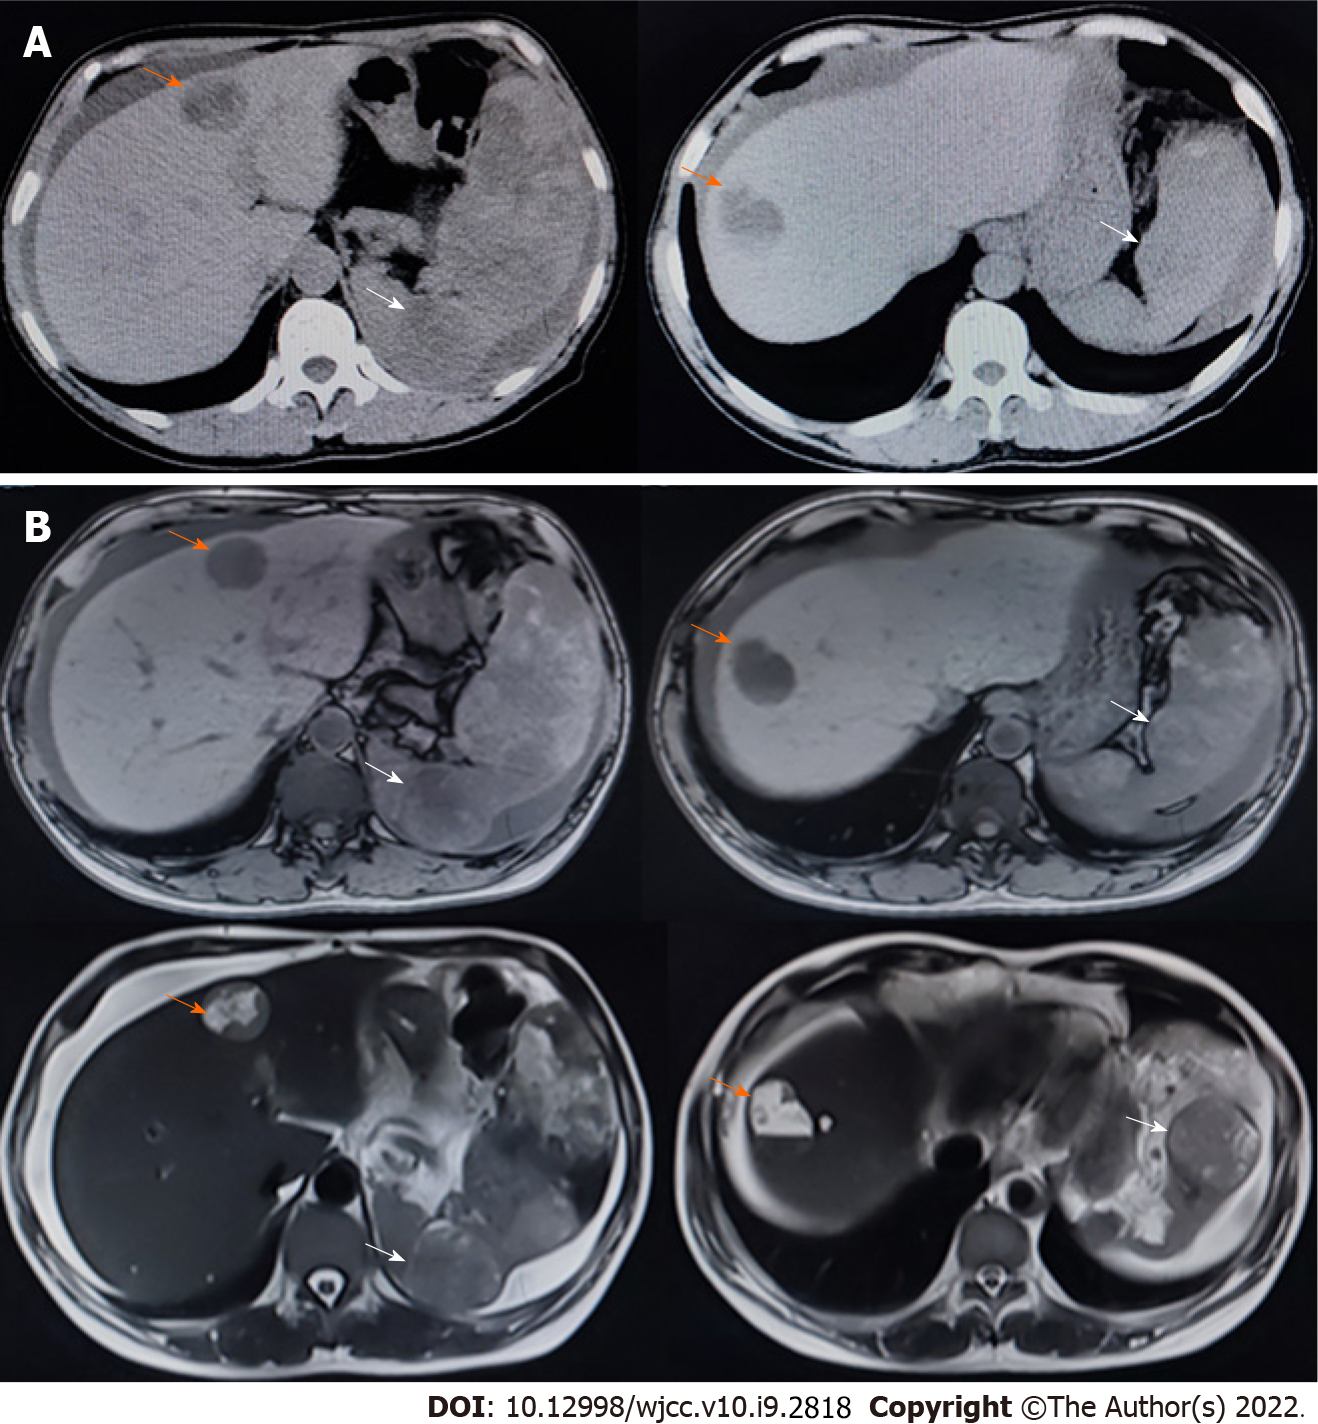
Figure 2 Computed tomography and magnetic resonance imaging performed soon after the first hospitalization.
Scale bar: 10 cm. A: We observed multiple masses in the liver and spleen on computed tomography; B: We observed multiple masses in the liver and spleen on magnetic resonance imaging. Orange arrows indicate masses in the liver, while the white arrows indicate masses in the spleen.
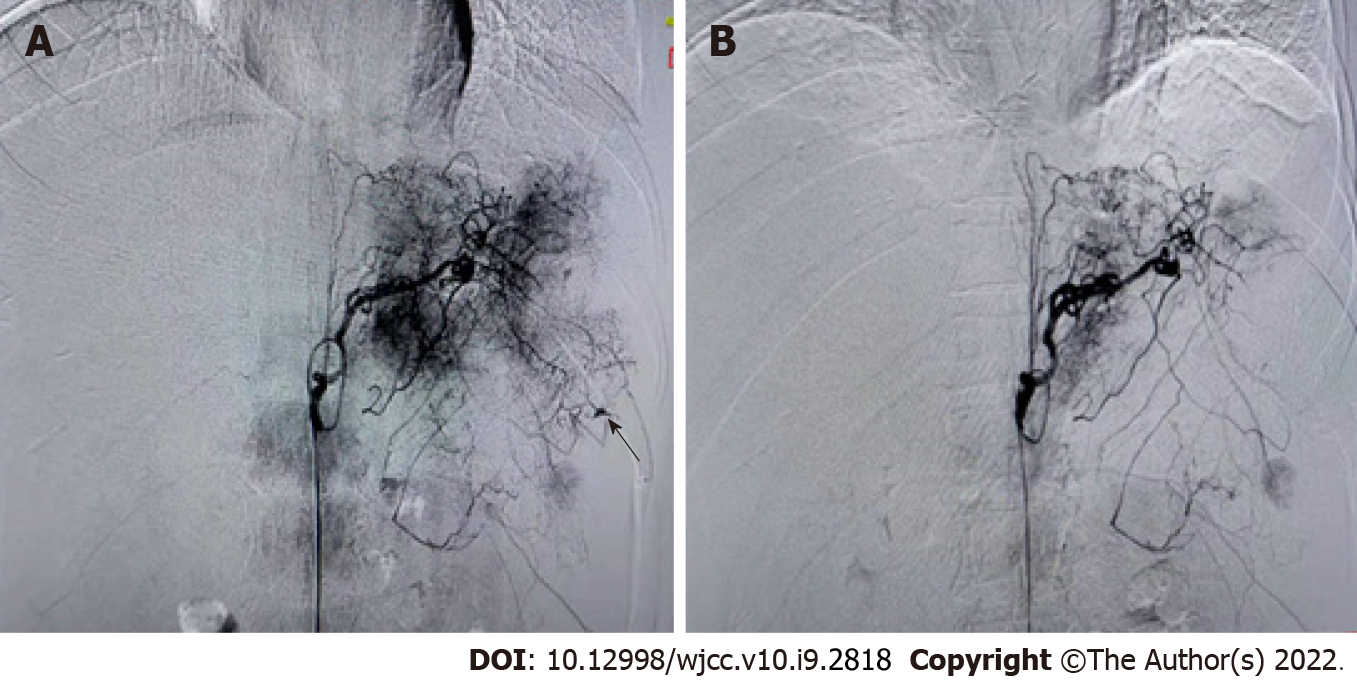
Figure 3 Digital subtraction angiography revealed the condition of the spleen before and after artery embolization.
A: Imaging before splenic artery embolization. The black arrow indicates bleeding points; B: Imaging after splenic artery embolization.
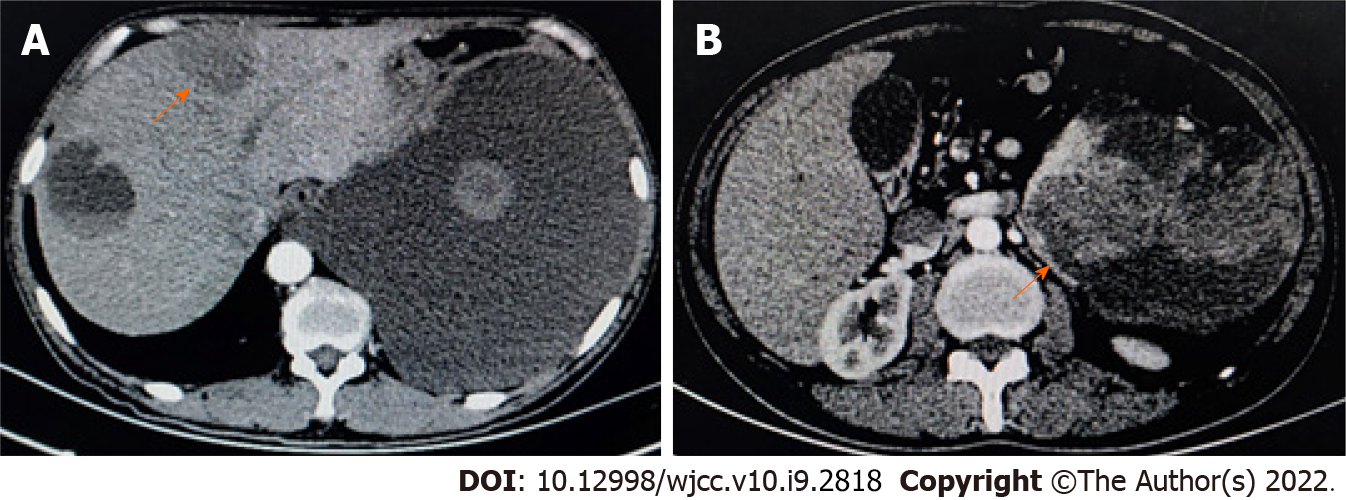
Figure 4 Plain and enhanced computed tomography revealed multiple round shadows of low density in the spleen and liver.
A: Computed tomography scan revealed that, in the left and right liver parenchyma, circular hypodensity reduction was observed with uneven density. On enhanced scan, the solid components showed slight enhancement, and no enhancement of hypodensity was observed. Massive pleural effusion; B: The spleen was enlarged, and multiple abnormal cystic solid density shadows were observed in and around the spleen. Enhanced scanning showed mild enhancement and partial fusion. The orange arrows indicate circular hypo-density regions.
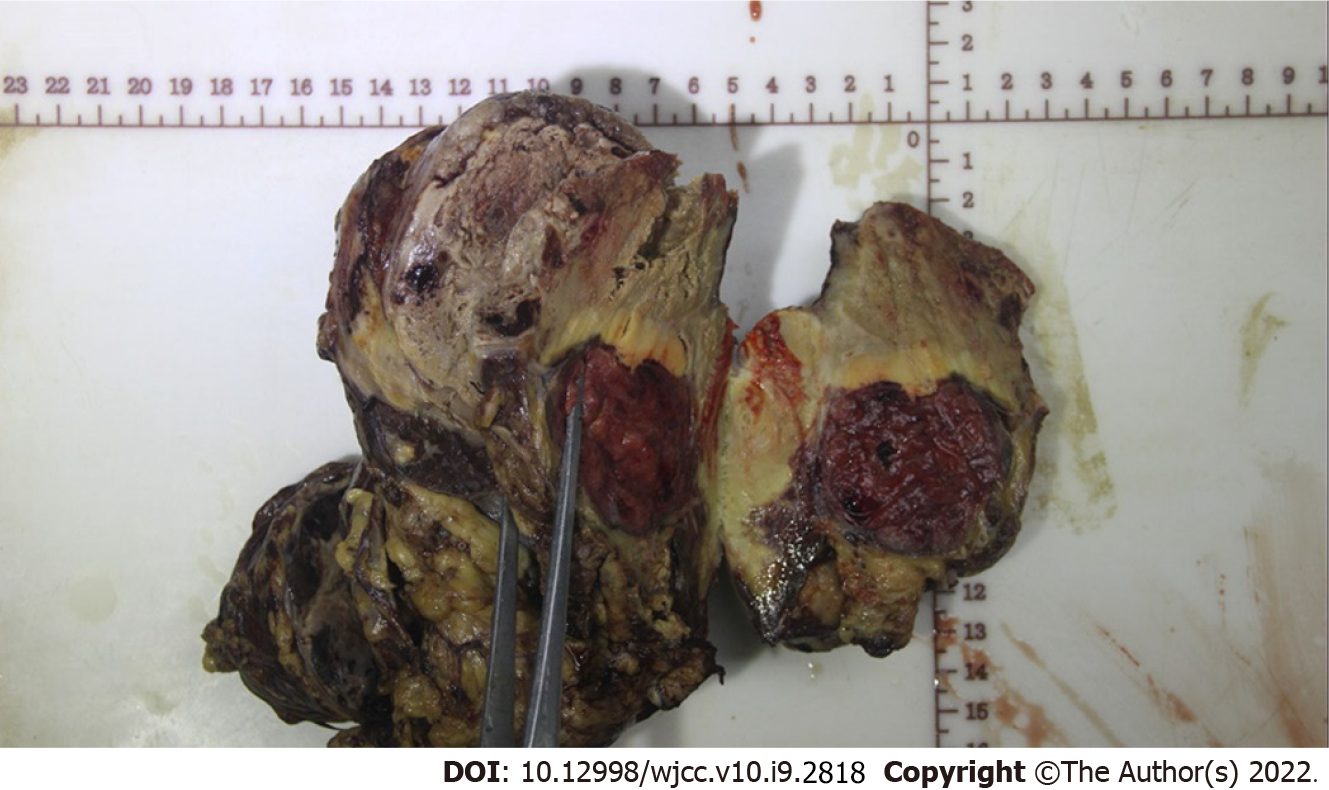
Figure 5 The resected tumor tissue.
Specimen cross-sectioning revealed a demarcated yellowish-white lesion accompanied by hemorrhage and necrosis, which was 4 cm × 6 cm in size.
Figure 6 Hematoxylin and eosin staining and immunohistochemistry of the specimen.
A: Hematoxylin and eosin staining showed the morphology of the tumor cells; B: Immunohistochemistry (IHC) revealed that the patient was positive for CD31, which was characteristic of tumor cells derived from vascular endothelium; C: The results of IHC revealed that the patient was negative for CD34. Shown at × 100 original magnification.
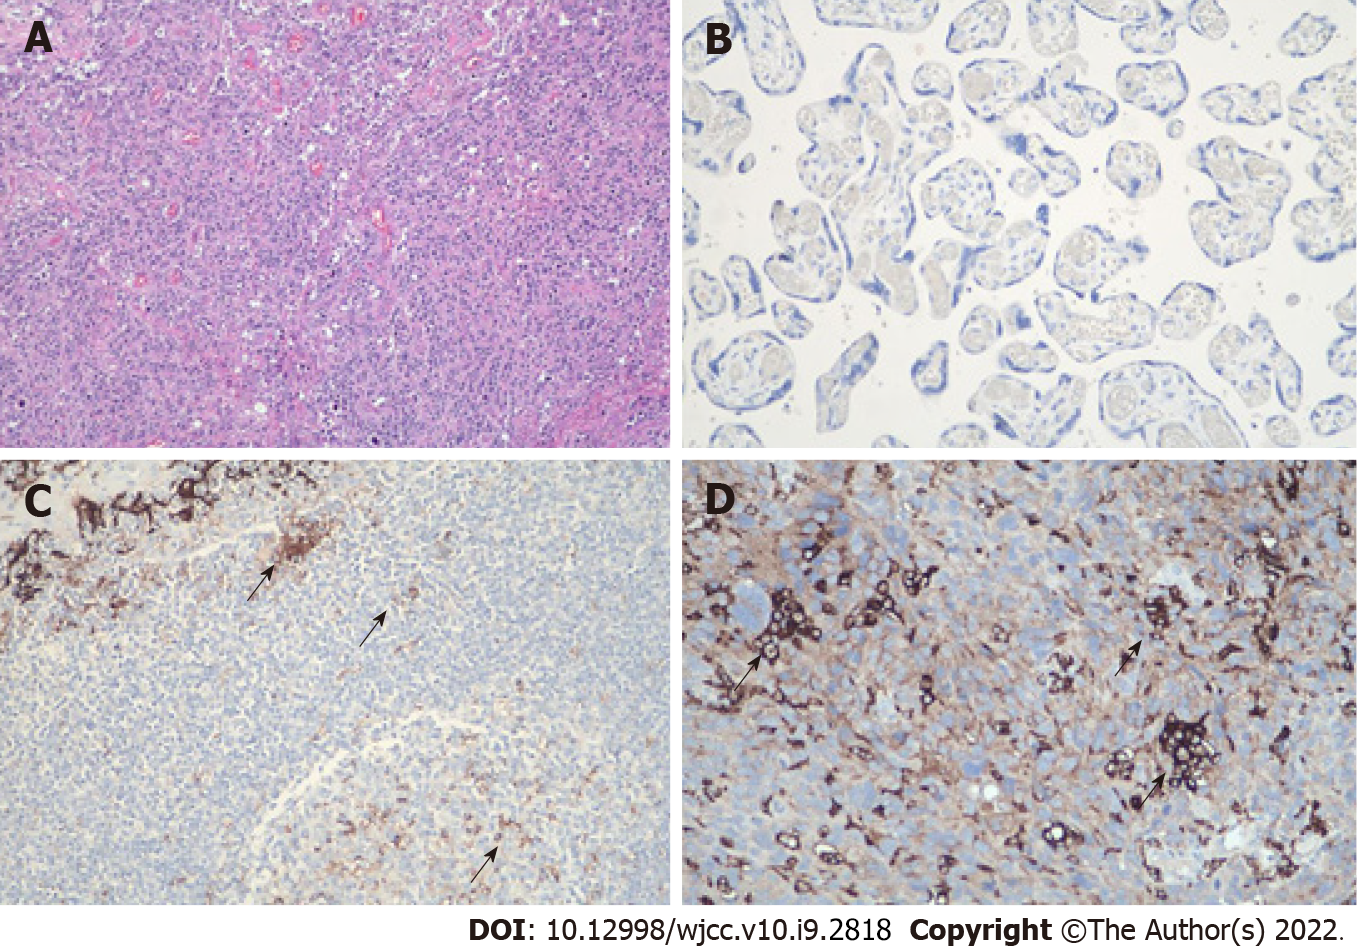
Figure 7 The level of programmed death ligand-1 protein was detected using immunohistochemistry by the Dako programmed death ligand-1 immunohistochemistry 22c3 PharmDx kit.
A: Hematoxylin and eosin staining of the specimen, shown at × 100 original magnification; B: Negative control for the test, shown at × 200 original magnification; C: Positive control for the test, shown at × 200 original magnification; D: Immunohistochemistry revealed that this patient was positive for programmed death ligand-1 (PD-L1) in the cytomembrane of tumor cells (trehalose-6-phosphate synthase = 20%, cervical pedicle screws = 22), shown at × 200 original magnification. The black arrows indicate cells with high PD-L1 expression.
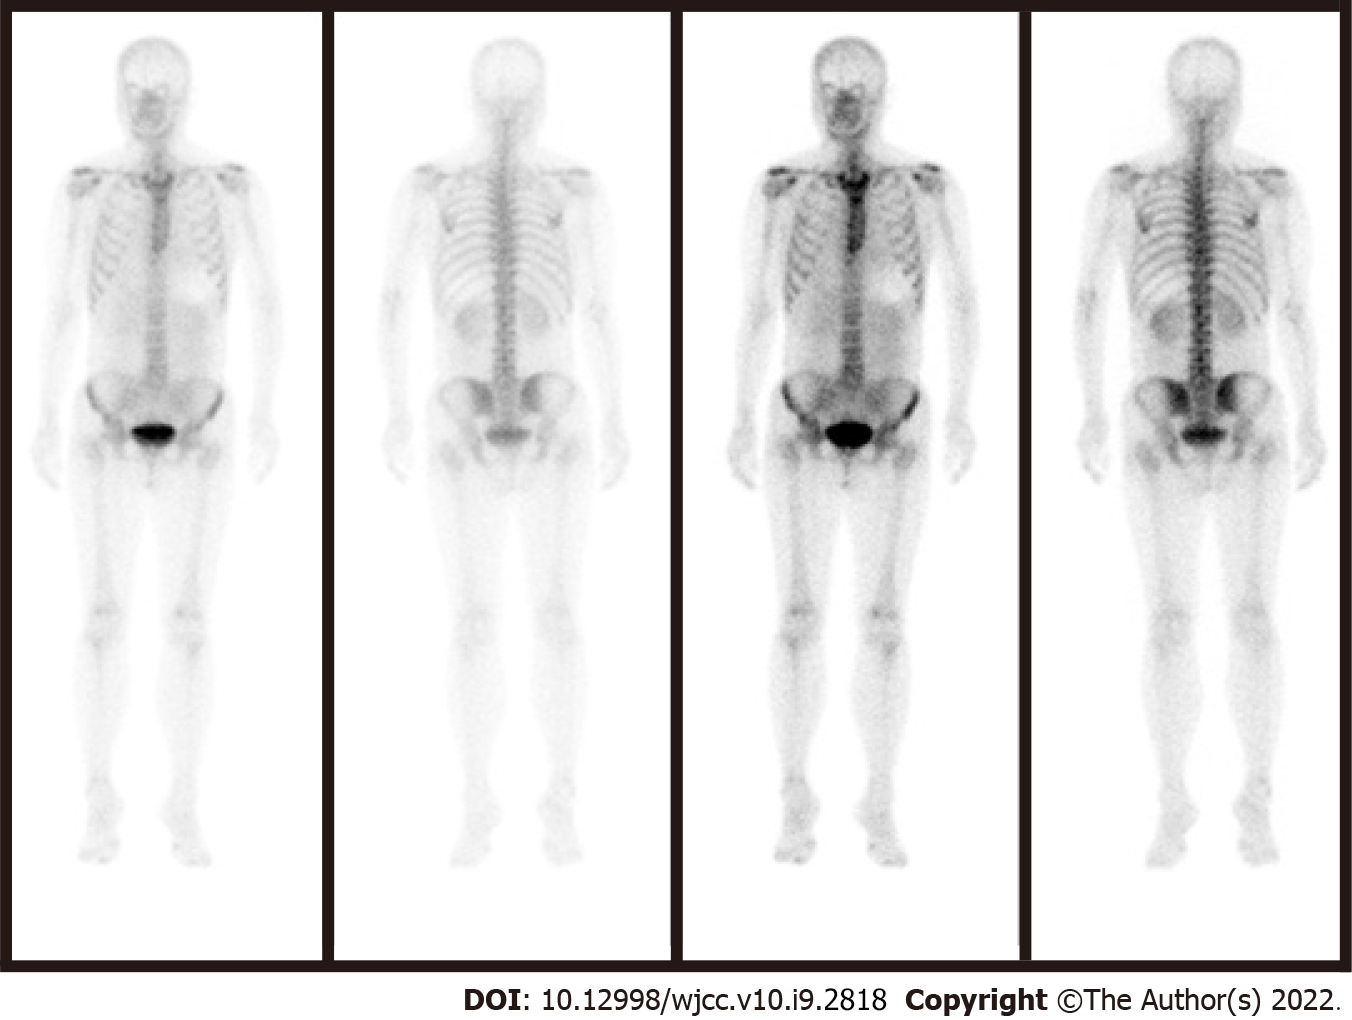
Figure 8 Single-photon emission tomography combined with computed tomography showed no signs of metastasis.
- Citation: Pan D, Li TP, Xiong JH, Wang SB, Chen YX, Li JF, Xiao Q. Treatment with sorafenib plus camrelizumab after splenectomy for primary splenic angiosarcoma with liver metastasis: A case report and literature review. World J Clin Cases 2022; 10(9): 2818-2828
- URL: https://www.wjgnet.com/2307-8960/full/v10/i9/2818.htm
- DOI: https://dx.doi.org/10.12998/wjcc.v10.i9.2818


