Copyright
©The Author(s) 2022.
World J Clin Cases. Mar 6, 2022; 10(7): 2294-2300
Published online Mar 6, 2022. doi: 10.12998/wjcc.v10.i7.2294
Published online Mar 6, 2022. doi: 10.12998/wjcc.v10.i7.2294
Figure 1 Abdominal ultrasonography images.
Multiple cysts, including a giant cyst, can be observed in the liver. The non-uniform hyperechoic region is considered debris inside the cyst (orange circle).
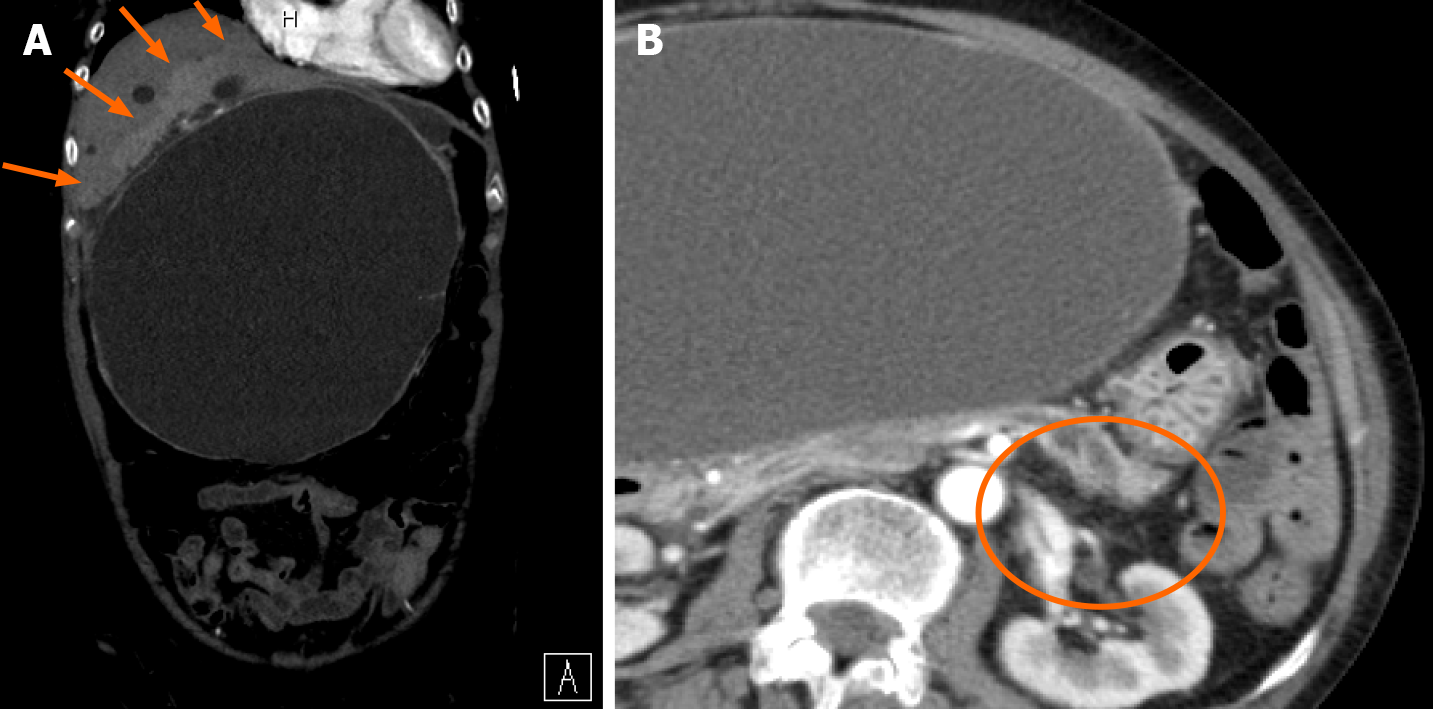
Figure 2 Abdominal dynamic computed tomography (arterial phase) on hospital day 1.
A: A contrast effect is observed in the liver parenchyma around the hepatic cyst (orange arrows). There is no ring enhancement indicating an abscess. The maximum cyst diameter is 203 mm; B: Slight dilation of the main pancreatic duct at the pancreatic tail (orange circle).
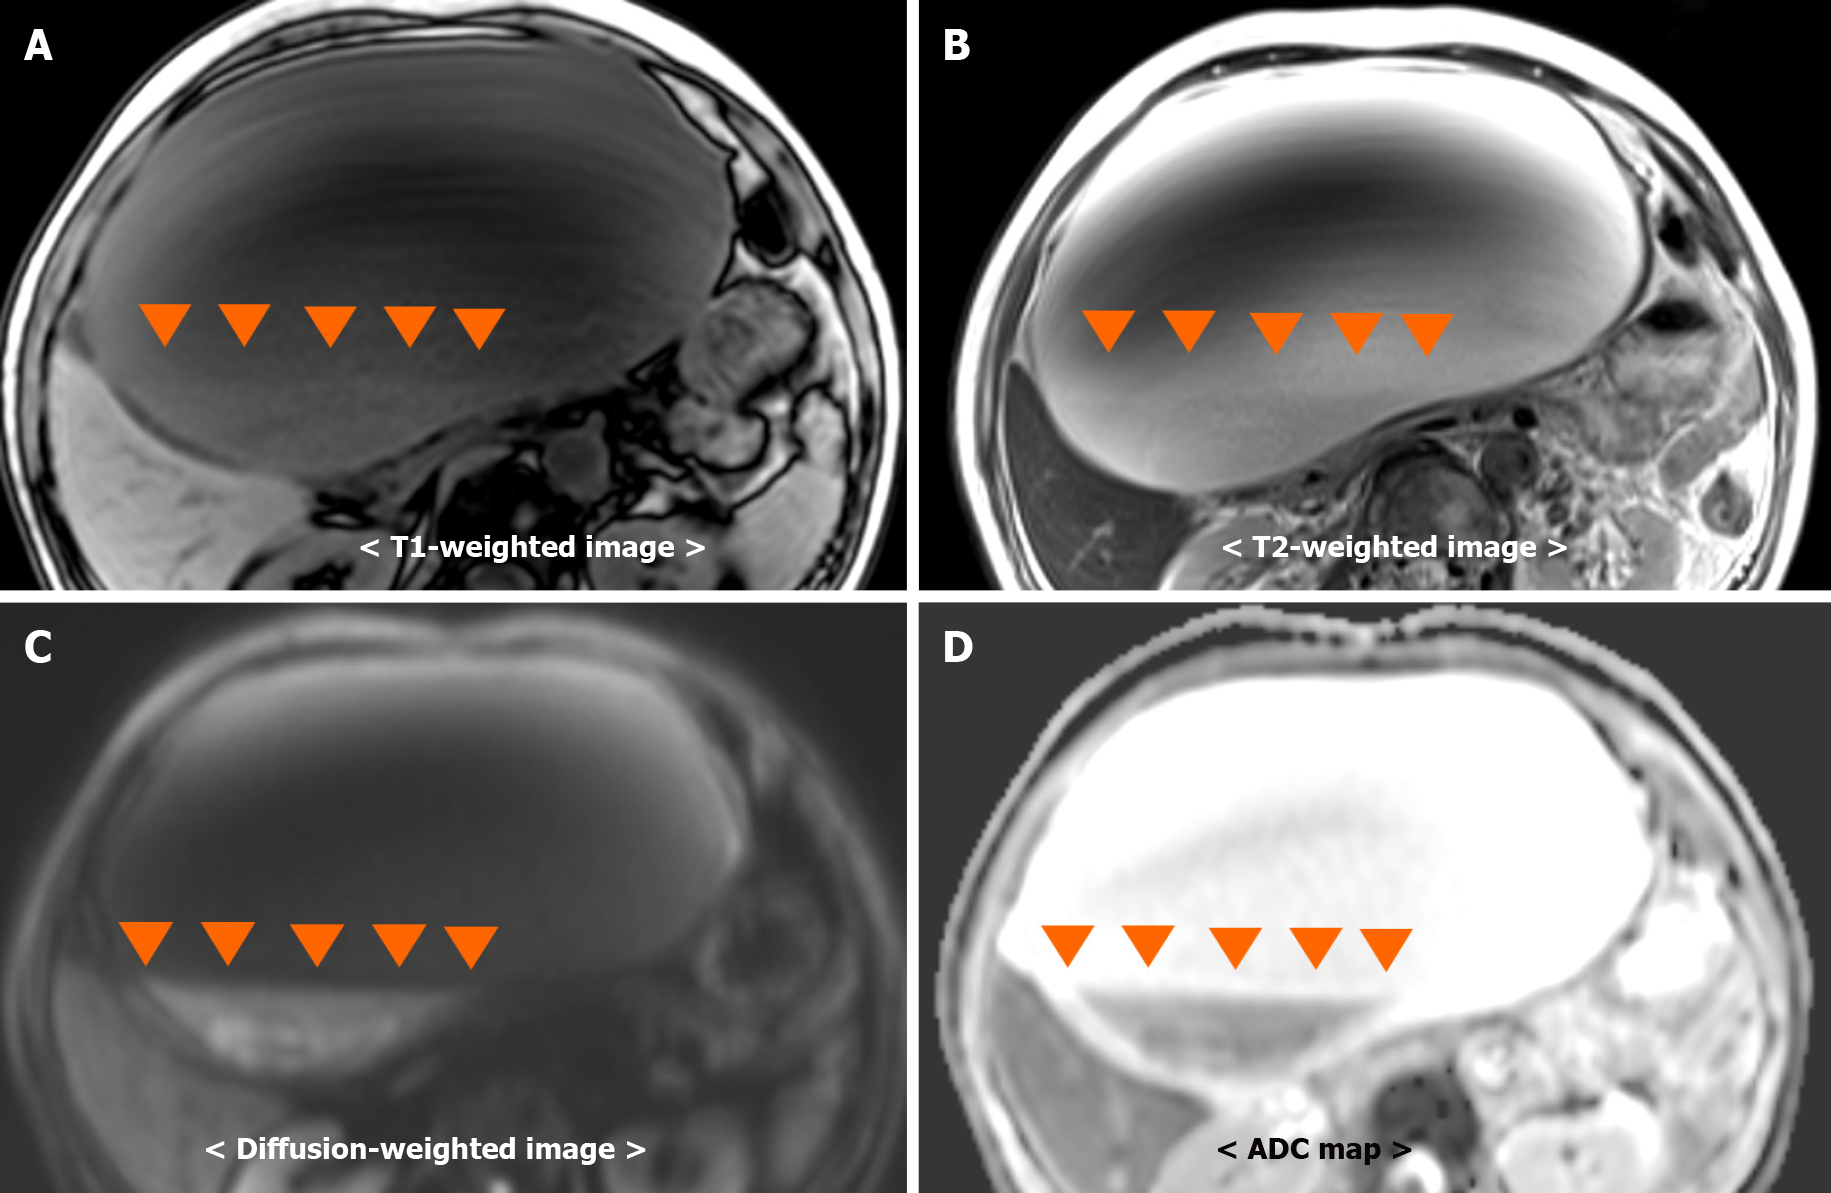
Figure 3 Simple abdominal magnetic resonance imaging.
Fluid-fluid levels (orange arrowheads) from debris in the hepatic cyst. Debris observed as, A: Hyperintensity on a T1-weighted image; B: Hyperintensity on a T2-weighted image; C: Hyperintensity on a diffusion-weighted image; D: Hypointensity on an ADC map.
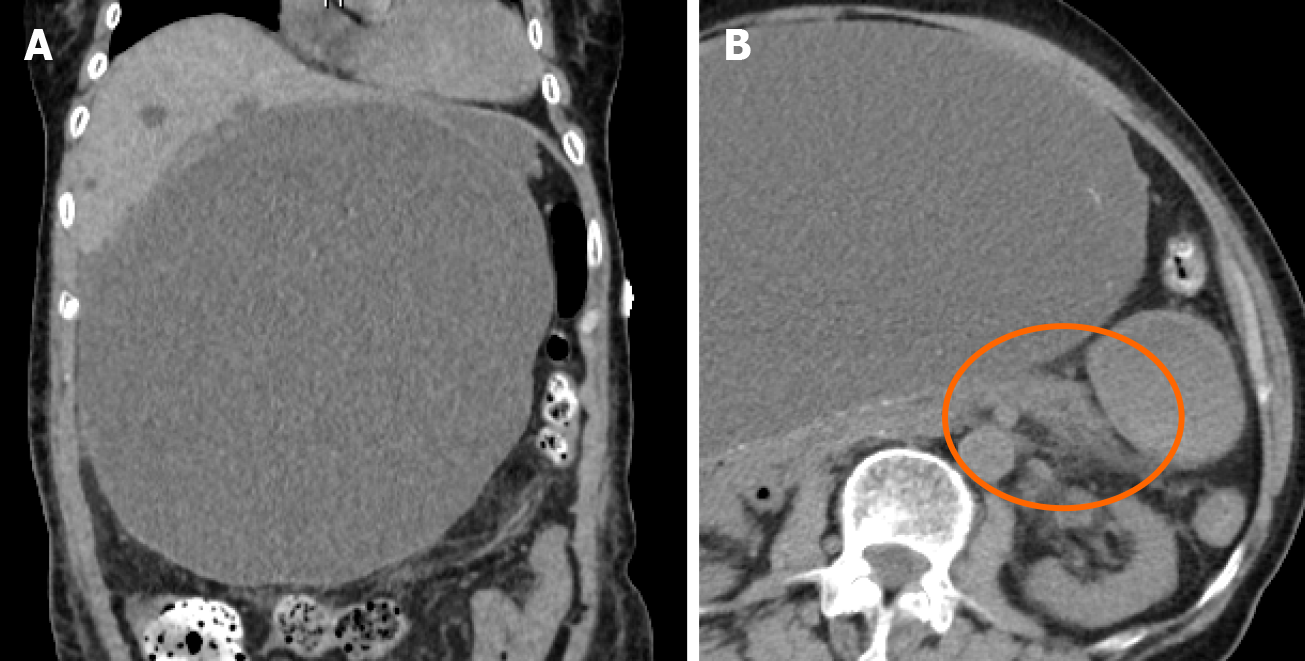
Figure 4 Simple abdominal computed tomography on hospital day 7.
A: Maximum diameter of the hepatic cyst: 219 mm; B: Slight pancreatic enlargement and increased adipose tissue density around the pancreas (orange circle).
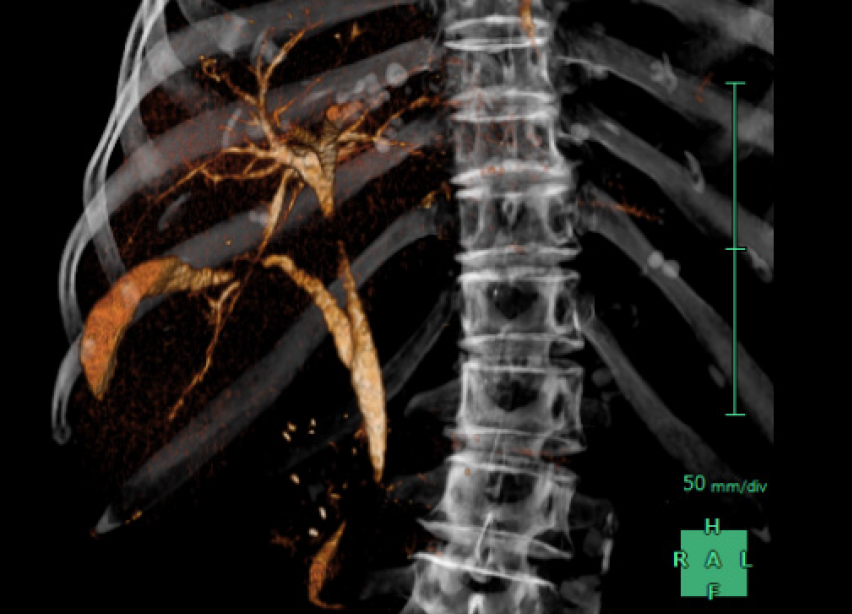
Figure 5 Three-dimensional drip infusion computed tomography cholangiography.
Drip infusion computed tomography cholangiography shows no organic abnormalities in the common bile duct.
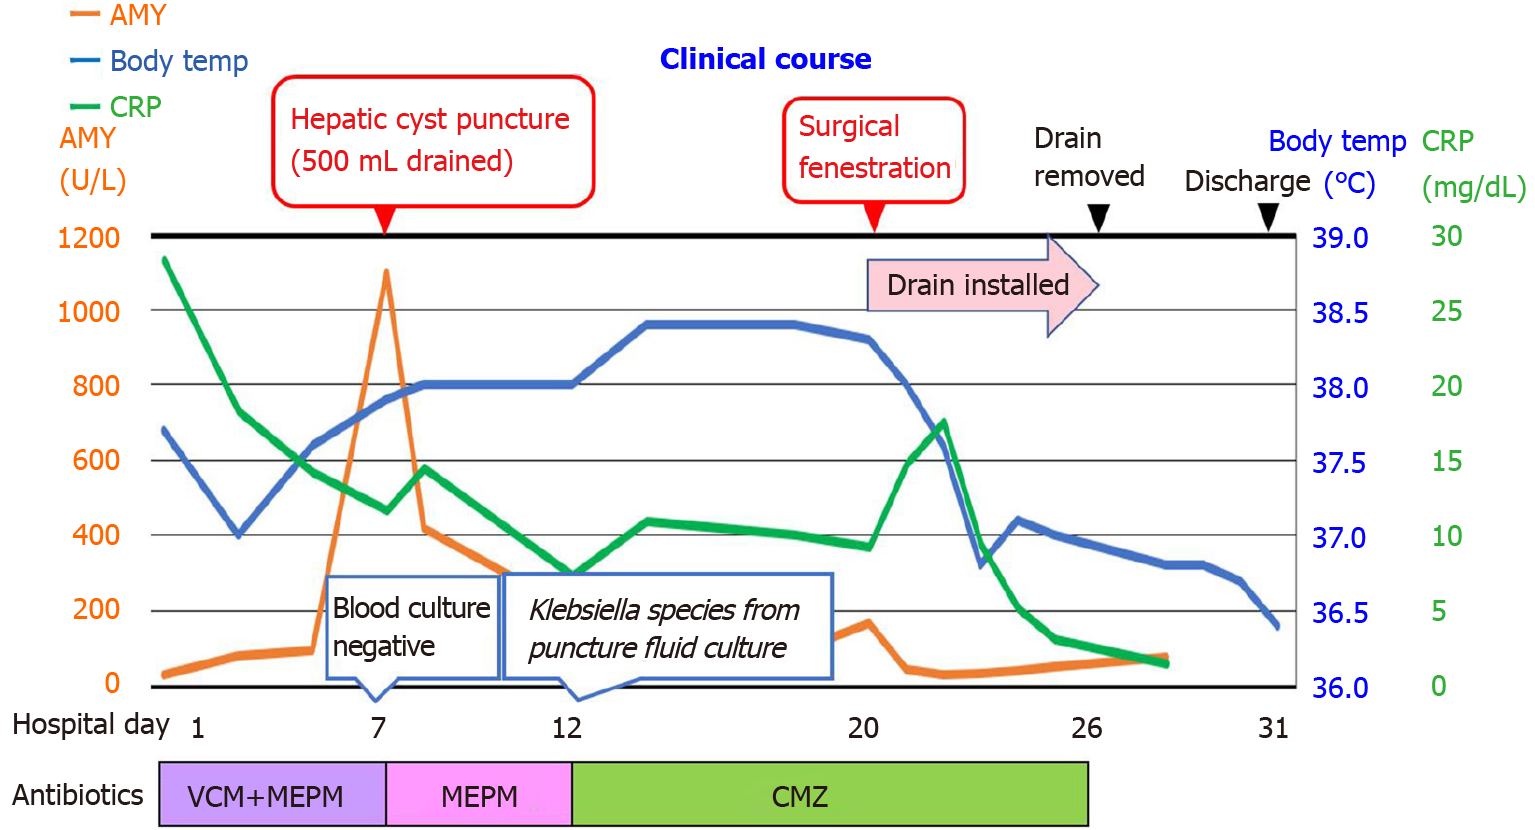
Figure 6 Post-admission course.
AMY: Amylase; CRP: C-reactive protein, VCM: vancomycin; MEPM: Meropenem; CMZ: Cefmetazole.
- Citation: Kenzaka T, Sato Y, Nishisaki H. Giant infected hepatic cyst causing exclusion pancreatitis: A case report. World J Clin Cases 2022; 10(7): 2294-2300
- URL: https://www.wjgnet.com/2307-8960/full/v10/i7/2294.htm
- DOI: https://dx.doi.org/10.12998/wjcc.v10.i7.2294


