Copyright
©The Author(s) 2022.
World J Clin Cases. Mar 6, 2022; 10(7): 2072-2086
Published online Mar 6, 2022. doi: 10.12998/wjcc.v10.i7.2072
Published online Mar 6, 2022. doi: 10.12998/wjcc.v10.i7.2072
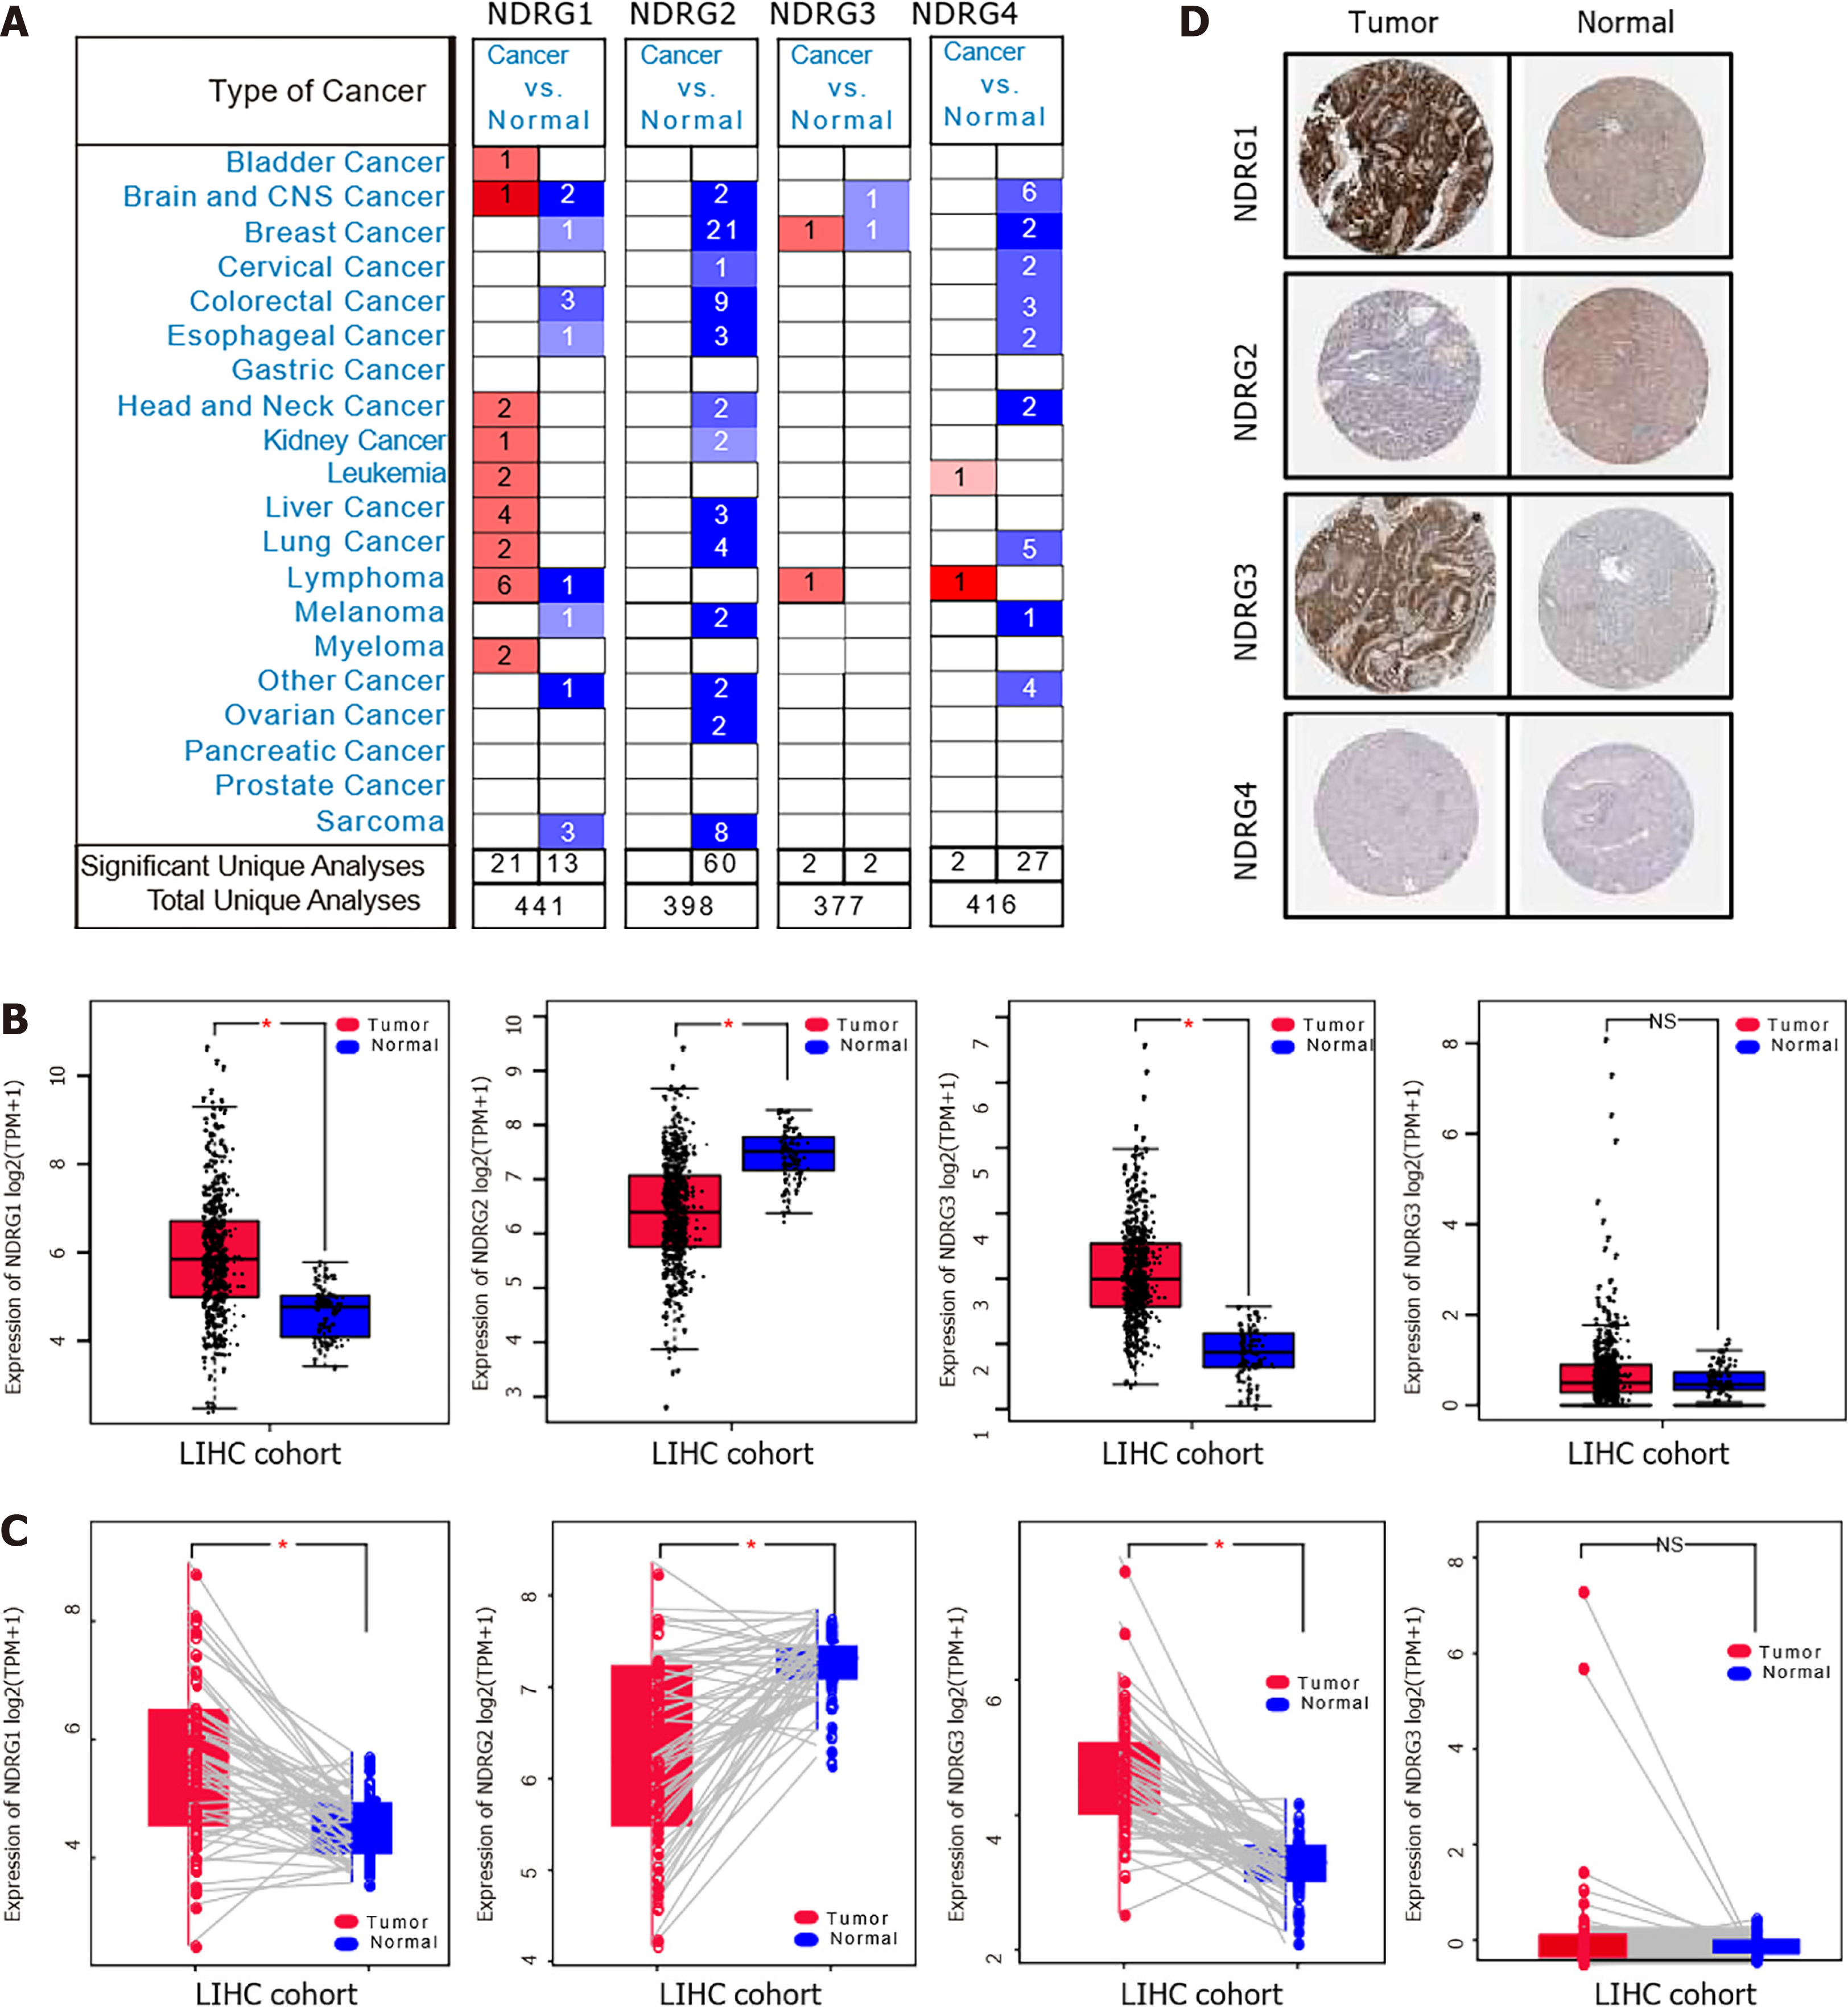
Figure 1 Expression of N-Myc downstream-regulated gene family genes in the Oncomine and The Cancer Genome Atlas databases.
A: messenger RNA (mRNA) expression of N-Myc downstream-regulated gene (NDRG)1, NDRG2, NDRG3, and NDRG4 among various types of cancer using the Oncomine databases. The number in the cells indicate the number of datasets with statistically significant up-expression (red) or down-expression (blue) (cancer vs corresponding normal tissue); B: mRNA expression of NDRG1, NDRG2, NDRG3, and NDRG4 in tumor and normal samples in The Cancer Genome Atlas-liver hepatocellular carcinoma (LIHC) cohort; C: The paired mRNA expression of NDRG1, NDRG2, NDRG3, and NDRG4 between tumor and normal samples in The Cancer Genome Atlas-liver hepatocellular carcinoma cohort; D: The representative protein expression of NDRG members in hepatocellular carcinoma and normal liver tissue from the Human Protein Atlas.
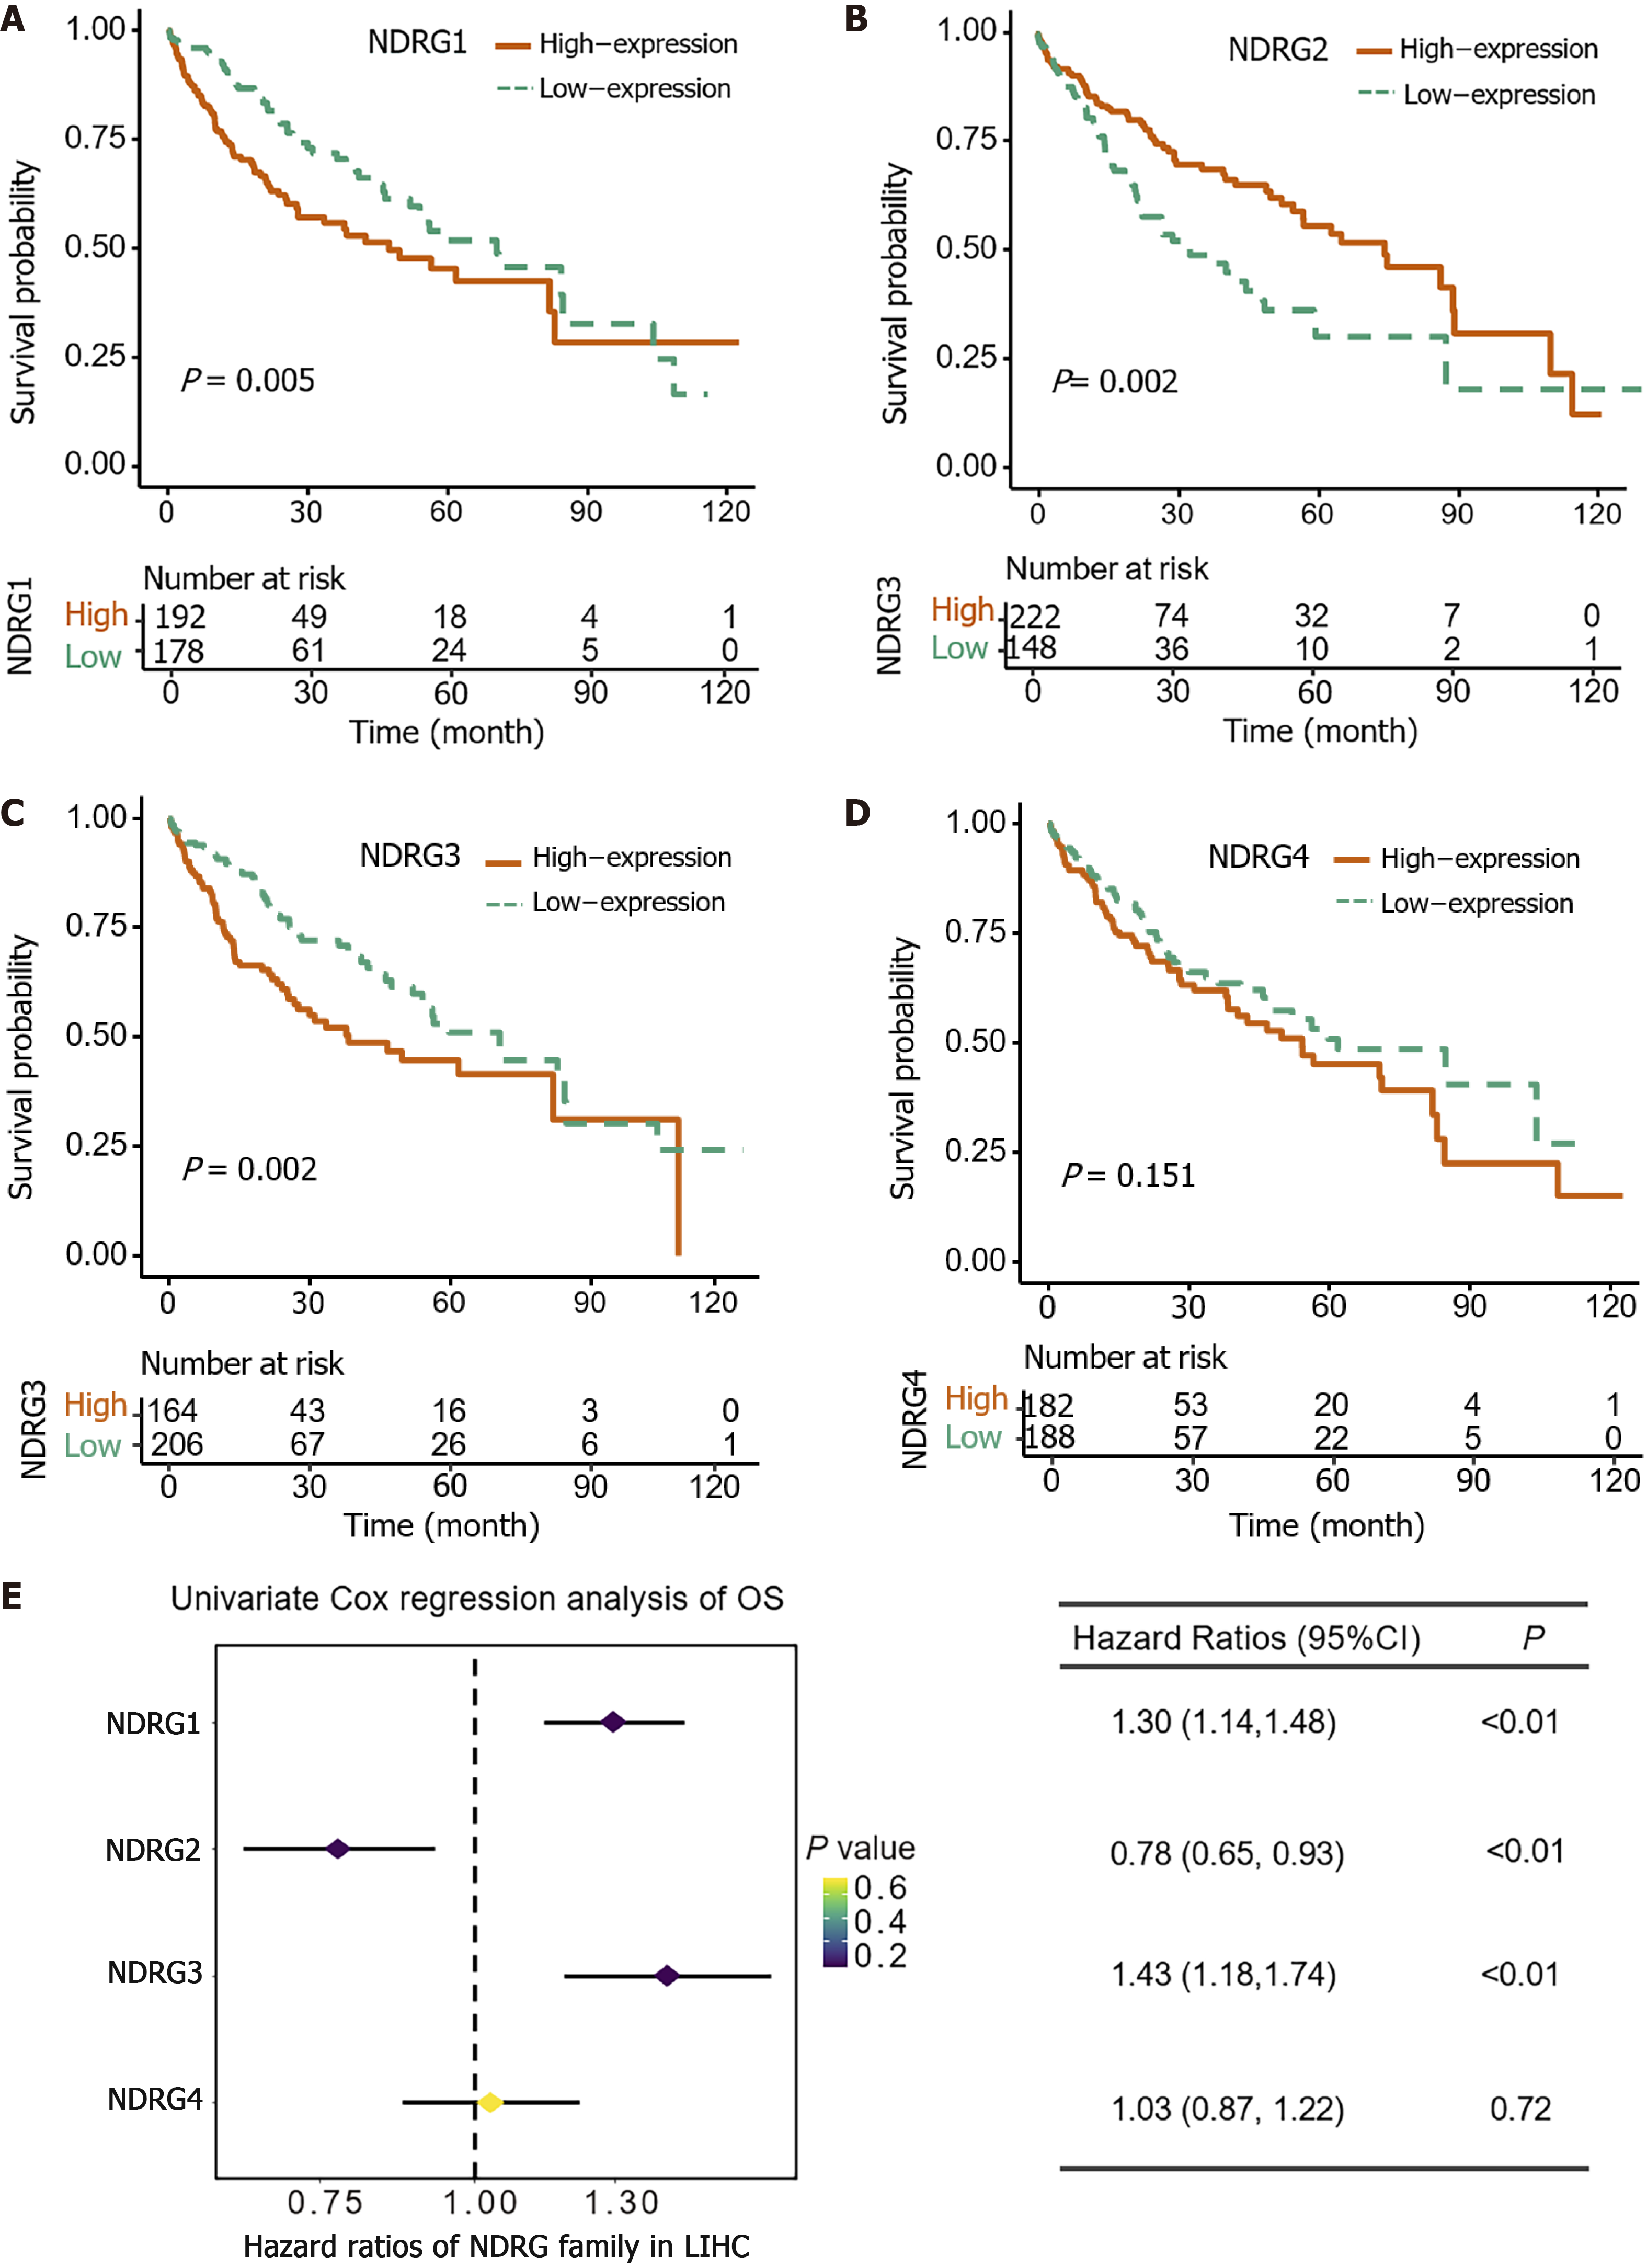
Figure 2 The prognostic value of N-Myc downstream-regulated gene family genes in The Cancer Genome Atlas cohort.
A: Kaplan–Meier overall survival (OS) curves for patients with high vs low N-Myc downstream-regulated gene (NDRG)1 expressionl B: Kaplan–Meier OS curves for patients with high vs low NDRG2 expression; C: Kaplan–Meier OS curves for patients with high vs low NDRG3 expression; D: Kaplan–Meier overall survival OS curves for patients with high vs low NDRG4 expression; E: Univariate Cox regression analyses and forest plots for NDRG family genes in The Cancer Genome Atlas cohort.
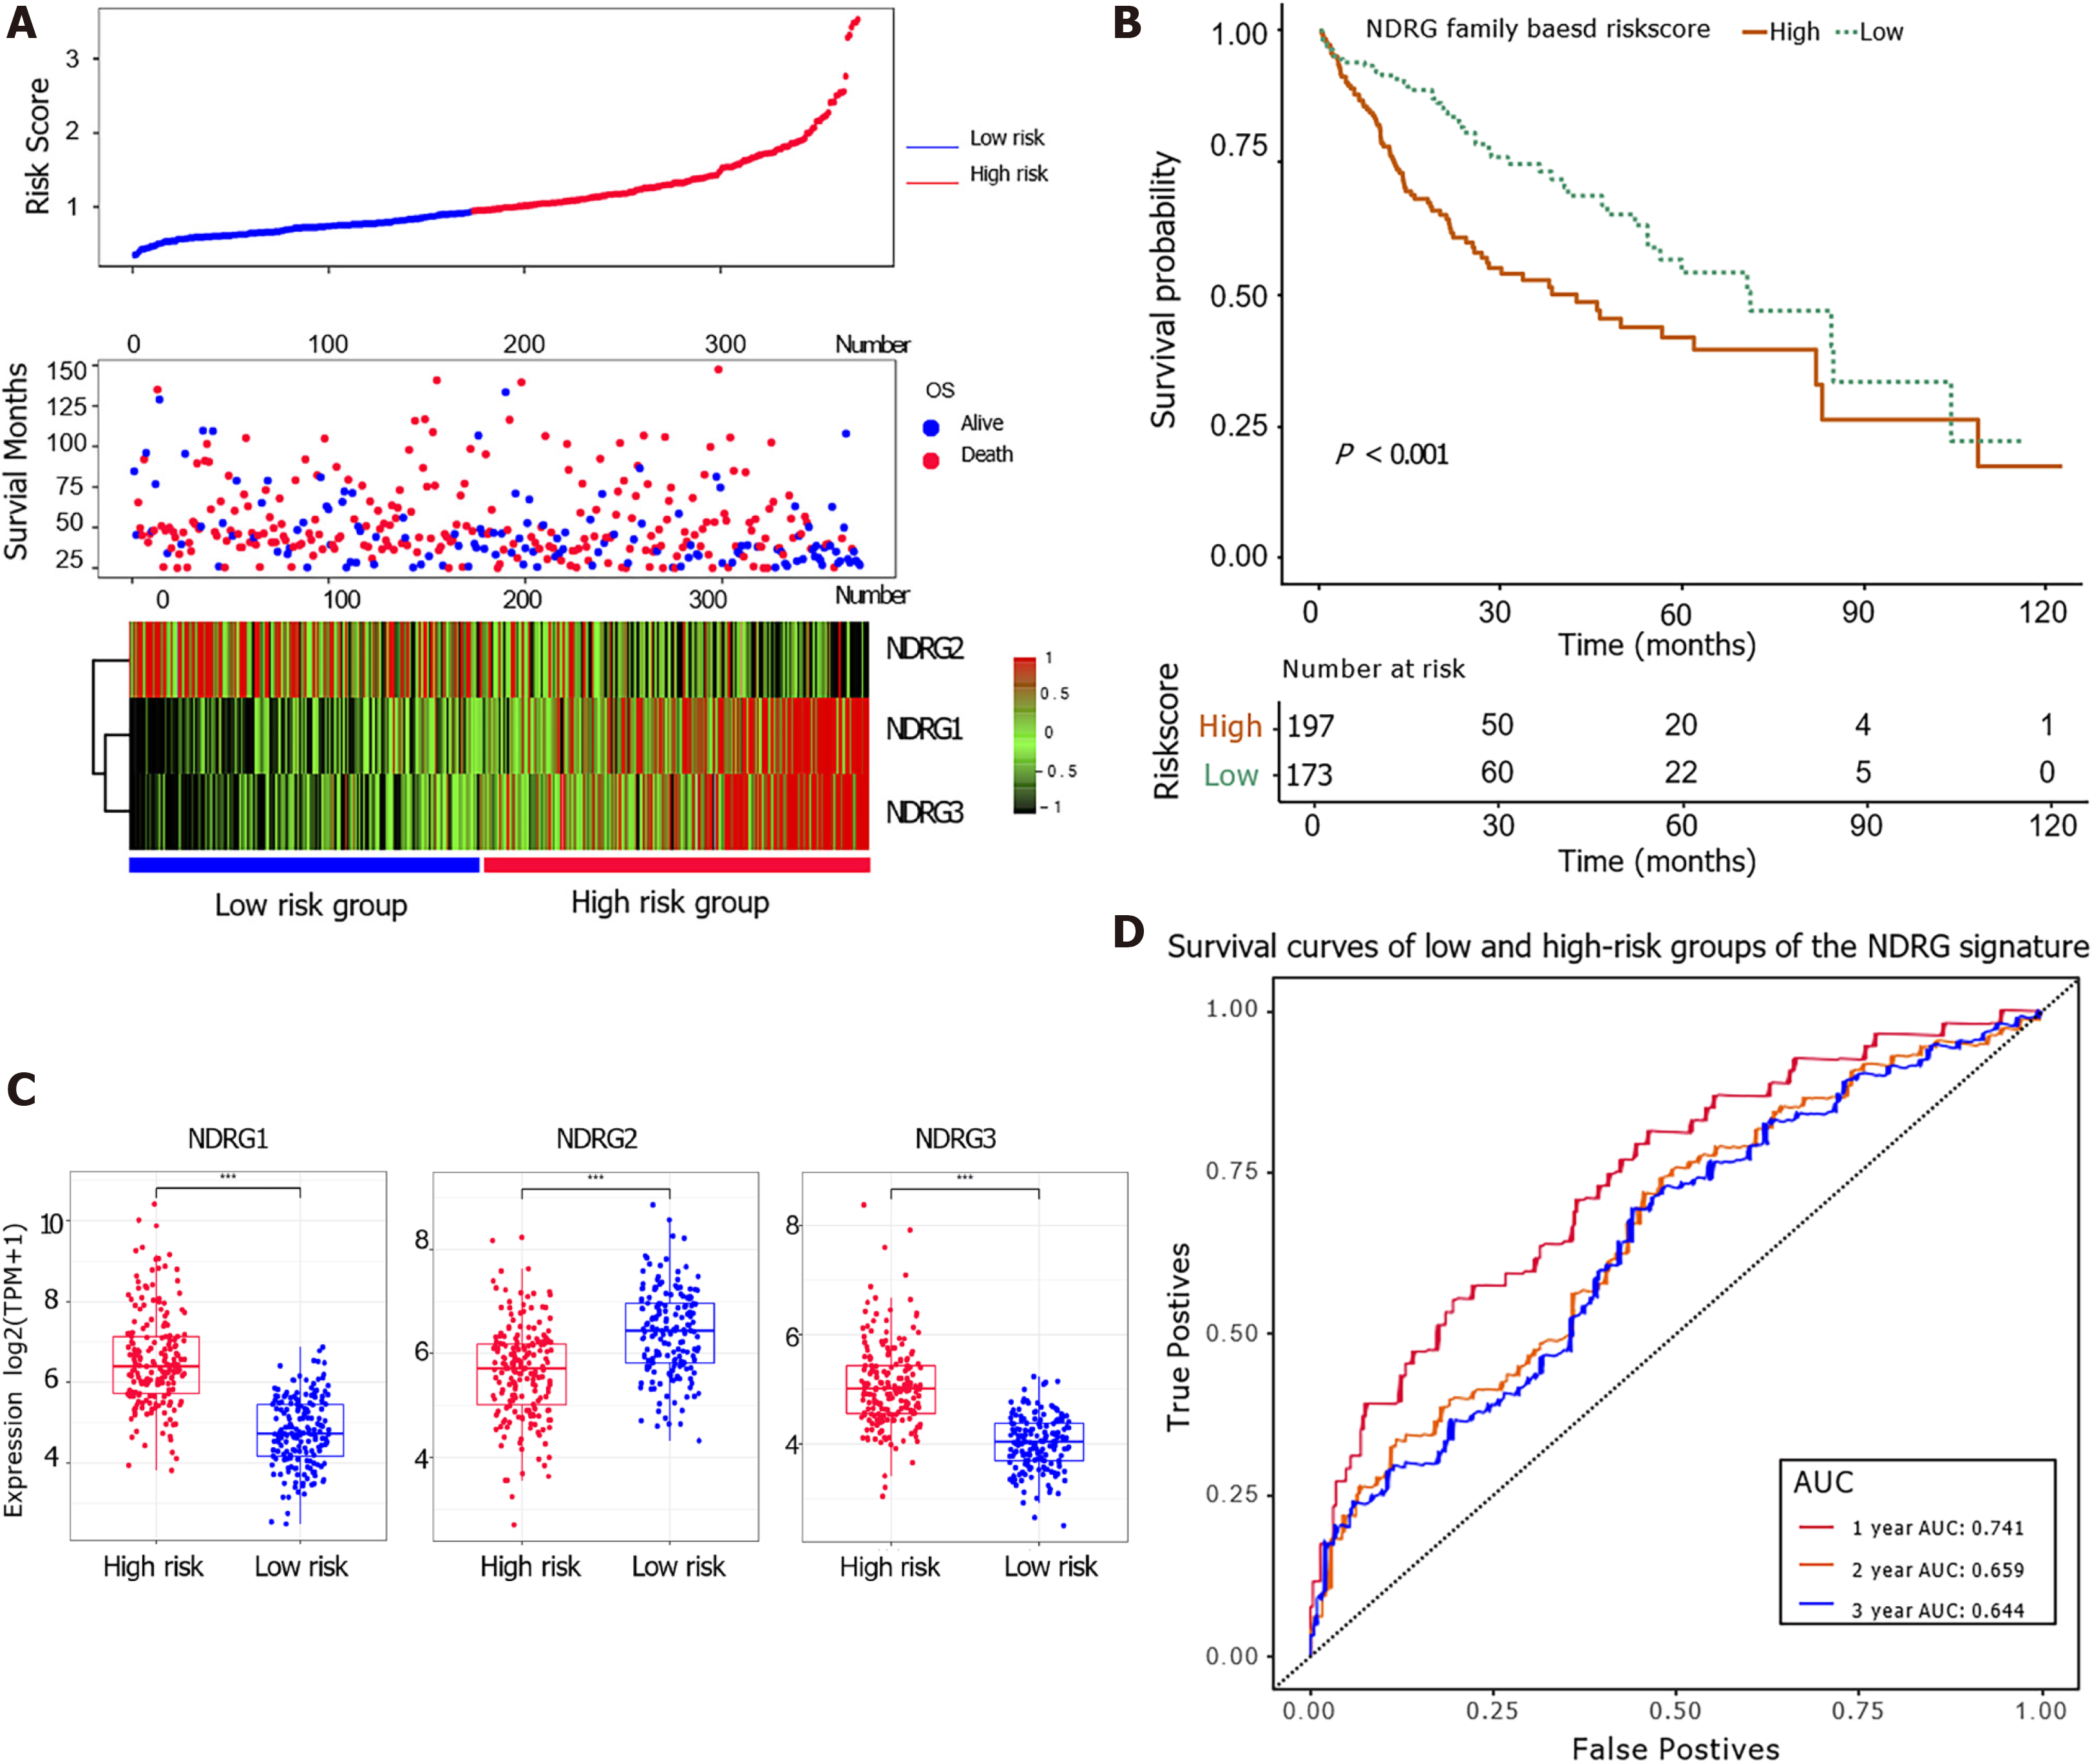
Figure 3 The prognostic values of the N-Myc downstream-regulated gene family genes-based signature in The Cancer Genome Atlas cohort.
A: Distribution of risk scores (top); survival status (middle); gene expression of N-Myc downstream-regulated gene (NDRG)1-3 between low- and high-risk groups (bottom) in The Cancer Genome Atlas cohort; B: Kaplan–Meier overall survival analysis of low and high-risk groups; C: Comparison of gene expression between low and high-risk groups for NDRG1, NDRG2, and NDRG3; D: Receiver operating characteristic curve analysis of the association between NDRG-based signature and 1-, 2-, and 3-year overall survival probability.
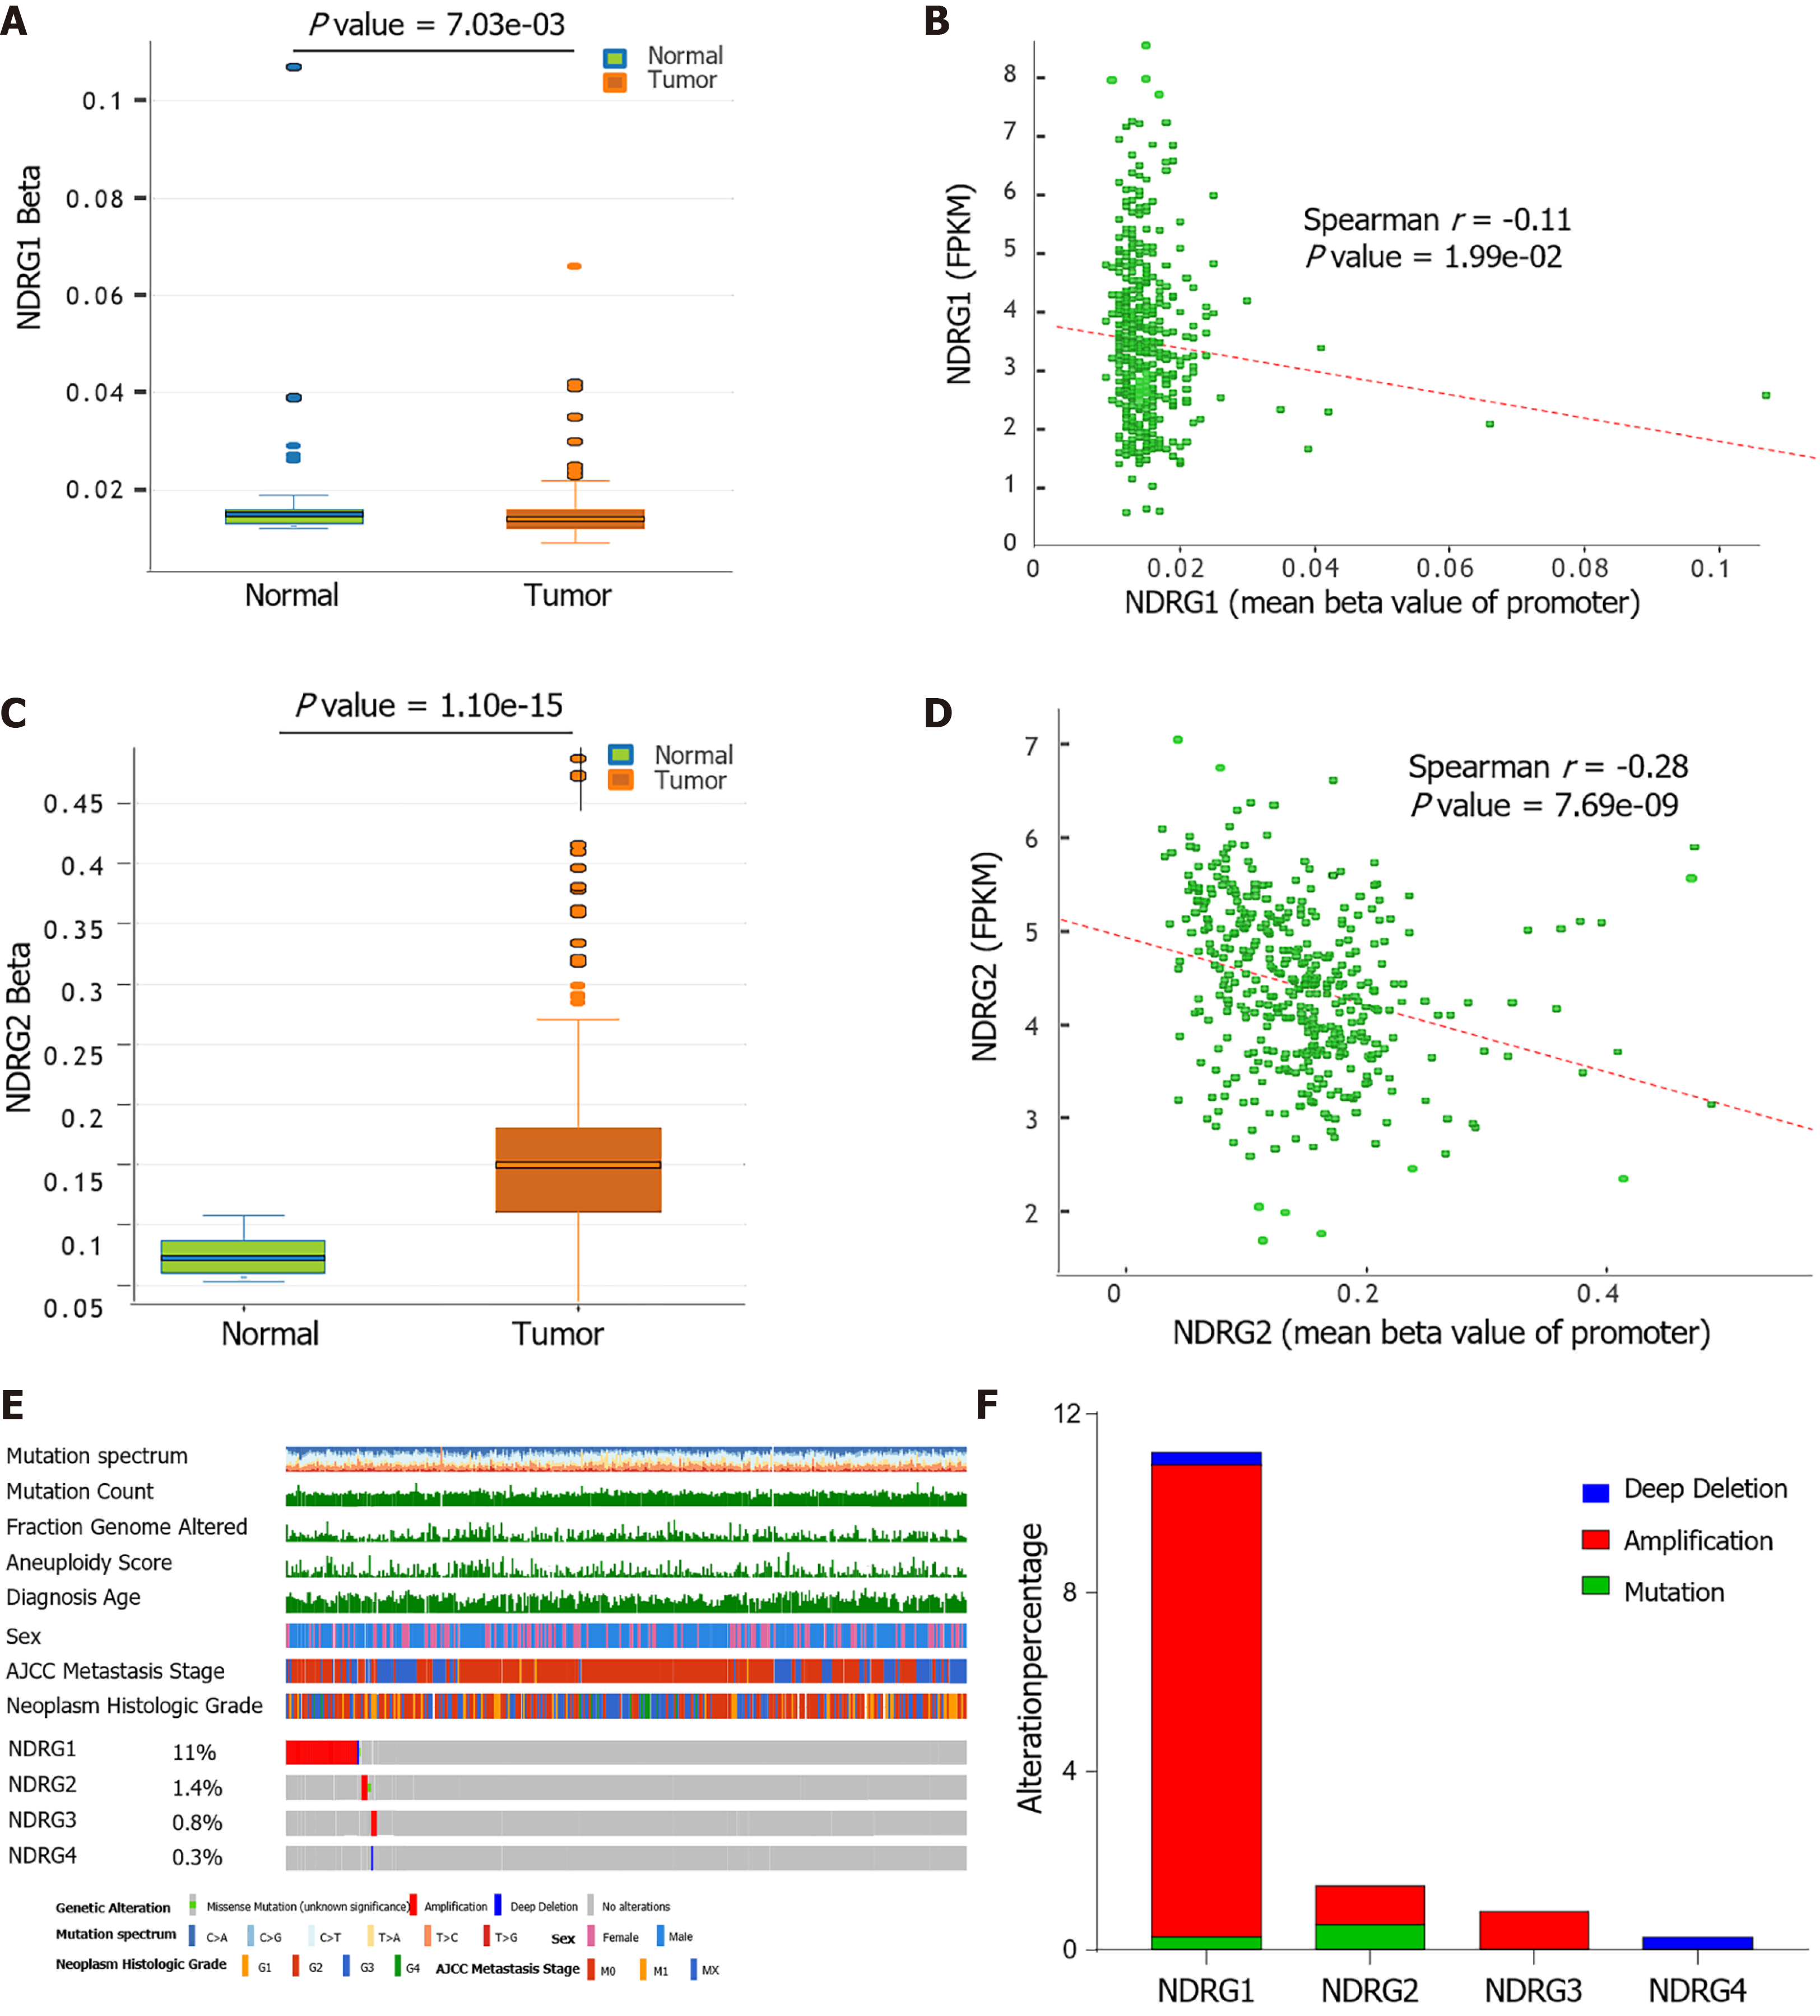
Figure 4 DNA methylation and mutation profile of N-Myc downstream-regulated gene family genes in The Cancer Genome Atlas cohort.
A: DNA methylation of N-Myc downstream-regulated gene (NDRG)1 between tumor and normal tissues; B: Correlation between methylation levels of promoter and expression of NDRG1; C: DNA methylation of NDRG2 between tumor and normal tissues; D: Correlation between methylation levels of promoter and expression of NDRG2; E: The genomic mutations of NDRG1, NDRG2, NDRG3, and NDRG4 in The Cancer Genome Atlas-liver hepatocellular carcinoma cohort are shown from top to bottom; F: Distribution of different genetic alterations of NDRG1, NDRG2, NDRG3, and NDRG4 in The Cancer Genome Atlas-liver hepatocellular carcinoma cohort.
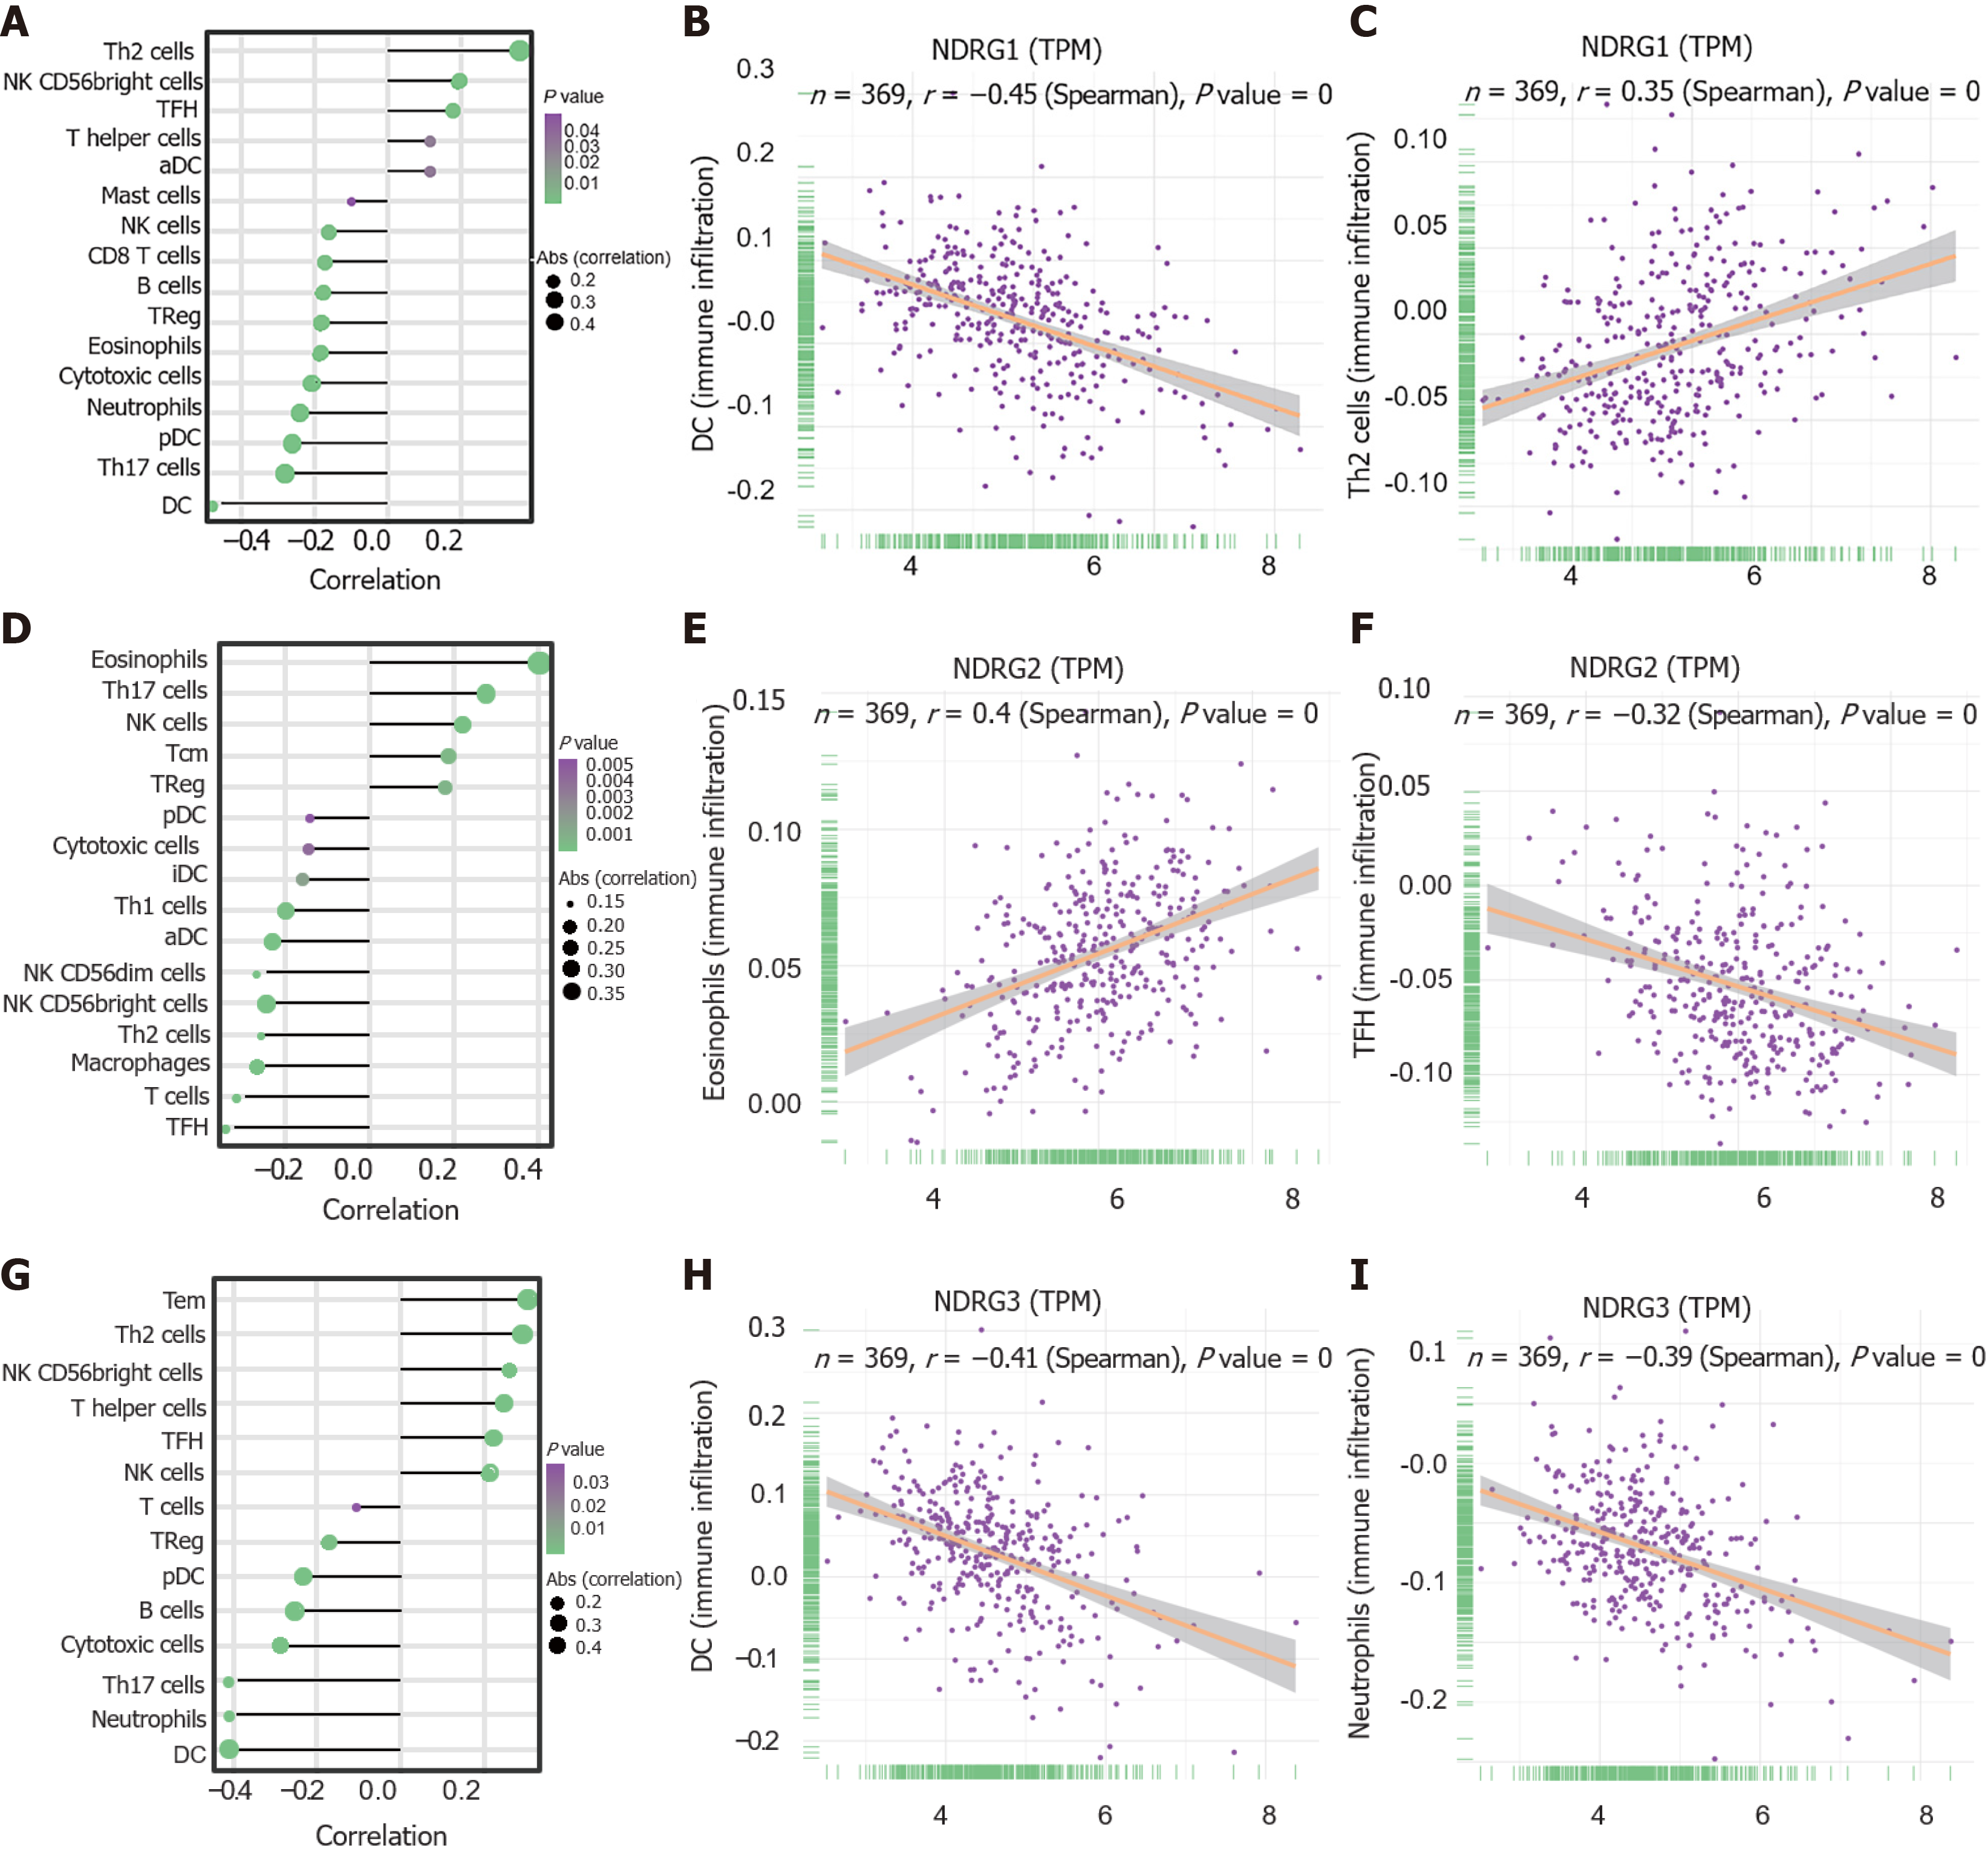
Figure 5 The relationship between expressions of N-Myc downstream-regulated gene family genes and tumor microenvironment.
A: Tumor-infiltrating immune cell types are ordered by the correlations of N-Myc downstream-regulated gene (NDRG1) expression; B: The correlation between infiltration of dendritic cells and NDRG1 expression; C: The correlation between infiltration of T helper (Th) 2 cells and NDRG1 expression; D: Tumor-infiltrating immune cell types are ordered by the correlations of NDRG2 expression; E: The correlation between infiltration of eosinophils cells and NDRG2 expression; F: The correlation between infiltration of T follicular helper (TFH) cells and NDRG2 expression; G: Tumor-infiltrating immune cell types are ordered by the correlations of NDRG3 expression; H: The correlation between infiltration of dendritic cells and NDRG3 expression; I: The correlation between infiltration of neutrophil cells and NDRG3 expression. NK: Natural killer.
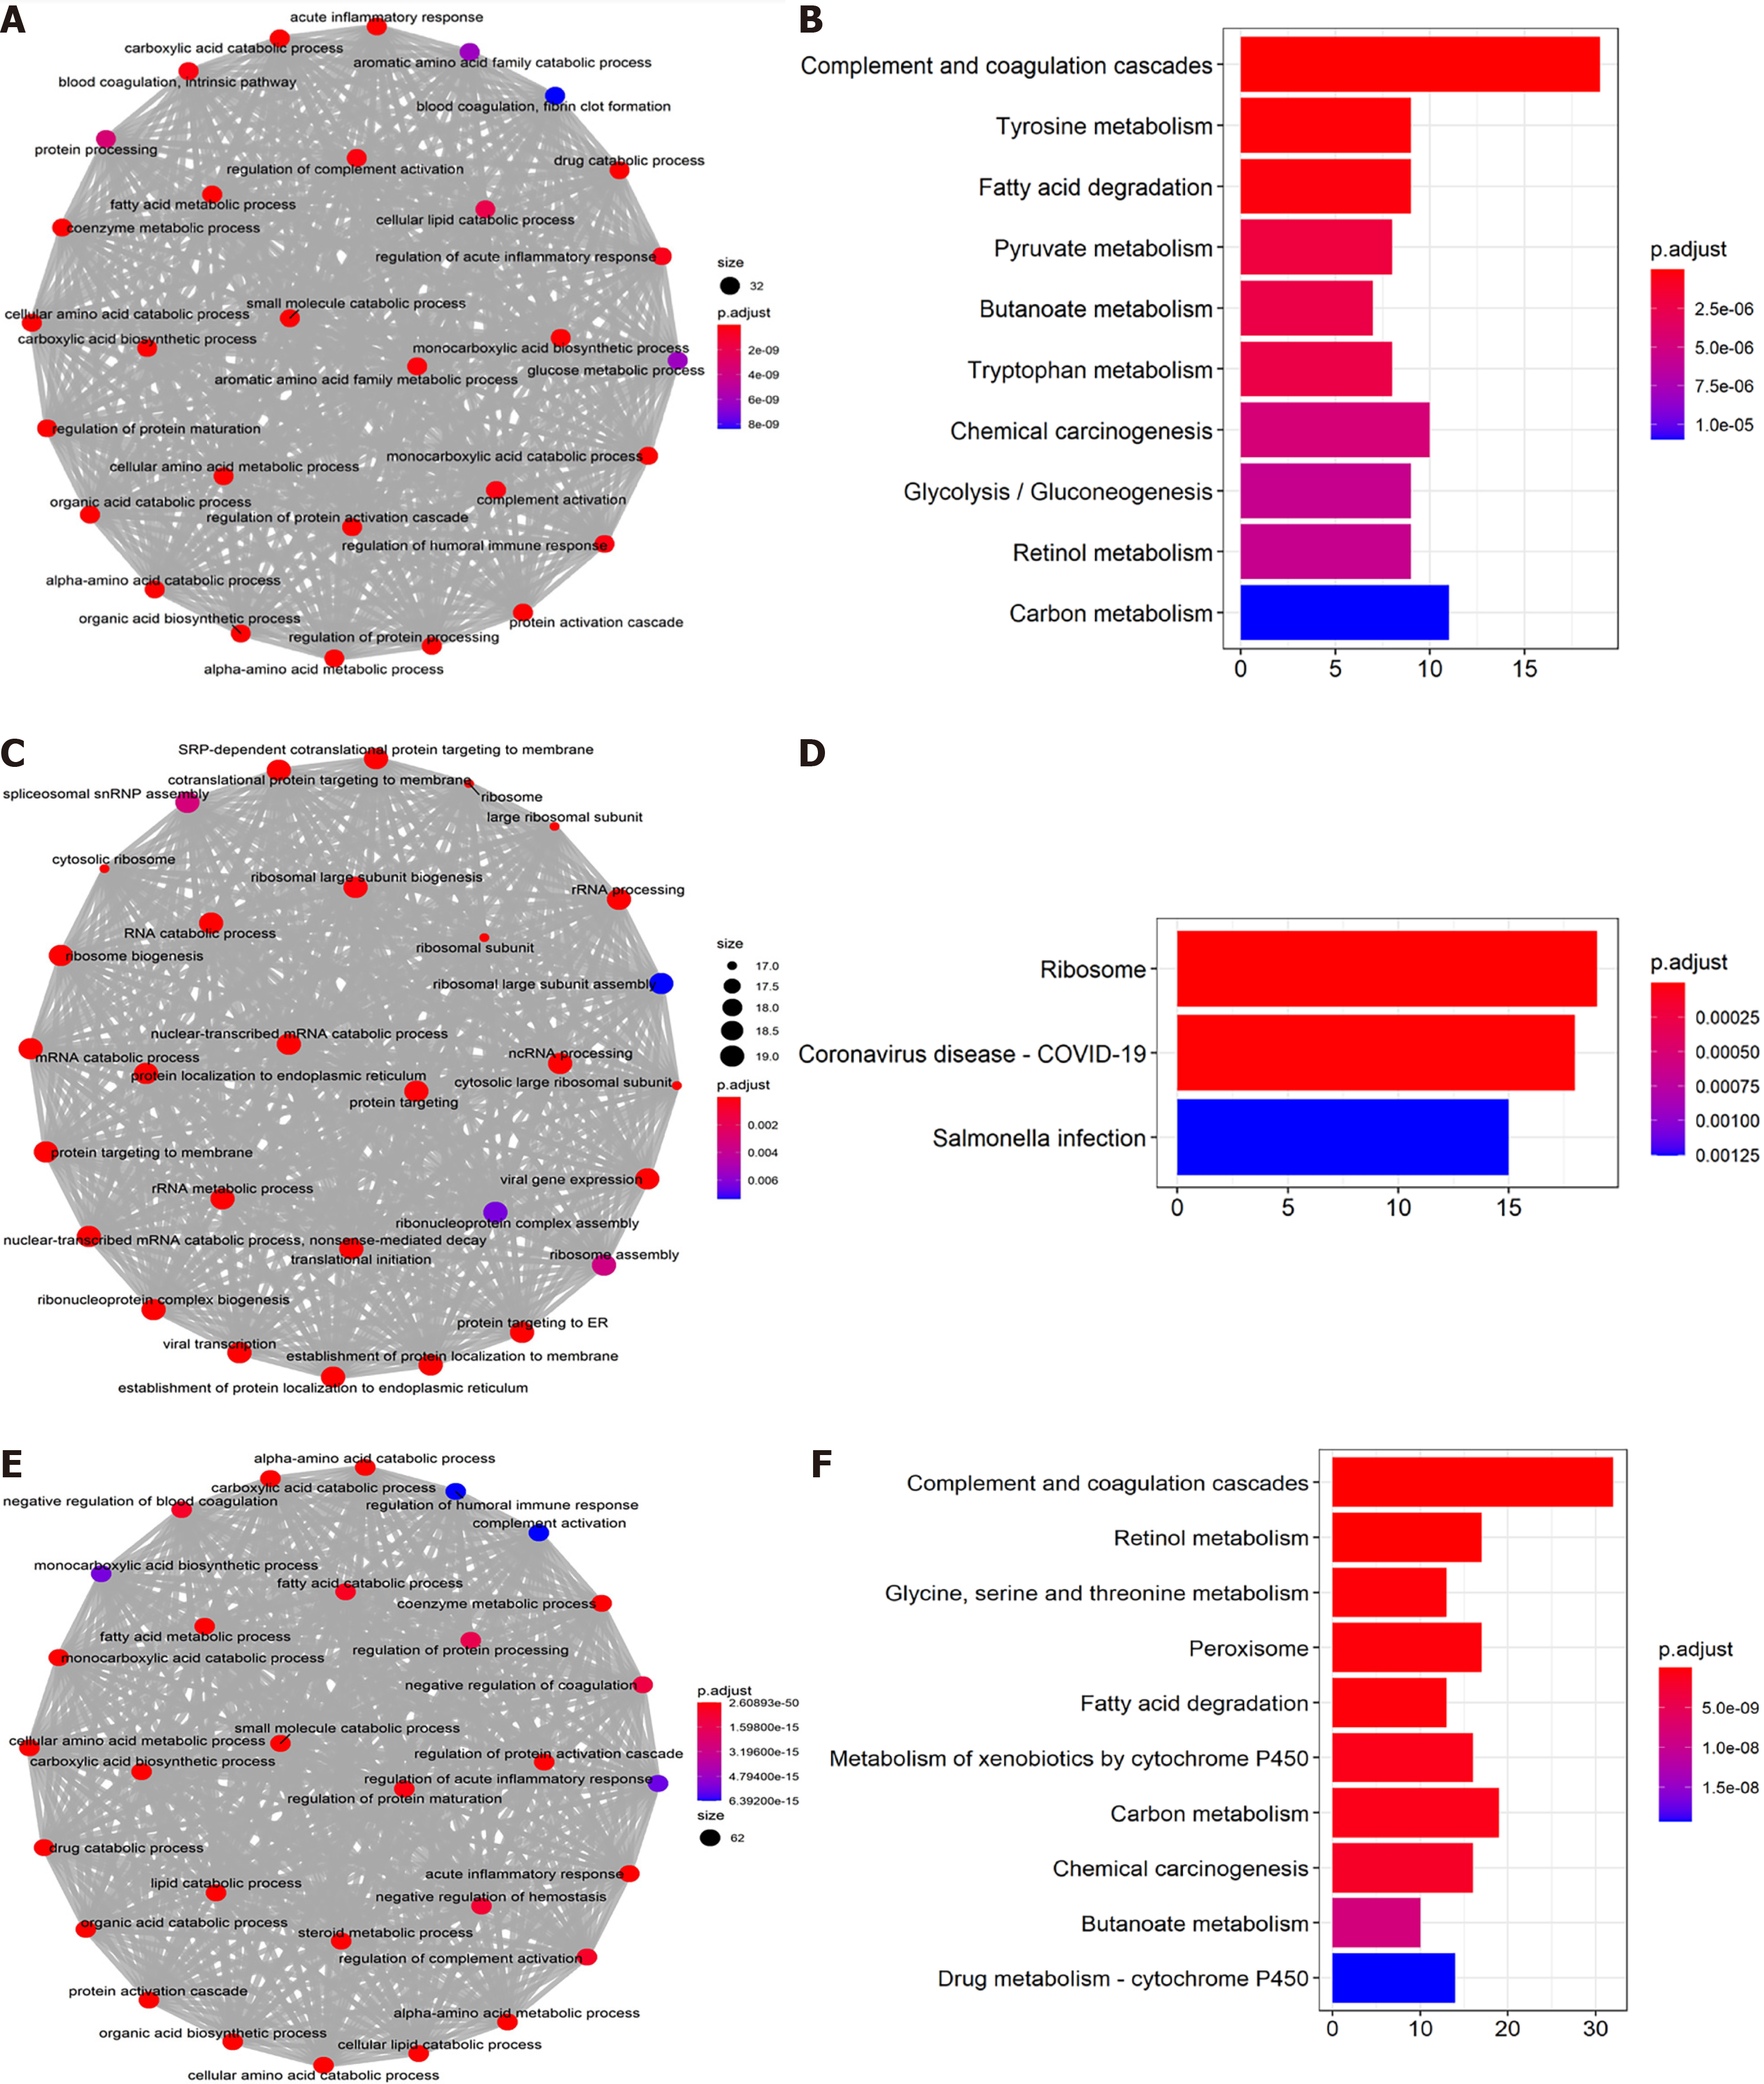
Figure 6 Gene Ontology and Kyoto Encyclopedia of Genes and Genomes enrichment analysis for co-expressed genes associated with expression of N-Myc downstream-regulated gene 1–3.
A: and B: Gene Ontology (GO) enrichment (A) and Kyoto Encyclopedia of Genes and Genomes (KEGG) pathway analysis (B) for co-expressed genes with N-Myc downstream-regulated gene (NDRG)1 expression; C and D: GO enrichment (C) and KEGG pathway analysis (D) for co-expressed genes with NDRG2 expression; E and F: GO enrichment (E) and KEGG pathway analysis (F) for co-expressed genes with NDRG3 expression.
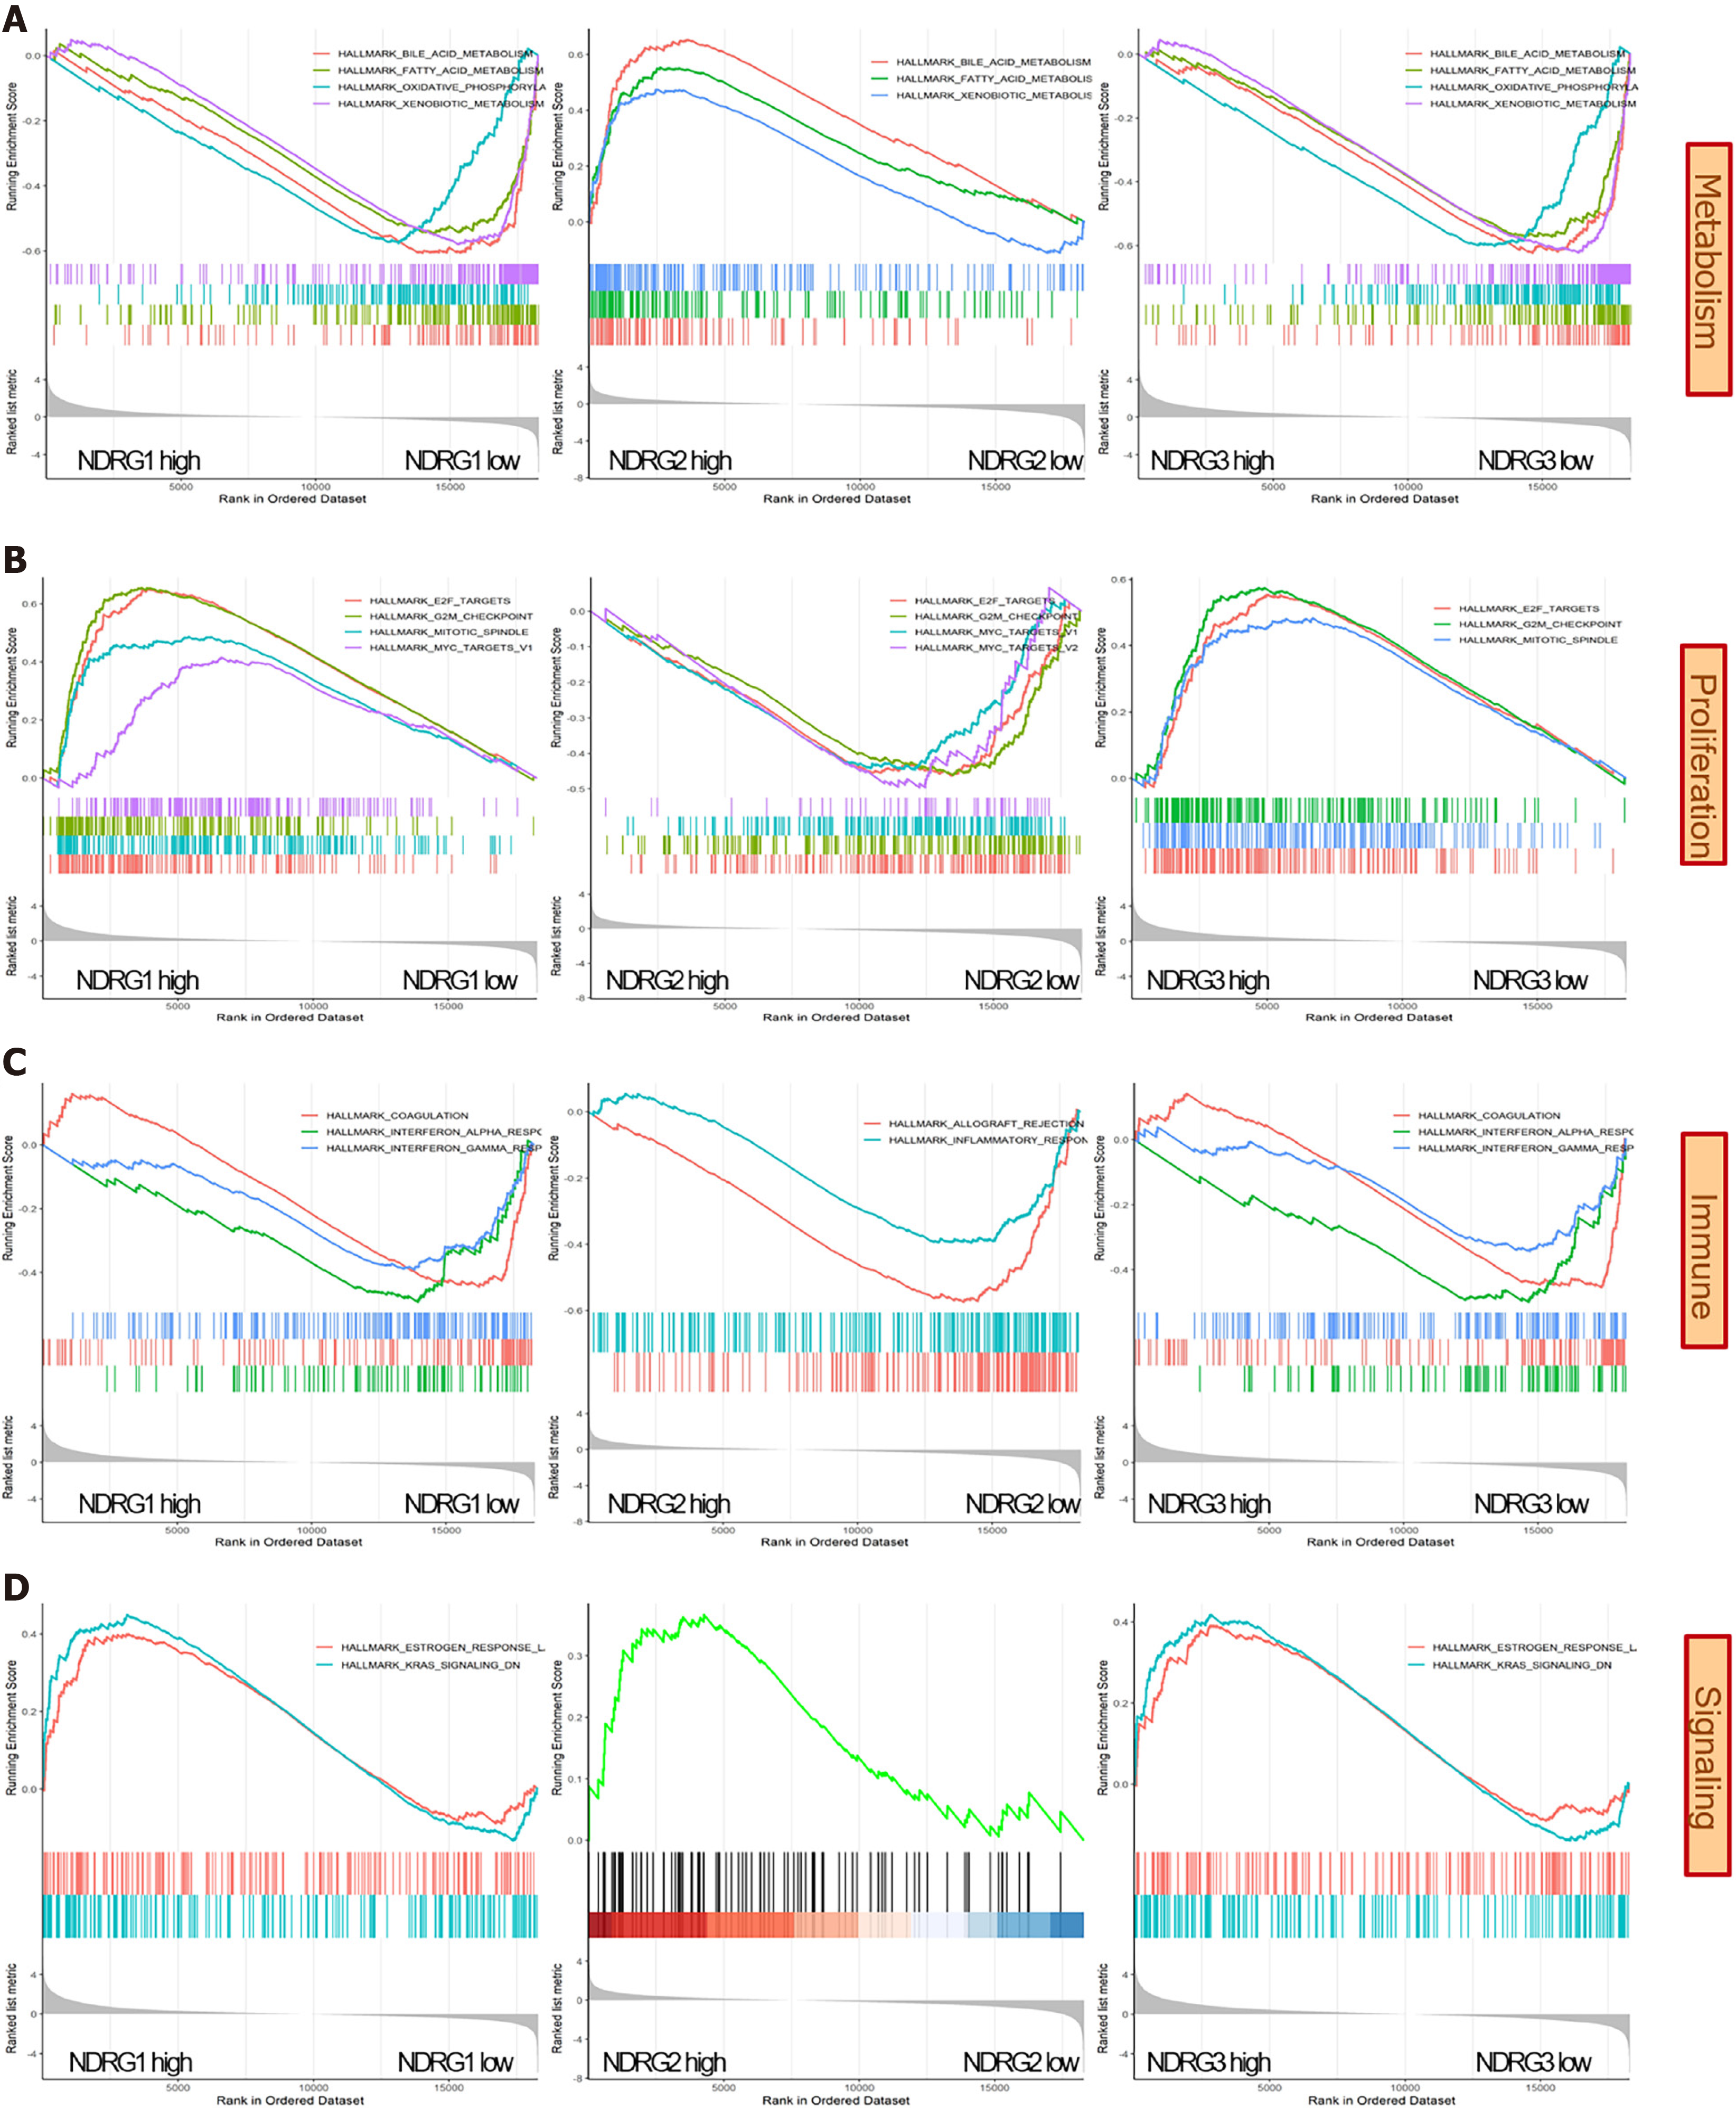
Figure 7 Gene set enrichment analysis results of high vs low expression of N-Myc downstream-regulated gene 1-3.
A: Metabolism related pathways were enriched in NDRG1-3; B: Proliferation related pathways were enriched in N-Myc downstream-regulated gene (NDRG)1-3; C: Immune related pathways were enriched in NDRG1-3; D: Signaling related pathways were enriched in NDRG1-3.
- Citation: Yin X, Yu H, He XK, Yan SX. Prognostic and biological role of the N-Myc downstream-regulated gene family in hepatocellular carcinoma. World J Clin Cases 2022; 10(7): 2072-2086
- URL: https://www.wjgnet.com/2307-8960/full/v10/i7/2072.htm
- DOI: https://dx.doi.org/10.12998/wjcc.v10.i7.2072


