Copyright
©The Author(s) 2022.
World J Clin Cases. Feb 26, 2022; 10(6): 1869-1875
Published online Feb 26, 2022. doi: 10.12998/wjcc.v10.i6.1869
Published online Feb 26, 2022. doi: 10.12998/wjcc.v10.i6.1869
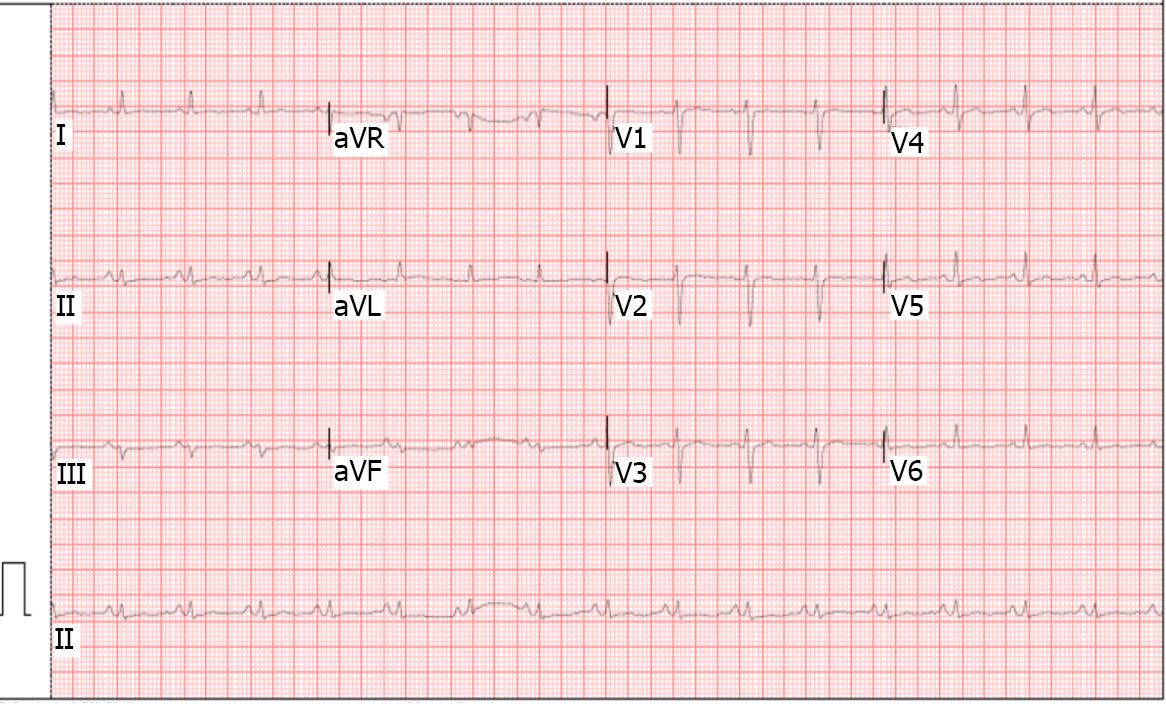
Figure 1 Low-voltage electrocardiogram (defined as QRS < 5 mm in limb shunts).
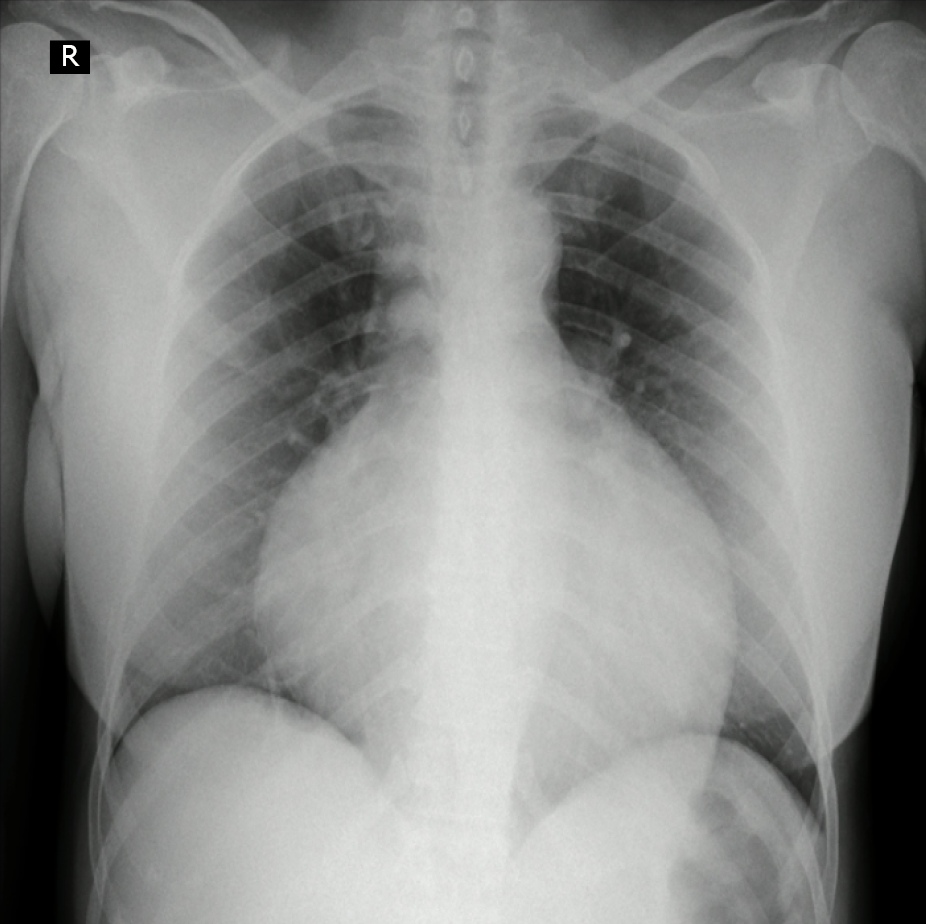
Figure 2 Chest X-ray.
Global cardiomegaly with enlarging cardiothoracic ratio and "water bottle” configuration.
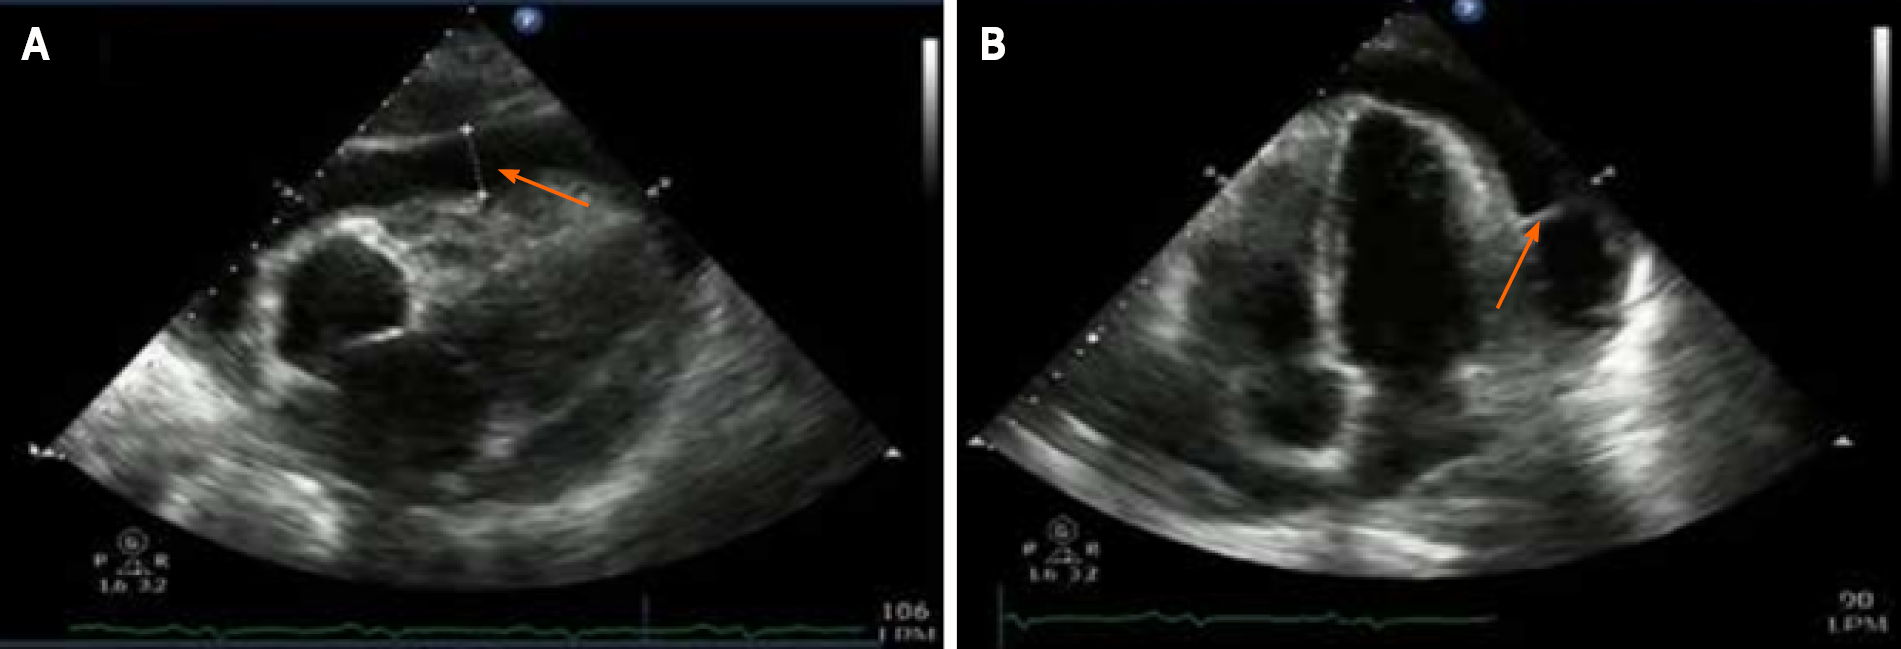
Figure 3 2D echocardiography.
A: Echo-free space, or anechoic zone, between both layers of the pericardium of 27 mm (arrow) corresponding to pericardial effusion. The left ventricular ejection fraction was 60%, without segmental contractility disorders; B: Isoechoic image (arrow) at the level of the pericardial fluid that corresponds to a septum.
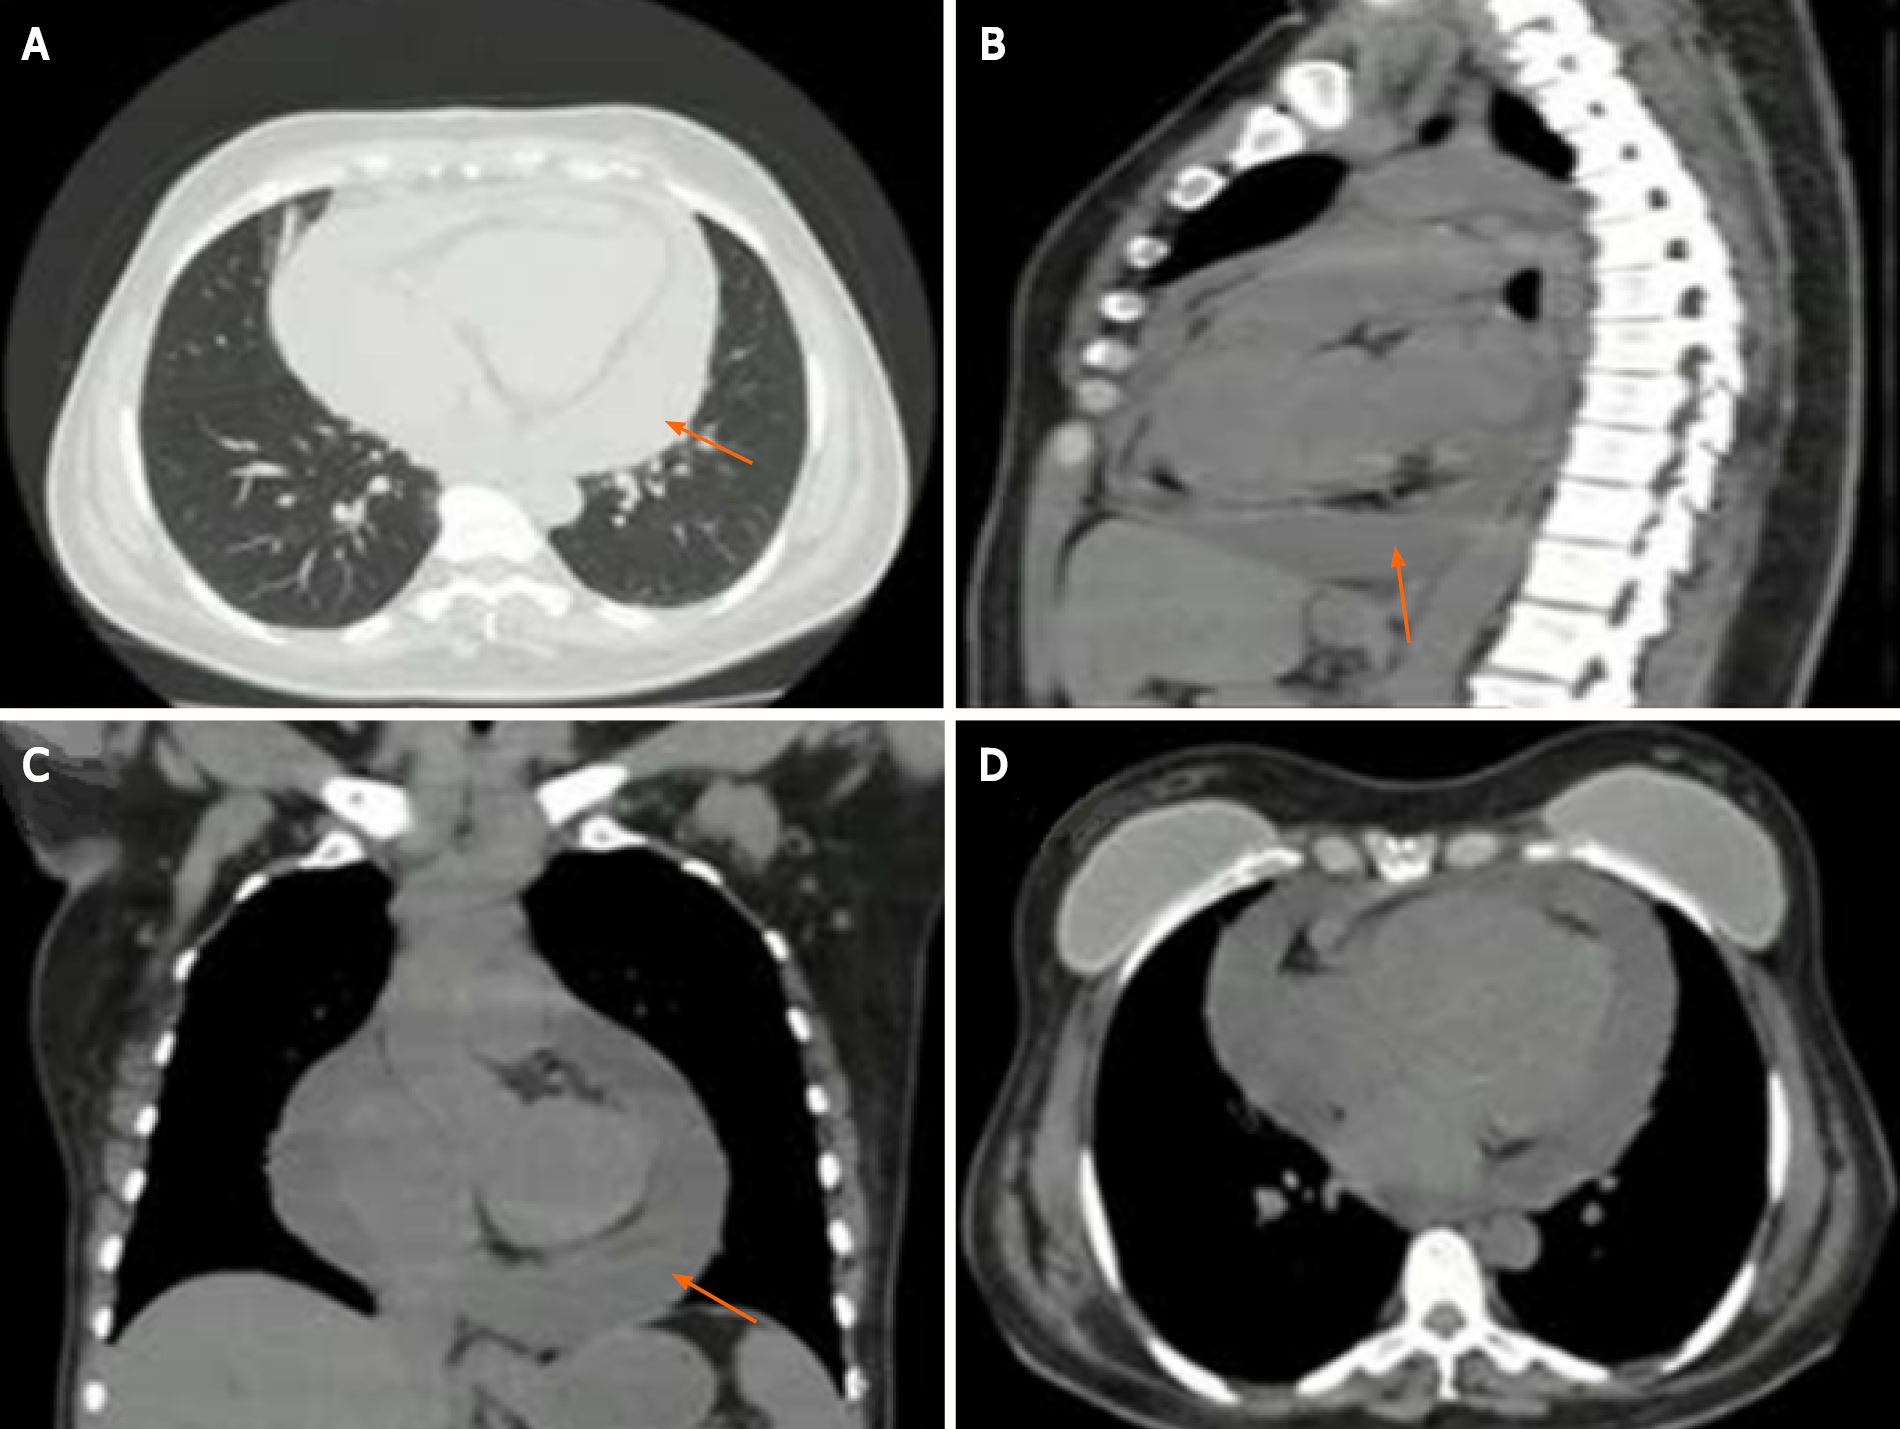
Figure 4 Chest computed tomography.
A-C: Axial (A), sagittal (B), and coronal (C) computed tomography showing severe pericardial effusion thickness of up to 25 mm (arrows); D: No evidence of right ventricular free wall flattening. The breast implants had no signs of extracapsular rupture.
- Citation: Lucero OD, Bustos MM, Ariza Rodríguez DJ, Perez JC. Tuberculous pericarditis-a silent and challenging disease: A case report. World J Clin Cases 2022; 10(6): 1869-1875
- URL: https://www.wjgnet.com/2307-8960/full/v10/i6/1869.htm
- DOI: https://dx.doi.org/10.12998/wjcc.v10.i6.1869


