Copyright
©The Author(s) 2022.
World J Clin Cases. Feb 26, 2022; 10(6): 1852-1862
Published online Feb 26, 2022. doi: 10.12998/wjcc.v10.i6.1852
Published online Feb 26, 2022. doi: 10.12998/wjcc.v10.i6.1852
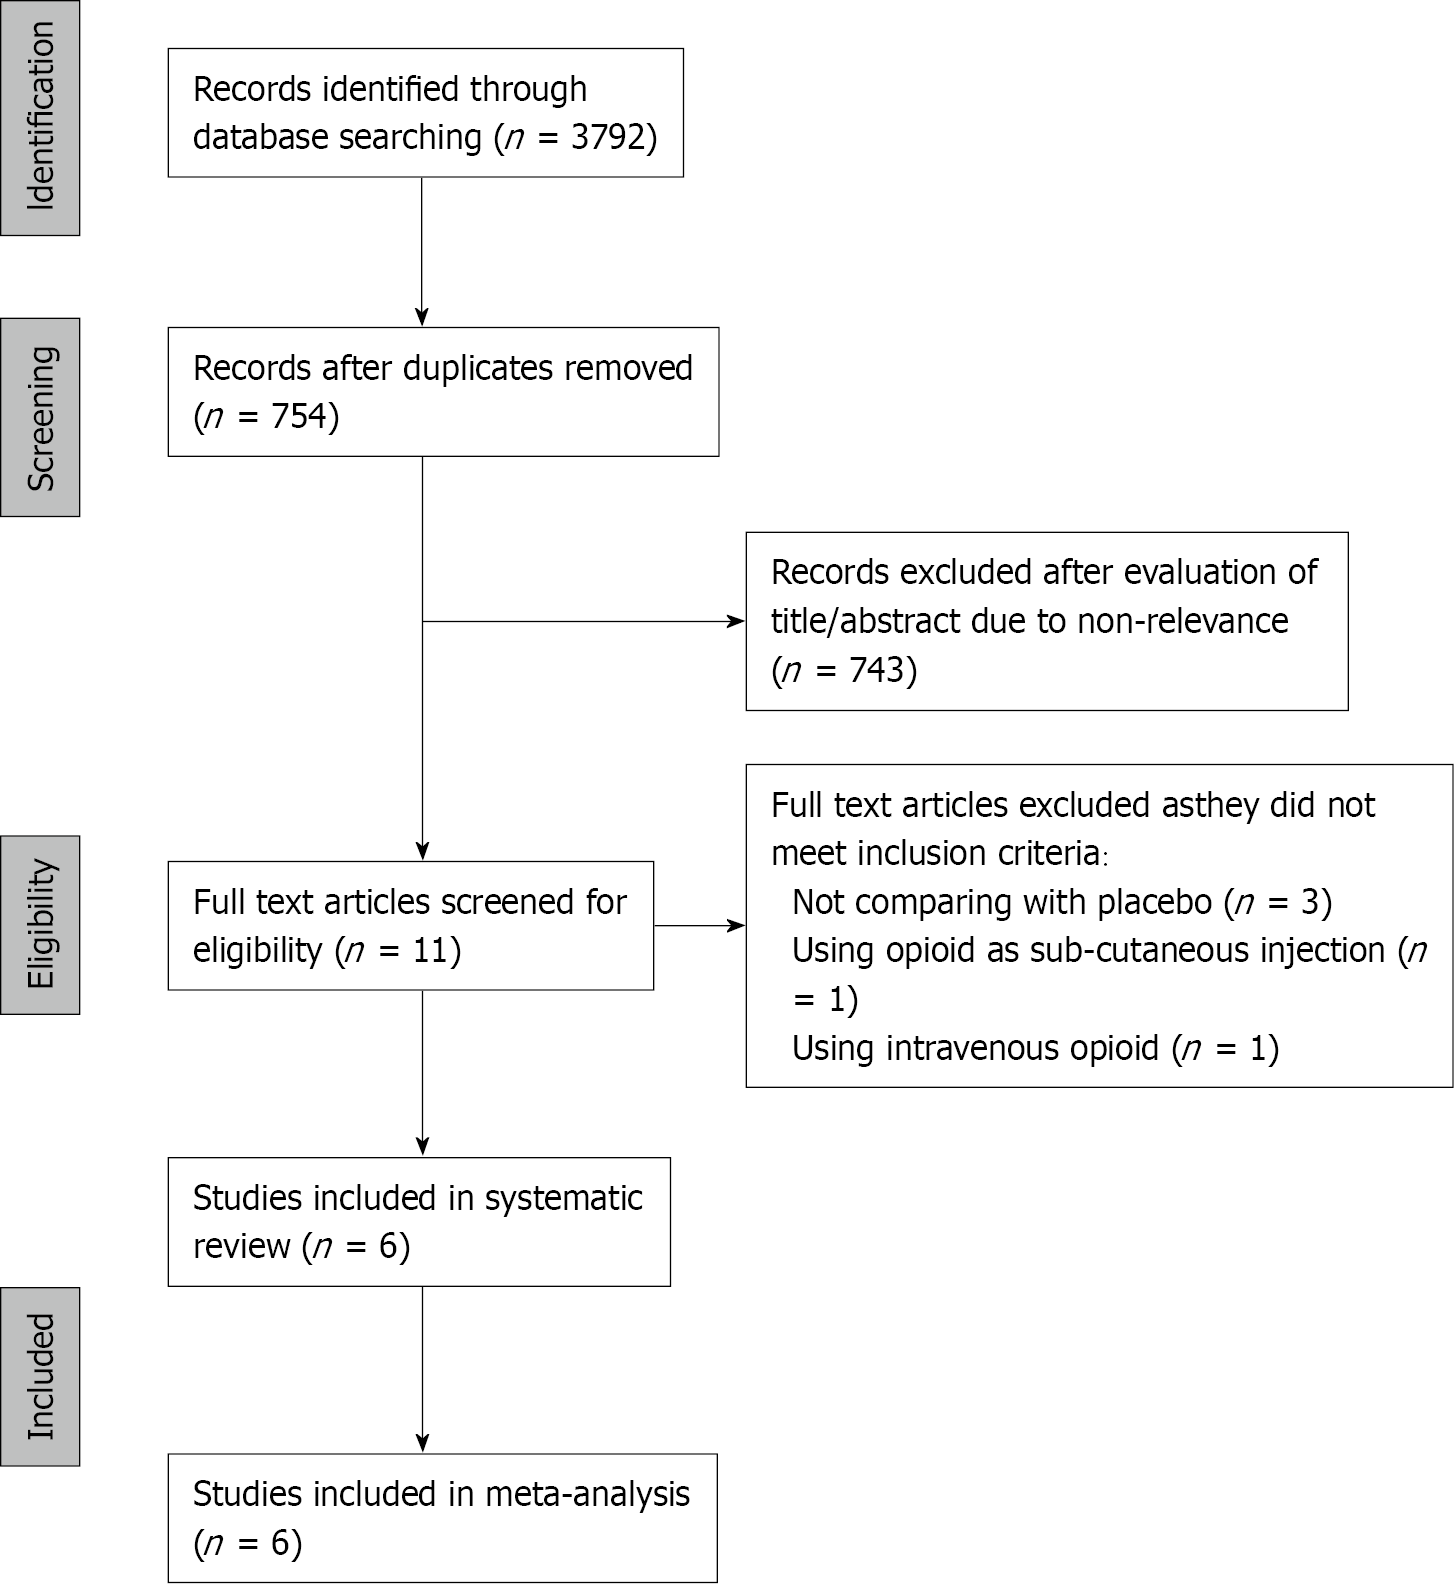
Figure 1 Study flow chart.
Figure 2 Forest plot of 24-h total analgesic consumption with sub-group analysis based on type of paravertebral block.
Figure 3 Forest plot of time to first analgesic request in hours.
Figure 4 Forest plot of 24-h visual analog scale pain score with sub-group analysis based on type of paravertebral block.
Figure 5 Forest plot of incidence of postoperative nausea and vomiting with sub-group analysis based on type of paravertebral block.
- Citation: Chen MH, Chen Z, Zhao D. Impact of adding opioids to paravertebral blocks in breast cancer surgery patients: A systematic review and meta-analysis. World J Clin Cases 2022; 10(6): 1852-1862
- URL: https://www.wjgnet.com/2307-8960/full/v10/i6/1852.htm
- DOI: https://dx.doi.org/10.12998/wjcc.v10.i6.1852


