Copyright
©The Author(s) 2022.
World J Clin Cases. Feb 6, 2022; 10(4): 1423-1431
Published online Feb 6, 2022. doi: 10.12998/wjcc.v10.i4.1423
Published online Feb 6, 2022. doi: 10.12998/wjcc.v10.i4.1423
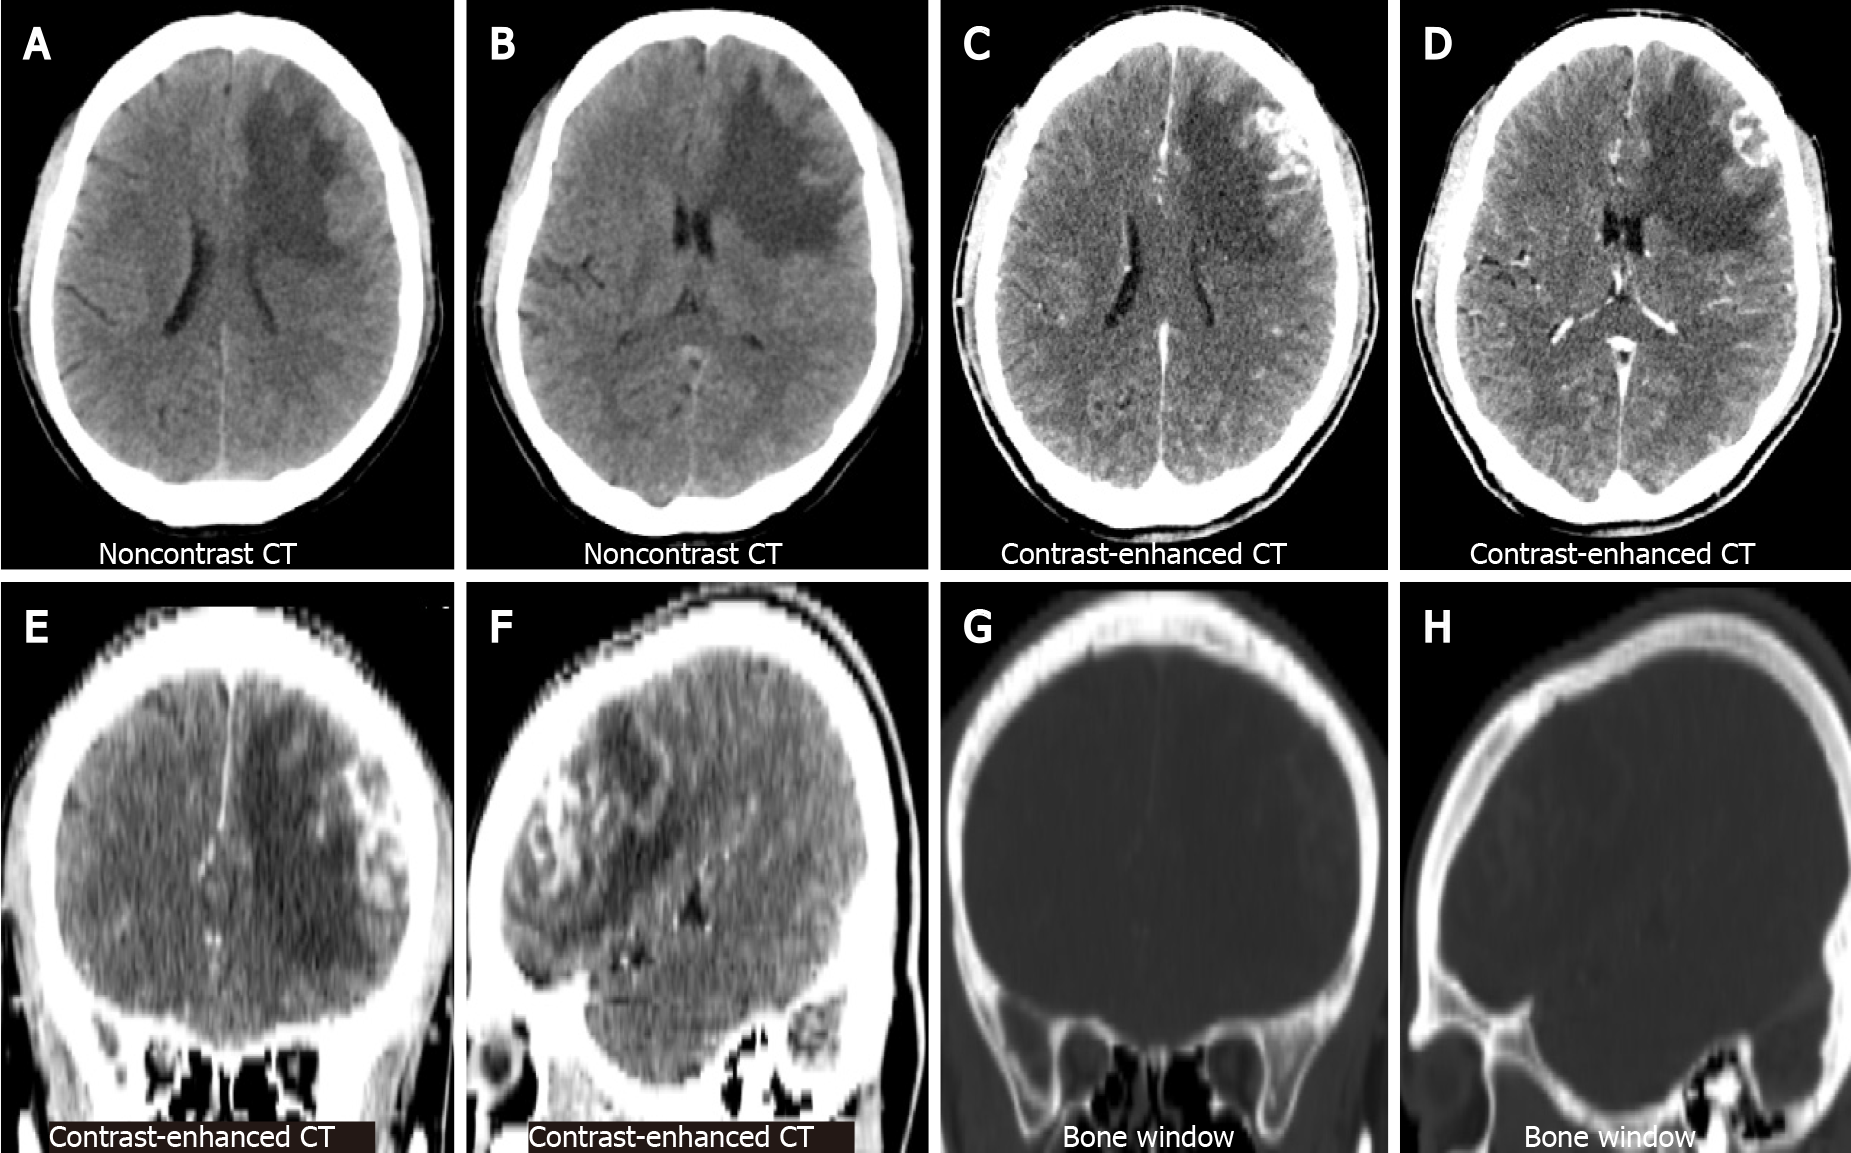
Figure 1 Brain computed tomography.
A and B: Represent the lateral ventricular and basal ganglia levels on non-contrast computed tomography (CT), respectively. An irregularly shaped nodule is observed in the left frontal lobe with large perifocal low-density oedema; C and D: Represent the same level as the former on contrast-enhanced CT. The nodules are significantly enhanced heterogeneously; E and F: Represent the coronal and sagittal views of the contrast-enhanced CT; G and H: Represent the same level as the former, with no abnormalities in the adjacent skull. CT: Computed tomography.
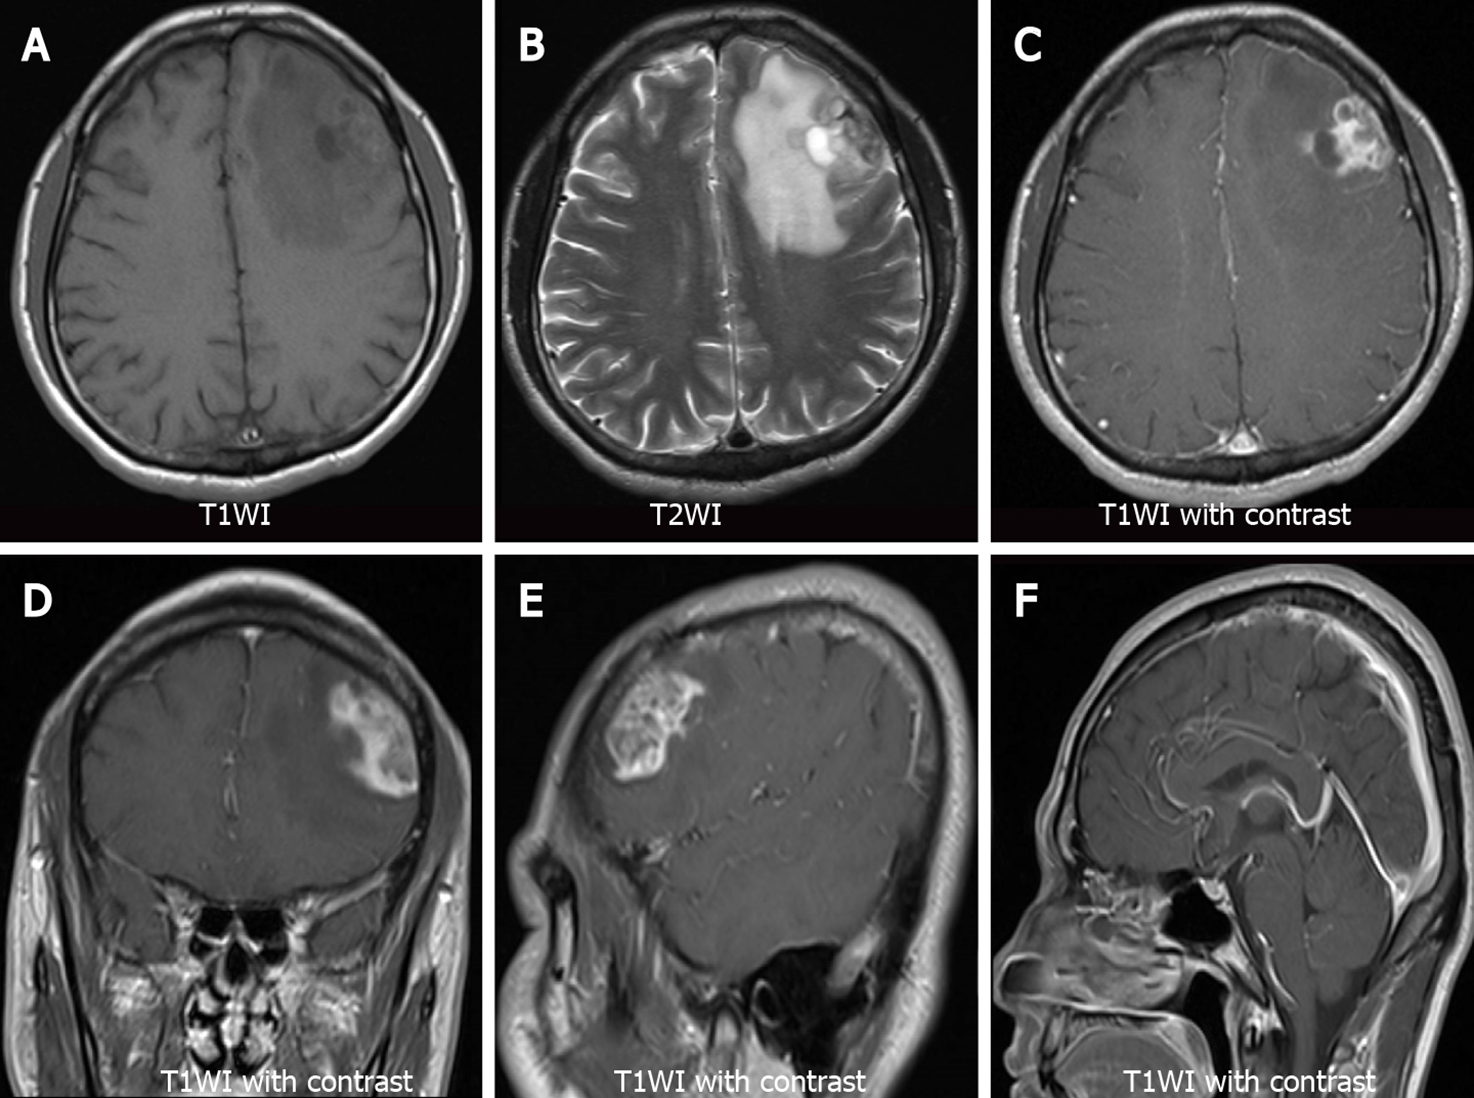
Figure 2 Brain magnetic resonance imaging.
A: Axial T1-weighted images (T1WI) show heterogeneous hypo-intensity of the left frontal lobe lesion; B: Axial T2-weighted images (T2WI) show heterogeneously mixed signal of hyperintensity with hypointense areas of the left frontal lobe lesion; C-E: Axial, coronal, and sagittal views of T1WI with contrast agent administration show heterogeneous enhancement of the lesion; F: Sagittal T1WI show no abnormality in the sellar region. T1WI: T1-weighted images; T2WI: T2-weighted images.
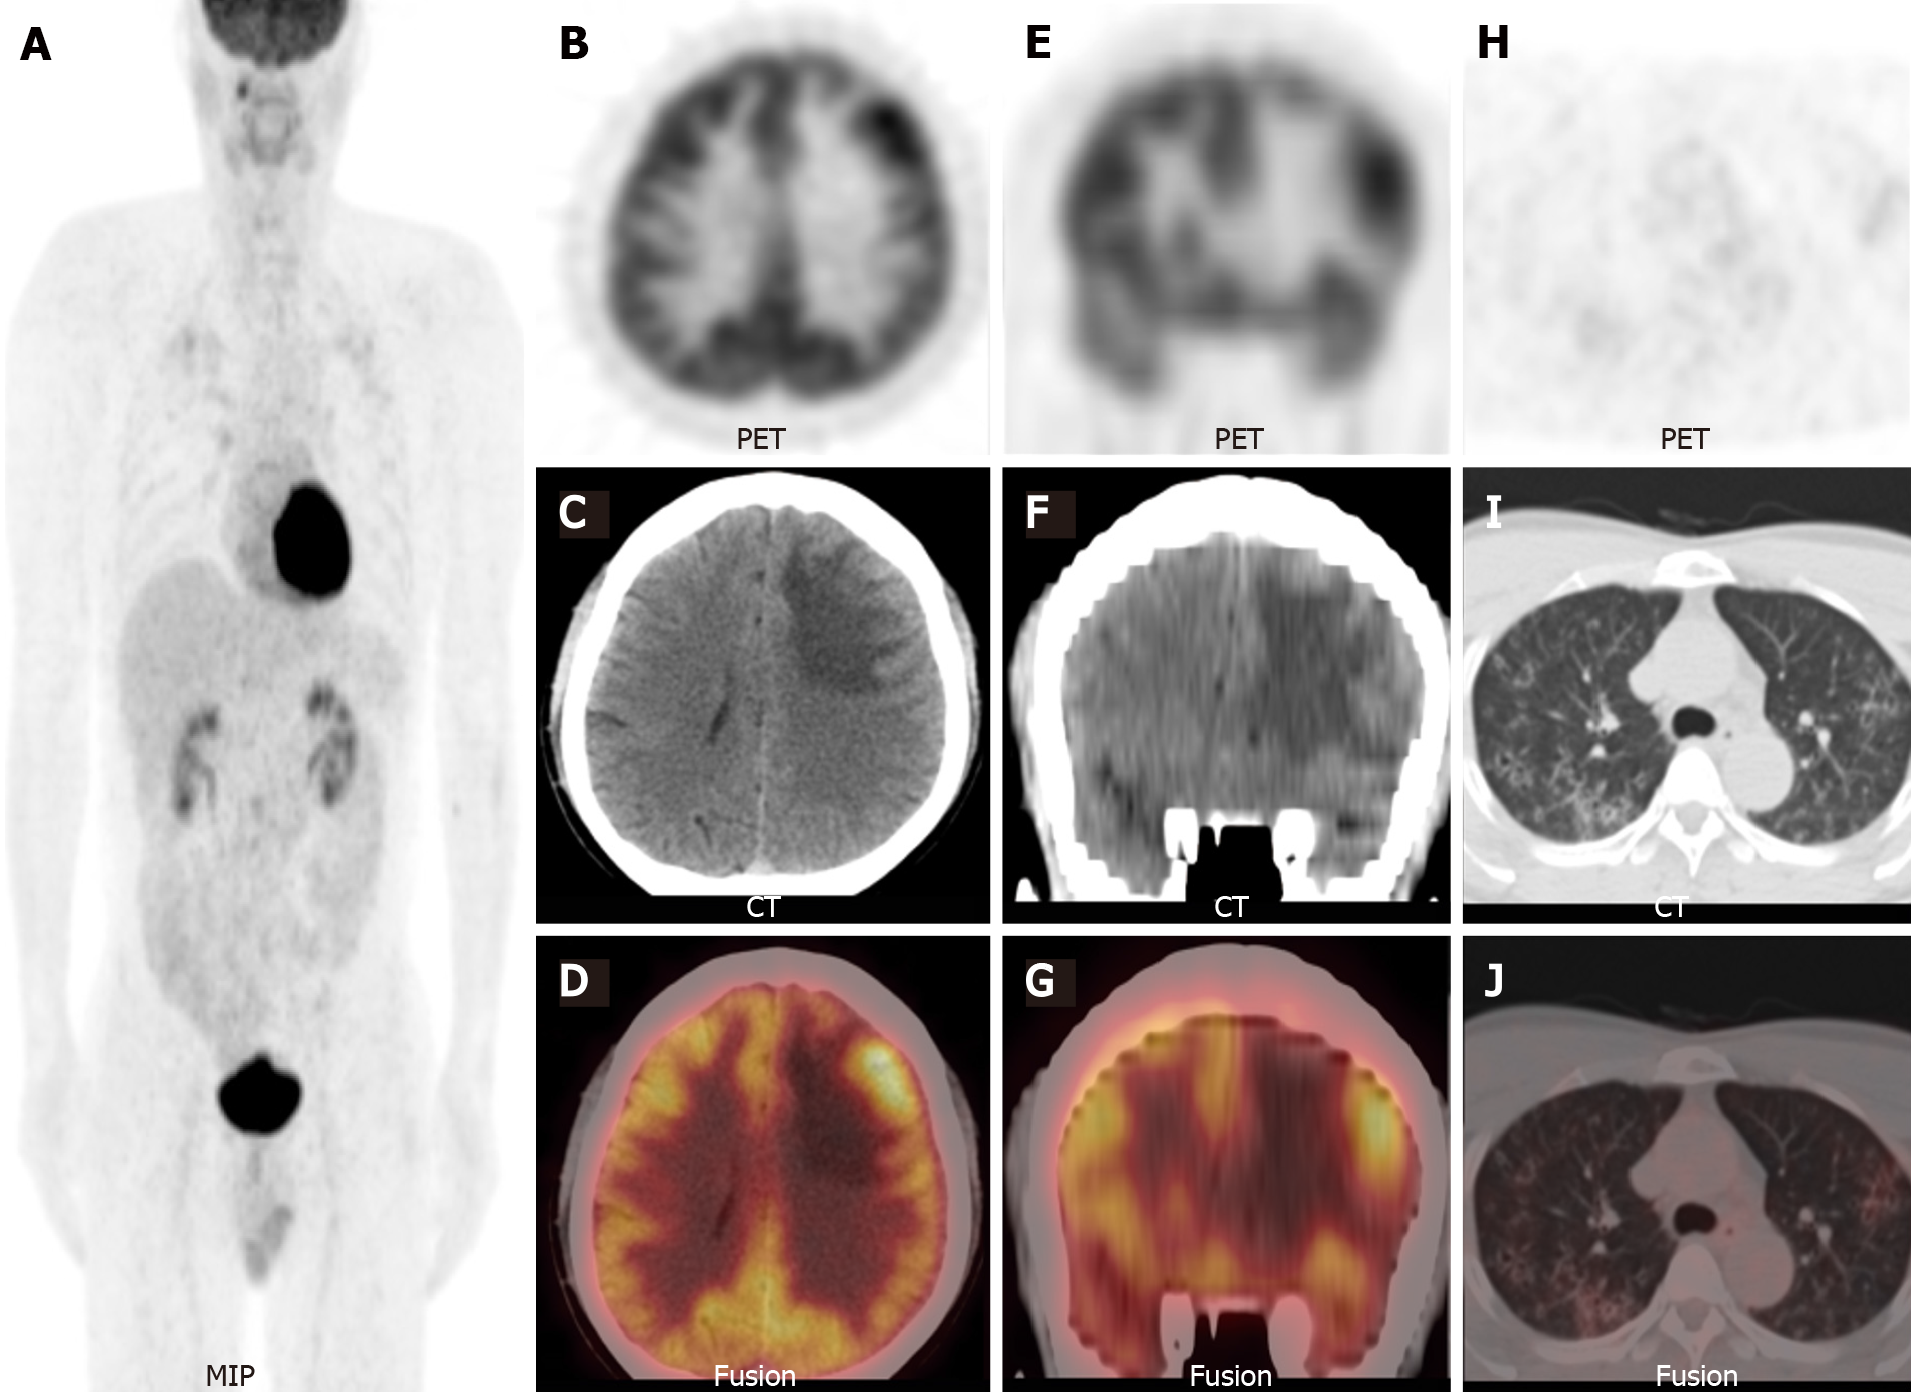
Figure 3 18F-fluorodeoxyglucose positron emission tomography/computed tomography.
A: Maximum-intensity-projection show a focal 18F-fluorodeoxyglucose (18F-FDG) uptake lesion in the right maxillary sinus and multiple foci with 18F-FDG uptake in the bilateral lung field; B-G: Axial and coronal views of the selected positron emission tomography (PET), non-enhanced computed tomography (NE-CT), and fused PET/CT images show the left frontal lesion with 18F-FDG uptake (SUVmax 9.5, arrowheads); H-J: Axial views of the selected PET, NE-CT, and fused PET/CT images show multiple cysts with peripheral exudation in the upper lobes of bilateral lungs, with slightly increased 18F-FDG uptake (SUVmax 3.2). MIP: Maximum-intensity-projection; PET: Positron emission tomography; CT: Computed tomography.
Figure 4 High-resolution computed tomography of the lung.
Axial, coronal, and sagittal (the left and right lungs, respectively) views of high-resolution computed tomography images show multiple scattered small thick-walled irregular cysts as well as small nodules. A: Axial; B: Coronal; C: Left lungs; D: Right lungs.
Figure 5 Histopathological images.
A: The specimen is a greyish brown and greyish dark solid tumour; B: The cut surface is greyish brown and greyish white; C: Histopathological examination reveal mononucleated and multinucleated histocytes with abundant cytoplasm and light staining (haematoxylin and eosin, magnification, × 400).
- Citation: Liang HX, Yang YL, Zhang Q, Xie Z, Liu ET, Wang SX. Langerhans cell histiocytosis presenting as an isolated brain tumour: A case report . World J Clin Cases 2022; 10(4): 1423-1431
- URL: https://www.wjgnet.com/2307-8960/full/v10/i4/1423.htm
- DOI: https://dx.doi.org/10.12998/wjcc.v10.i4.1423


