Copyright
©The Author(s) 2022.
World J Clin Cases. Feb 6, 2022; 10(4): 1242-1254
Published online Feb 6, 2022. doi: 10.12998/wjcc.v10.i4.1242
Published online Feb 6, 2022. doi: 10.12998/wjcc.v10.i4.1242
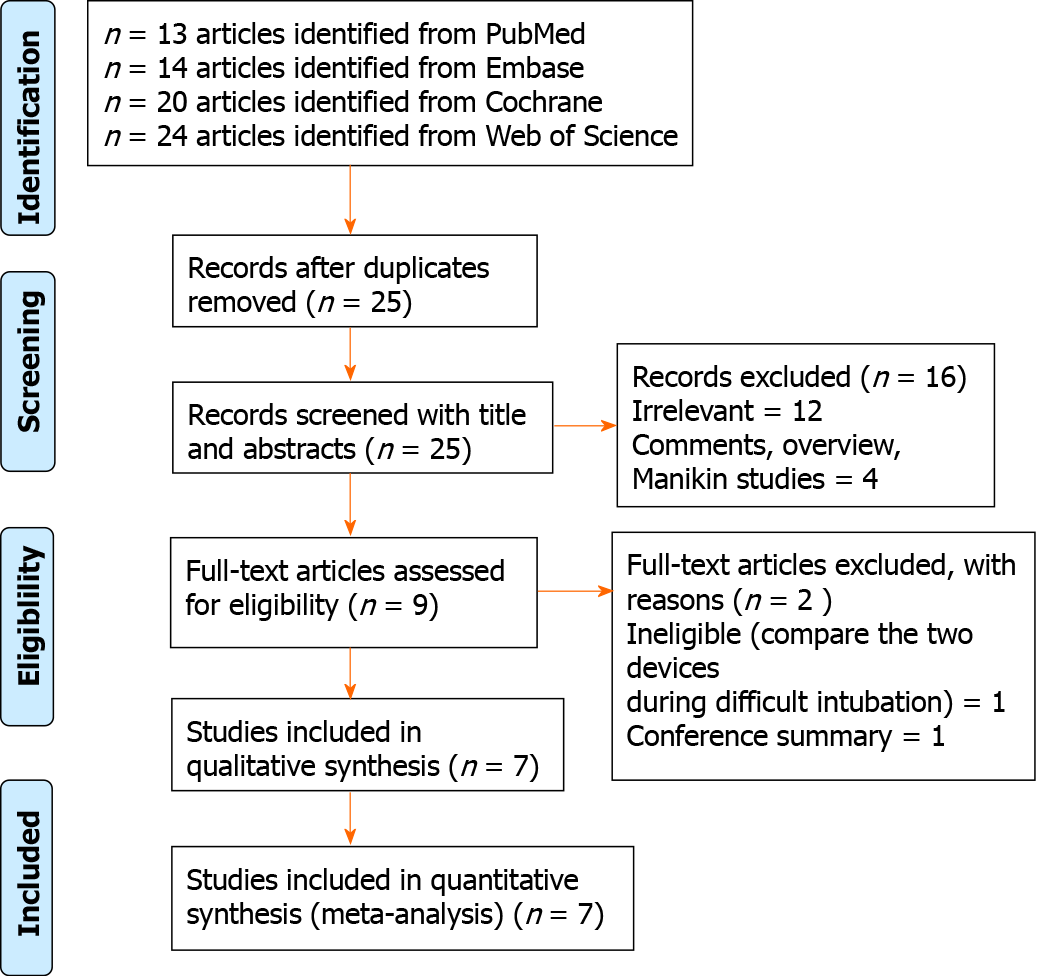
Figure 1 PRISMA flowchart.
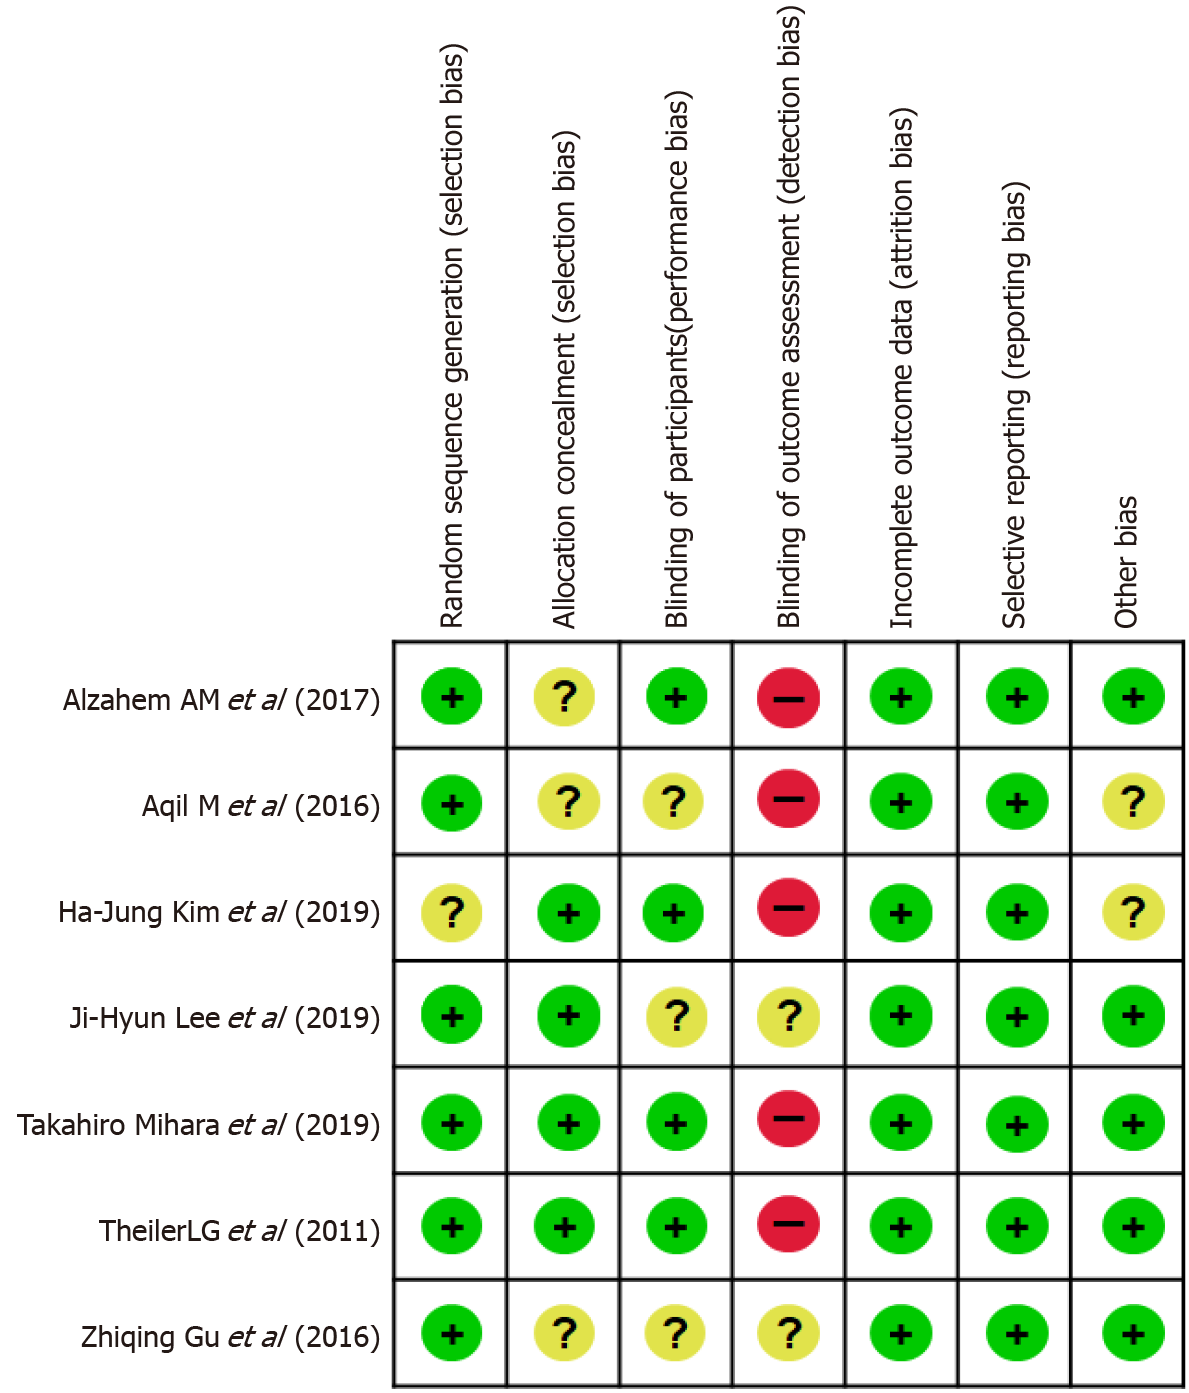
Figure 2 Risk of bias assessments within the included studies.
Figure 3 Forest plot of oropharyngeal leak pressure: Ambu vs i-gel.
The mean leak pressure was higher in the i-gel group than in the Ambu group, with substantial heterogeneity (21.82 cmH2O for Ambu vs 23.98 cmH2O for i-gel, P = 0.003, 95% confidence interval: -3.58 to -0.75, I2 = 68%, Mantel-Haenszel random model). CI: Confidence interval.
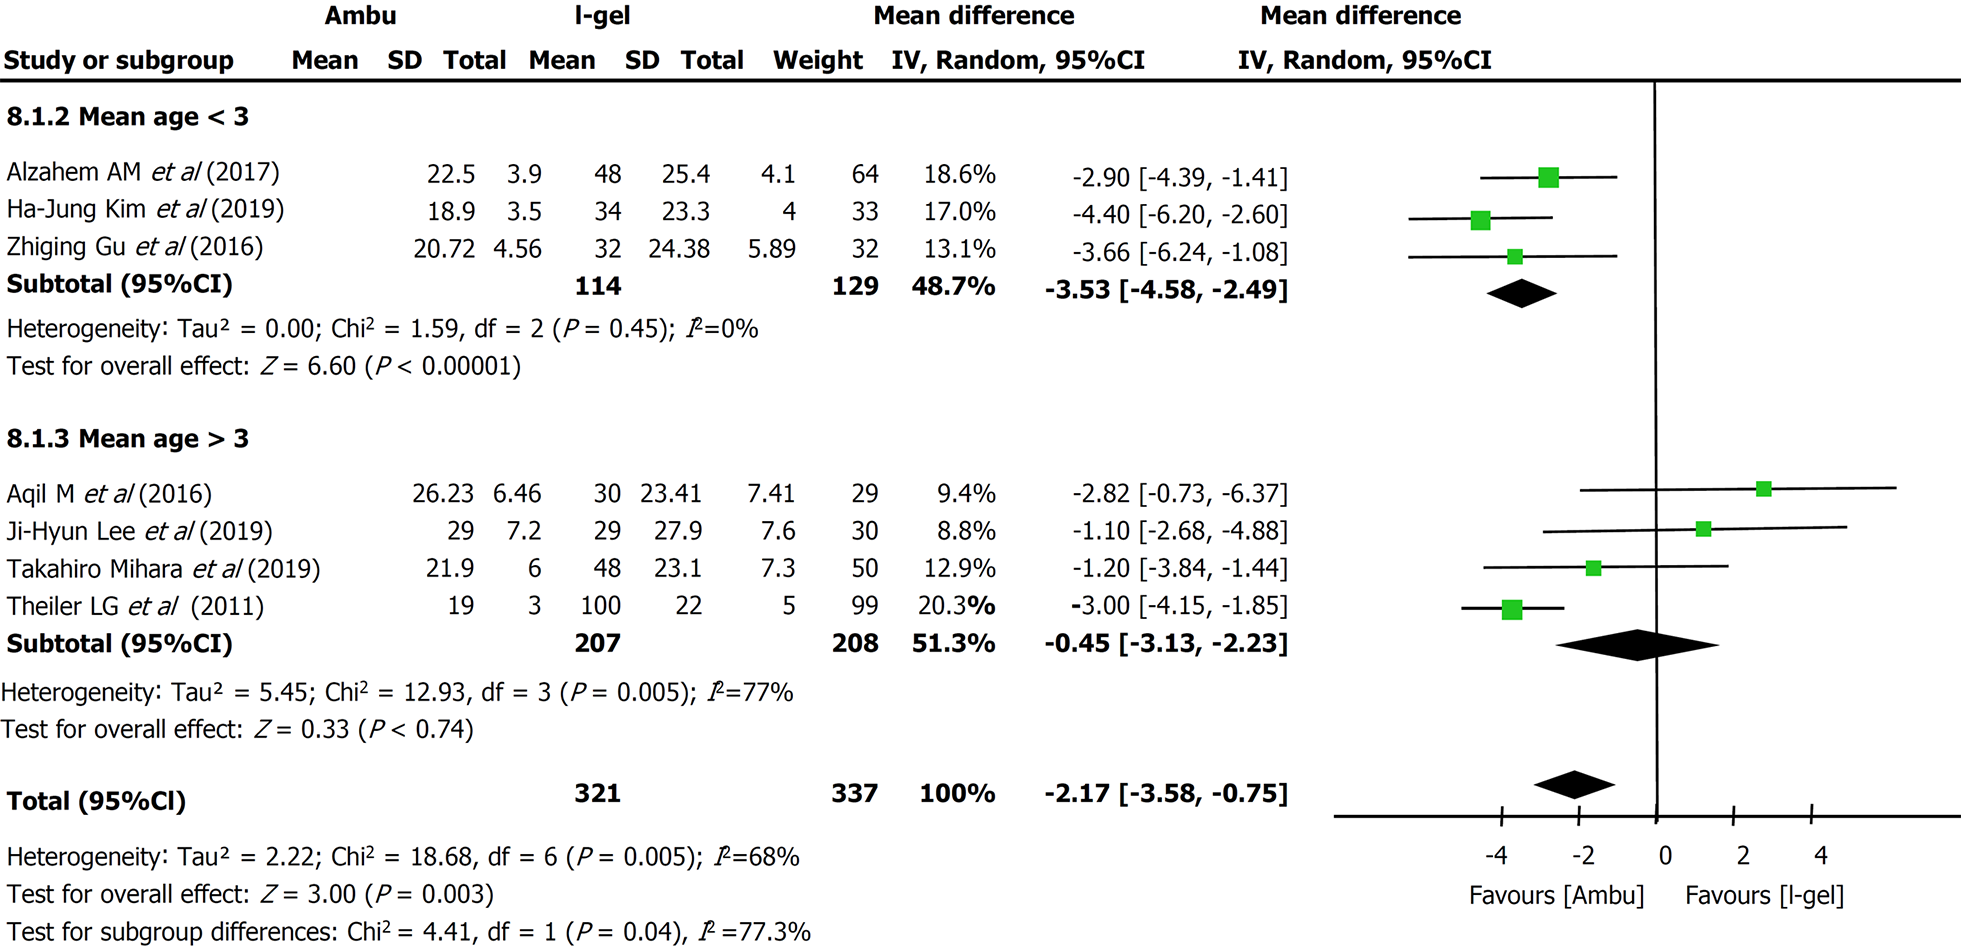
Figure 4 Forest plot of subgroup analysis of oropharyngeal leak pressure according to the mean age of the study population: Ambu vs i-gel.
The combined oropharyngeal leak pressure from studies with participants whose mean age was < 3 years was significantly higher for i-gel (mean difference -3.53 cmH2O, 95% confidence interval: -4.58 to -2.49, P < 0.00001, I2 = 0%) while pooled analysis from the other four studies showed no significance between the two devices. CI: Confidence interval.
Figure 5 Forest plot of the sensitivity analysis of oropharyngeal leak pressure.
The results were relatively stable, except when Aqil et al[18]’s study was excluded, which resulted in a lower heterogeneity (from 68% to 44%). CI: Confidence interval.
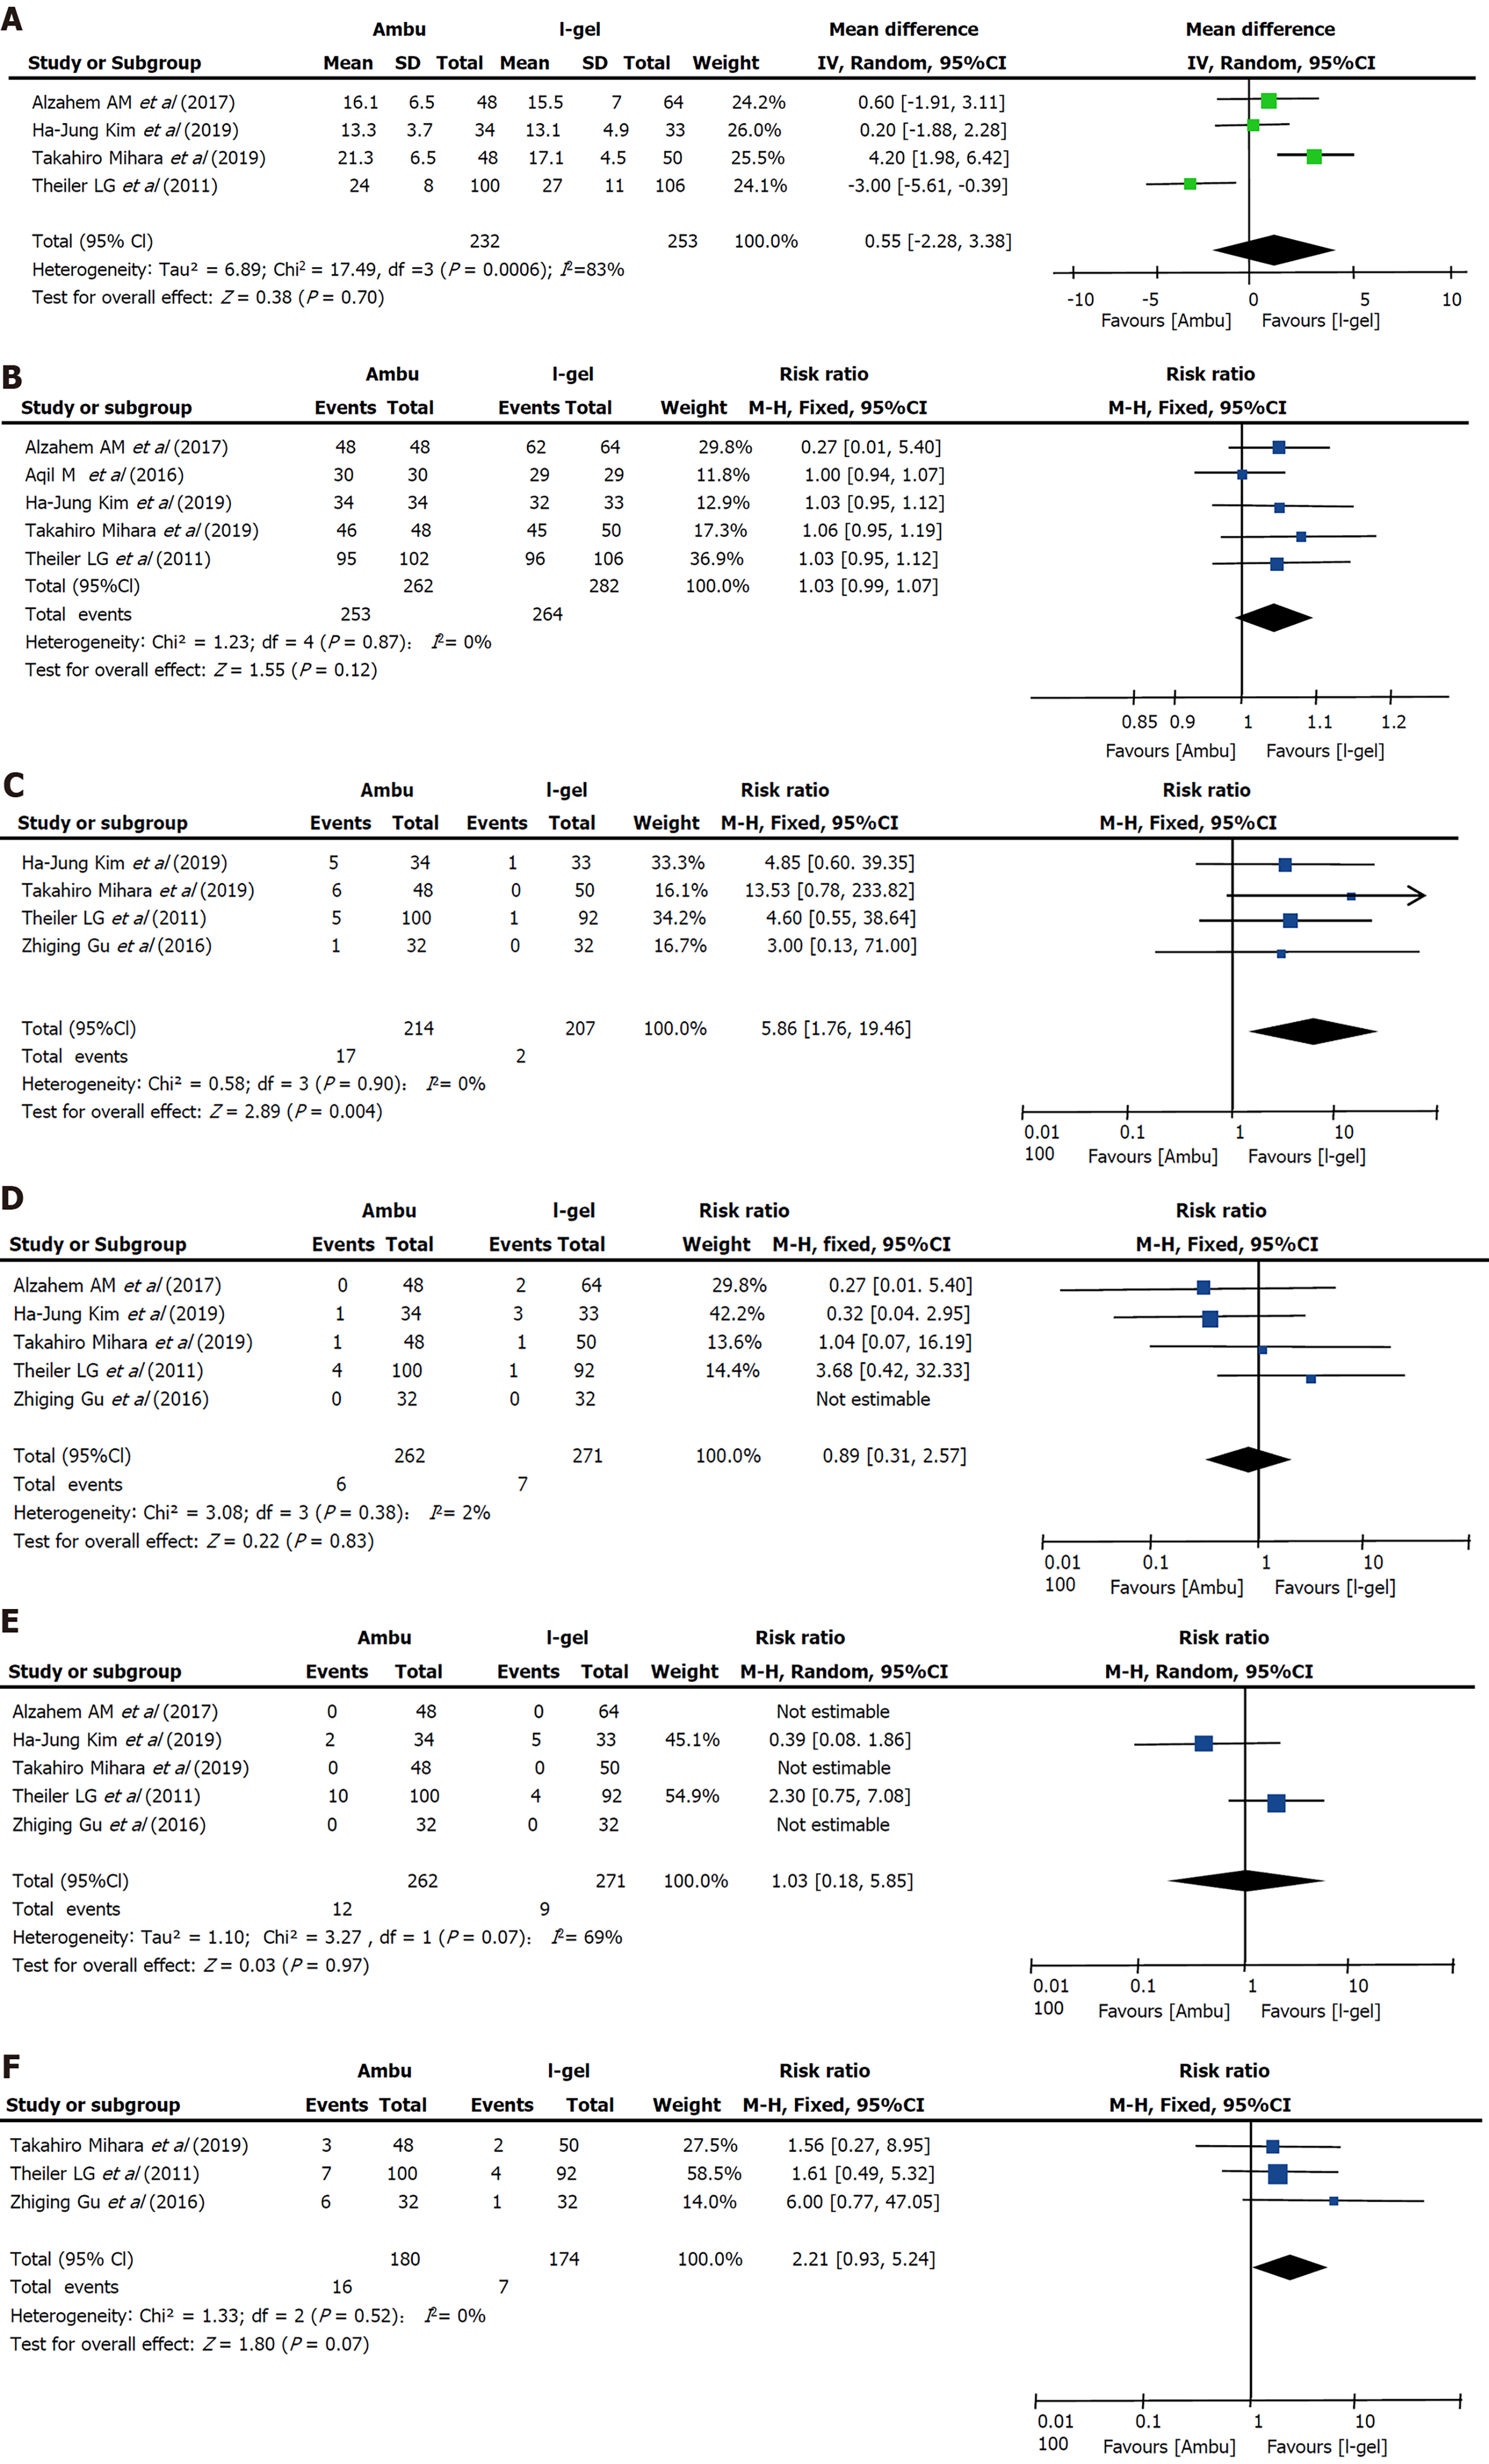
Figure 6 Forest plot of Ambu versus i-gel.
A: Insertion time; B: The success of insertion on the first attempt; C: The incidence of blood staining on the removed device; D: The incidence of desaturation; E: The incidence of bronchospasm; F: The incidence of coughing. CI: Confidence interval.
- Citation: Bao D, Yu Y, Xiong W, Wang YX, Liang Y, Li L, Liu B, Jin X. Comparison of the clinical performance of i-gel and Ambu laryngeal masks in anaesthetised paediatric patients: A meta-analysis. World J Clin Cases 2022; 10(4): 1242-1254
- URL: https://www.wjgnet.com/2307-8960/full/v10/i4/1242.htm
- DOI: https://dx.doi.org/10.12998/wjcc.v10.i4.1242


