Copyright
©The Author(s) 2022.
World J Clin Cases. Feb 6, 2022; 10(4): 1182-1189
Published online Feb 6, 2022. doi: 10.12998/wjcc.v10.i4.1182
Published online Feb 6, 2022. doi: 10.12998/wjcc.v10.i4.1182
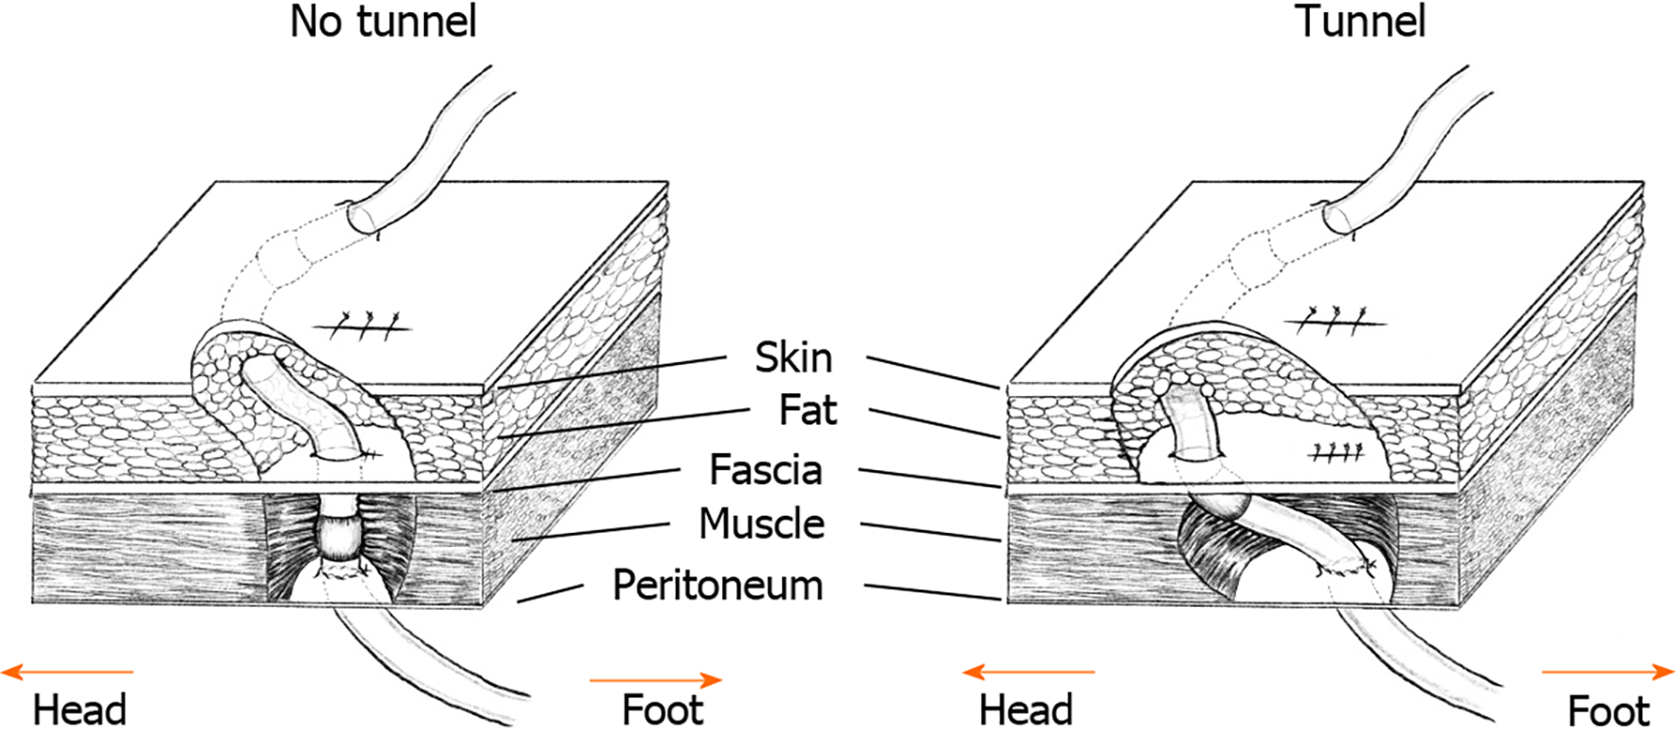
Figure 1 A schematic presentation of the “no-tunnel” (left) vs the modified “tunnel” methods (right) for catheter implantation.
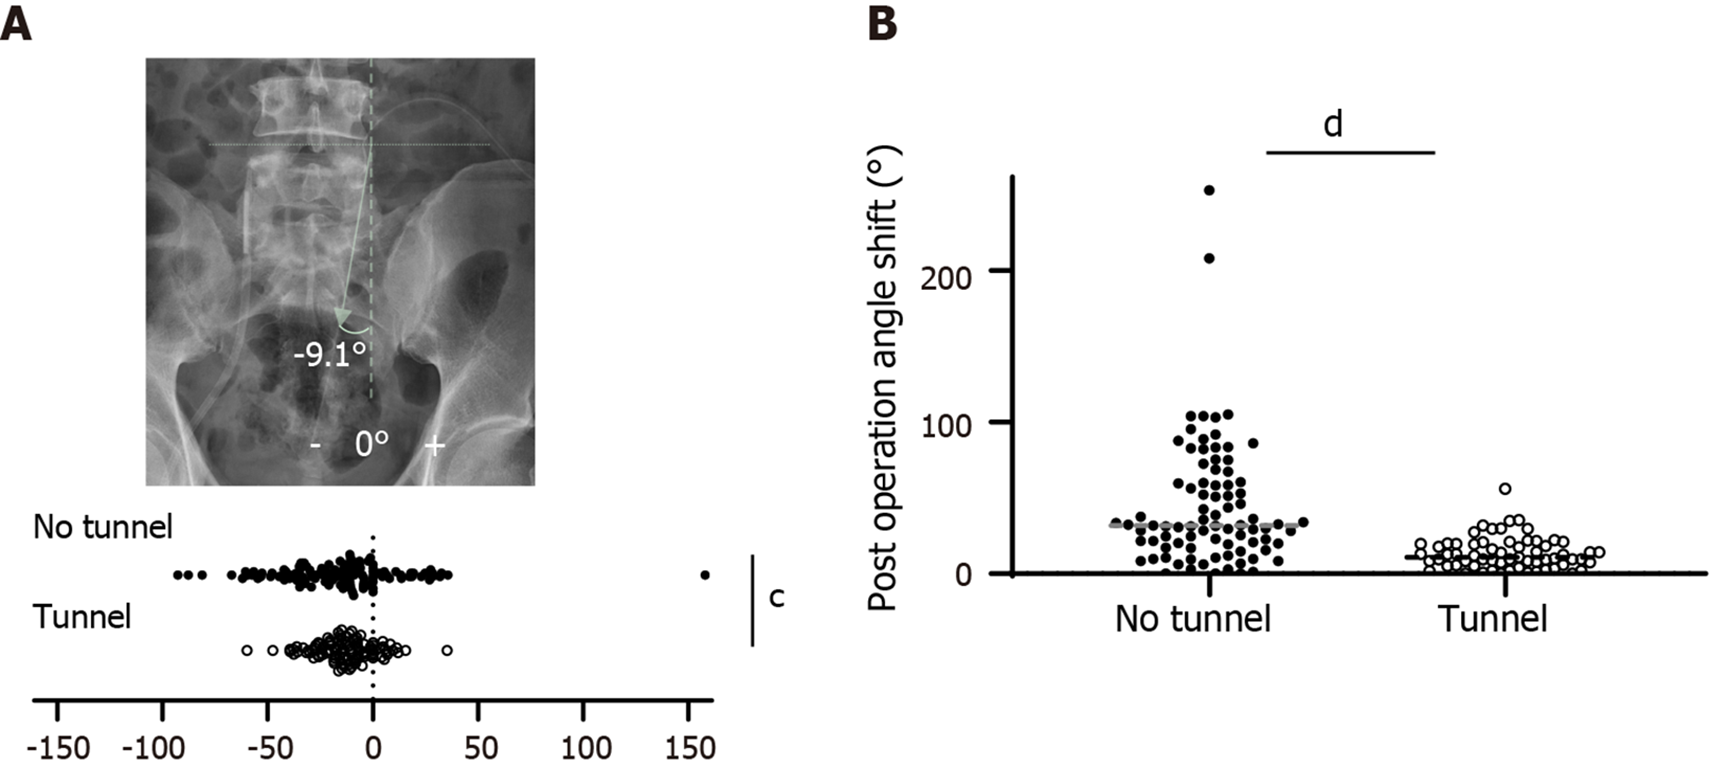
Figure 2 Comparison of catheter angle and migration.
A: Shows the catheter direction on a plain radiograph (upper) and catheter angle deviation (lower). The absolute value of the angle was significantly greater in the no-tunnel group than in the tunnel group (lower, cP = 0.0002 by unpaired t-test); B: The maximal difference in catheter angle. The tunnel group had a smaller range of catheter migration (dP < 0.0001).
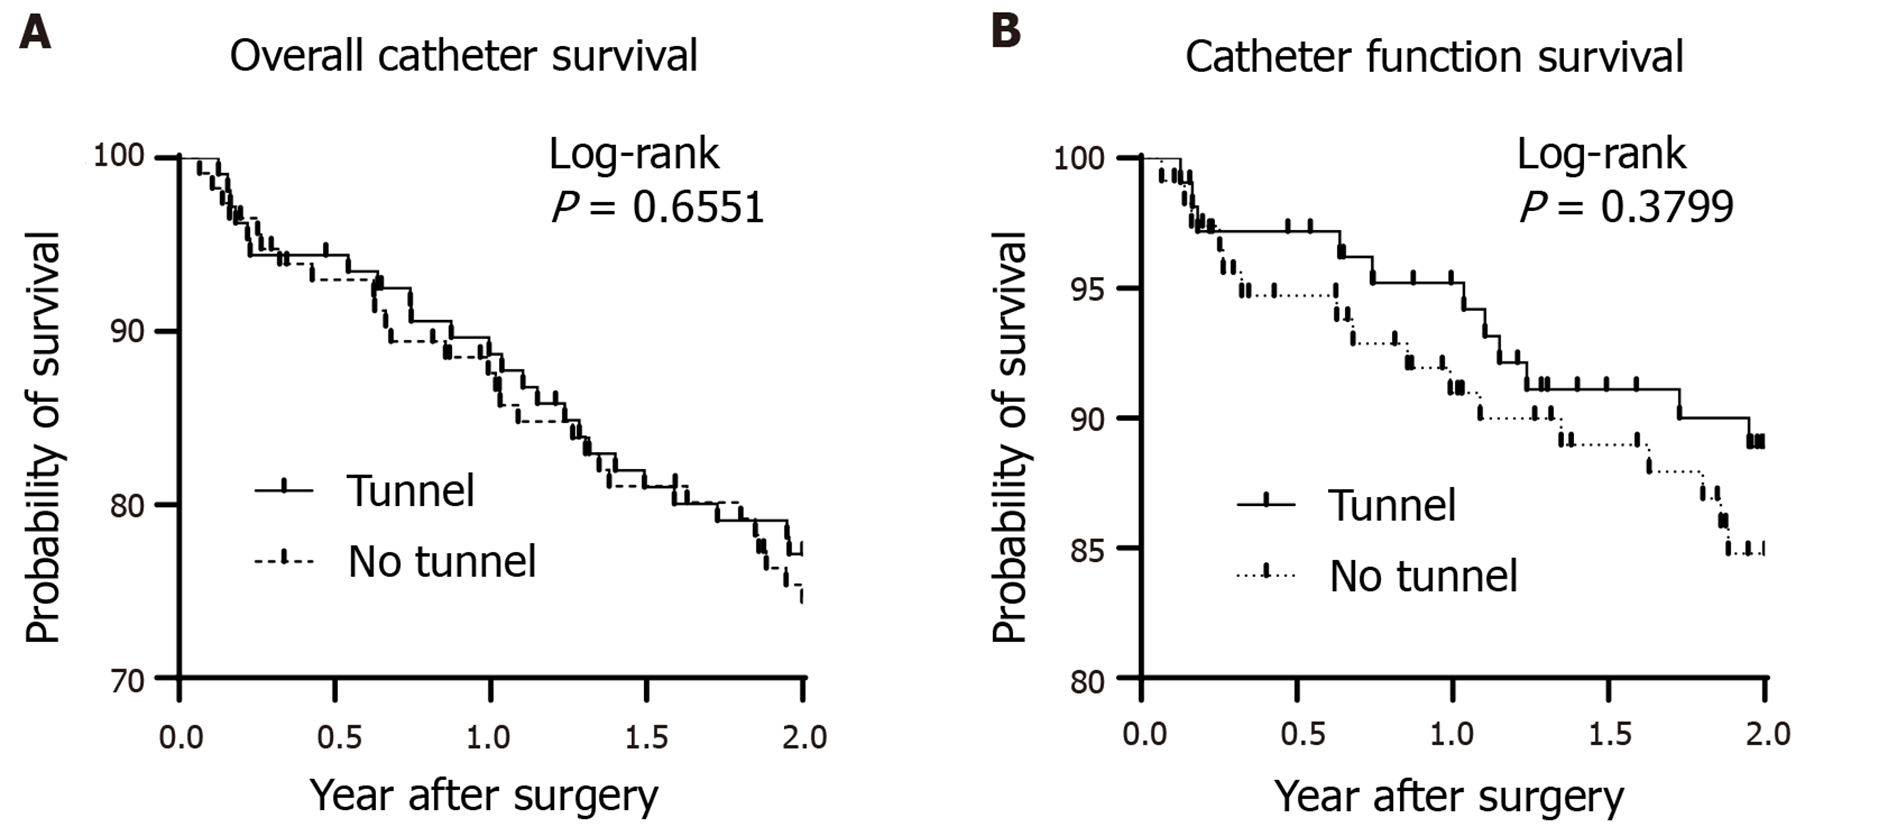
Figure 3 Comparison of catheter survival.
A: Kaplan–Meier curves were plotted for overall catheter survival; B: Functional catheter survival rates.
- Citation: Lee CY, Tsai MK, Chen YT, Zhan YJ, Wang ML, Chen CC. Importance of the creation of a short musculofascial tunnel in peritoneal dialysis catheter placement. World J Clin Cases 2022; 10(4): 1182-1189
- URL: https://www.wjgnet.com/2307-8960/full/v10/i4/1182.htm
- DOI: https://dx.doi.org/10.12998/wjcc.v10.i4.1182


