Copyright
©The Author(s) 2022.
World J Clin Cases. Dec 26, 2022; 10(36): 13337-13348
Published online Dec 26, 2022. doi: 10.12998/wjcc.v10.i36.13337
Published online Dec 26, 2022. doi: 10.12998/wjcc.v10.i36.13337
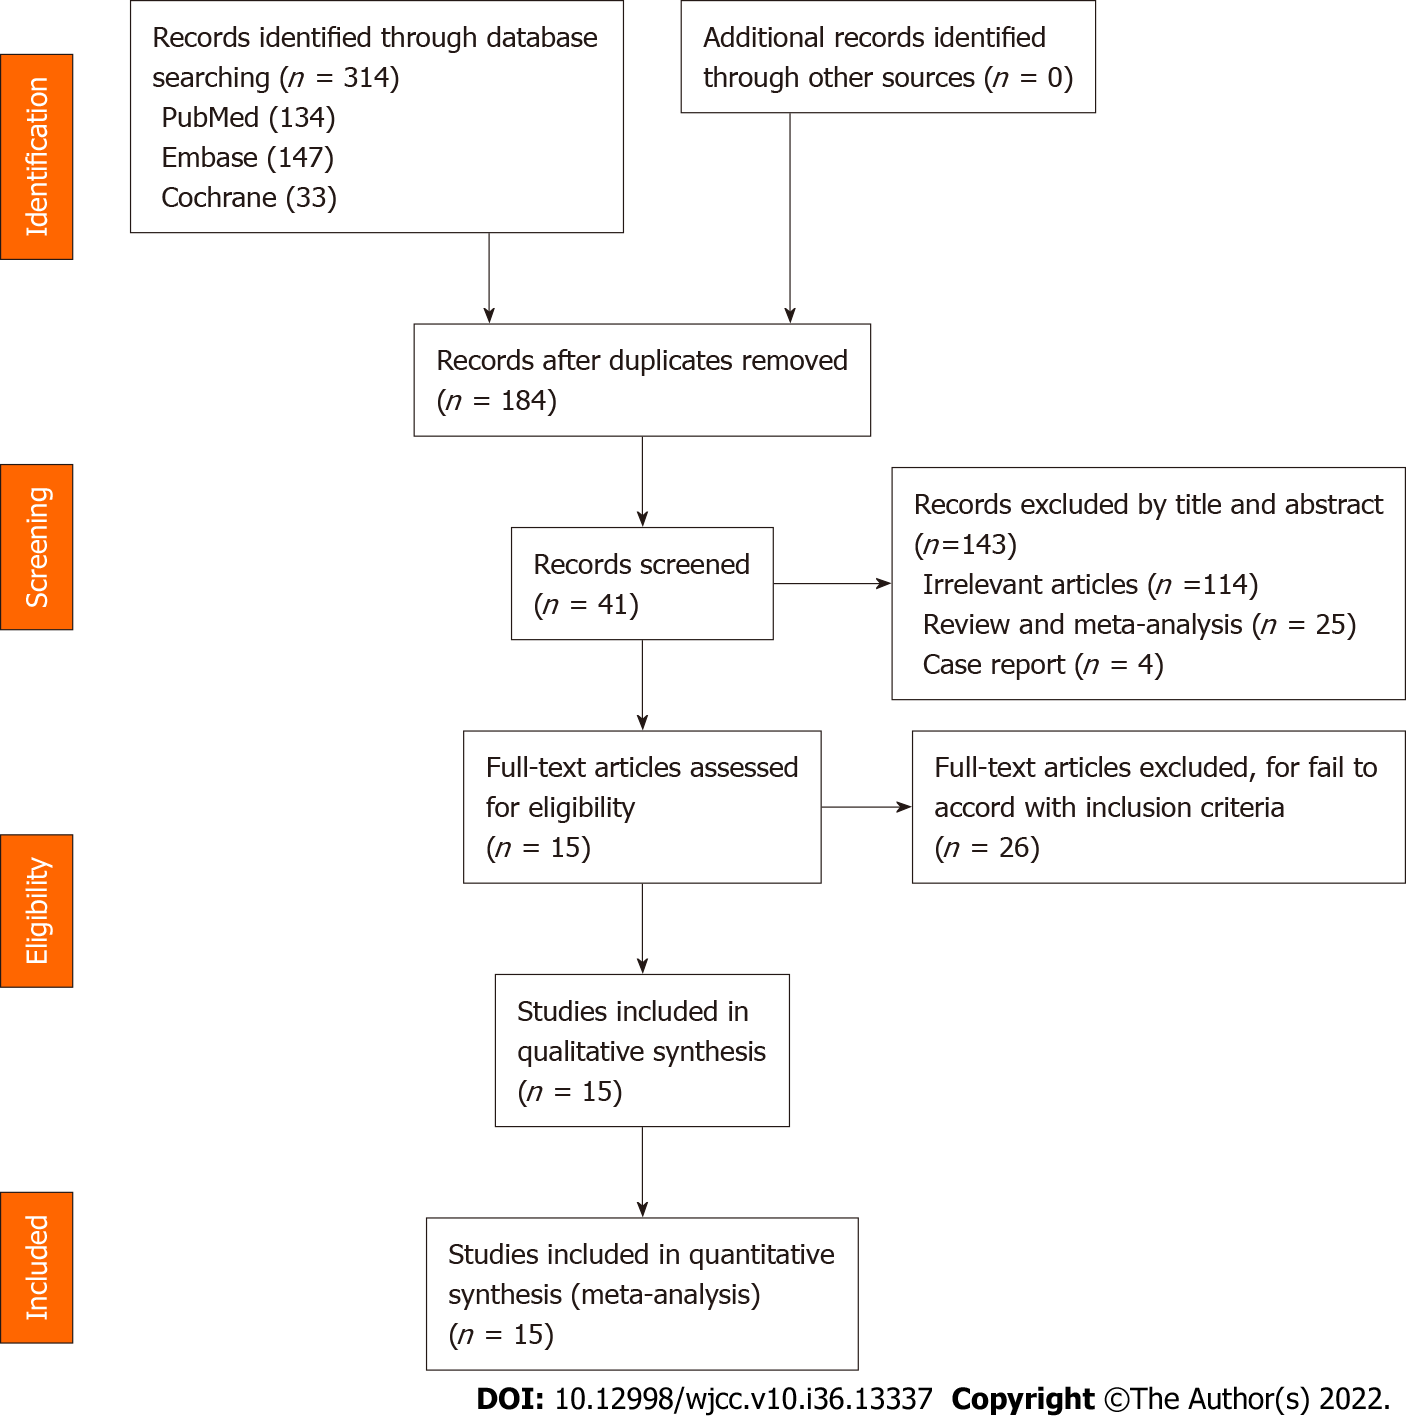
Figure 1 Flow diagram of study searching and selection process.
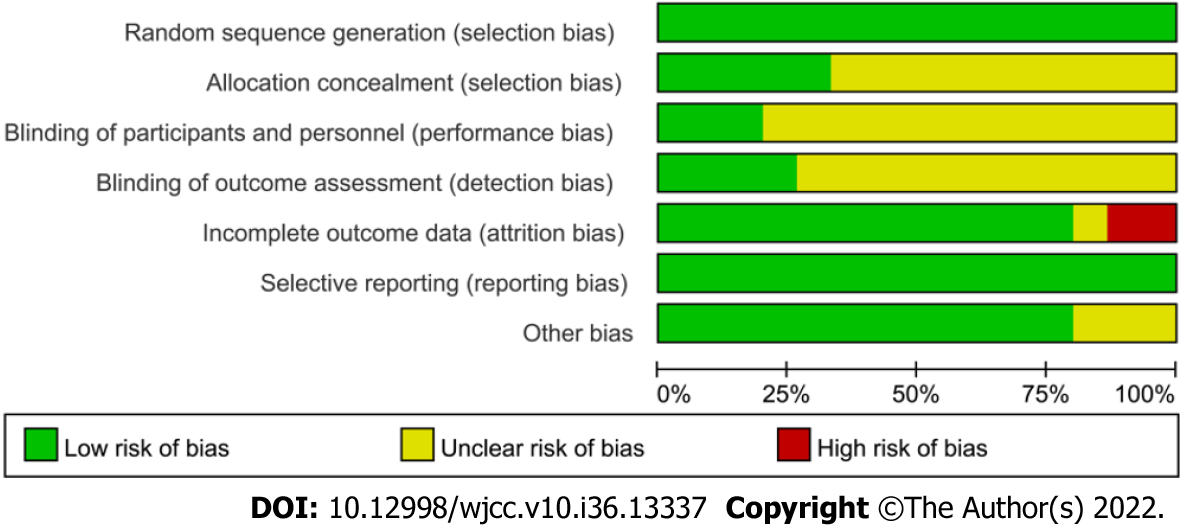
Figure 2 Risk of bias graph.
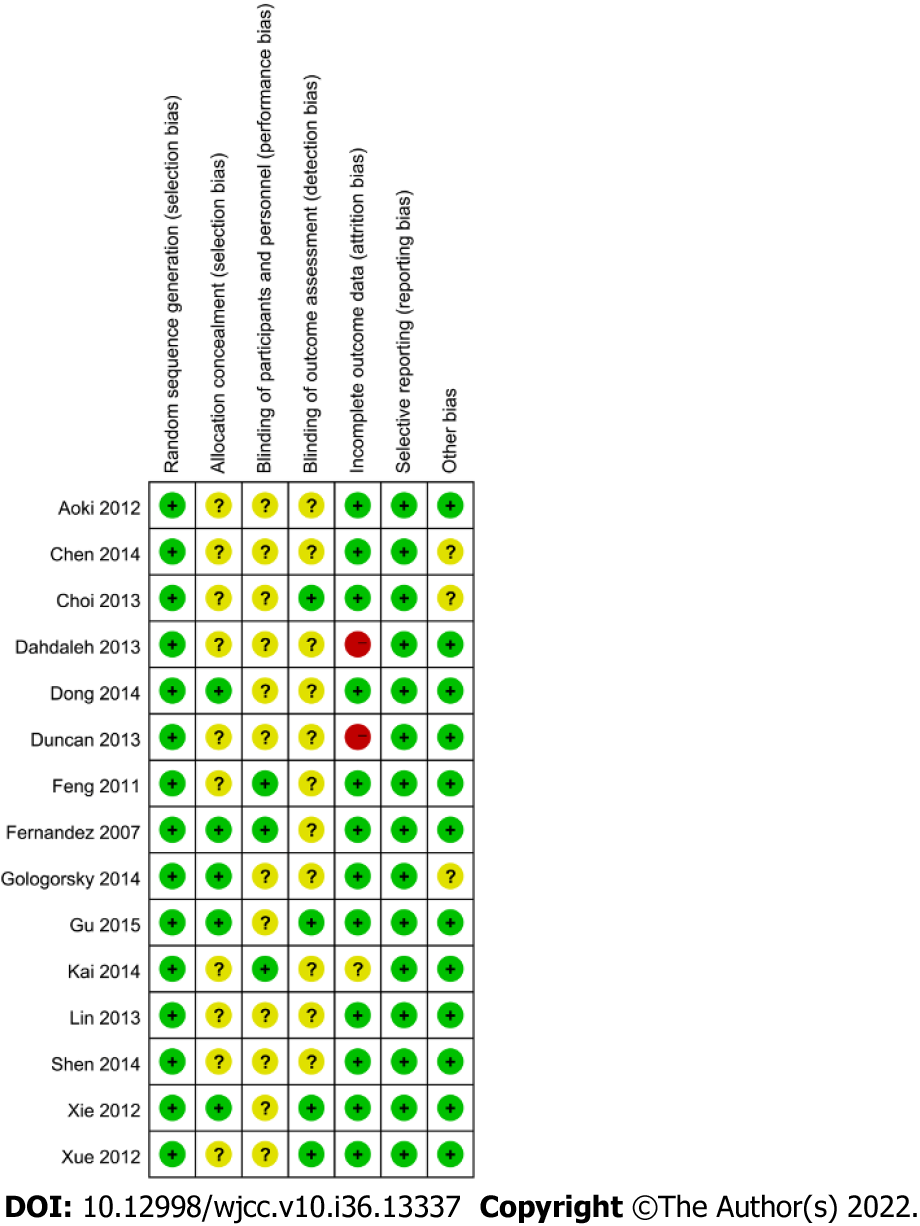
Figure 3 Risk of bias summary.
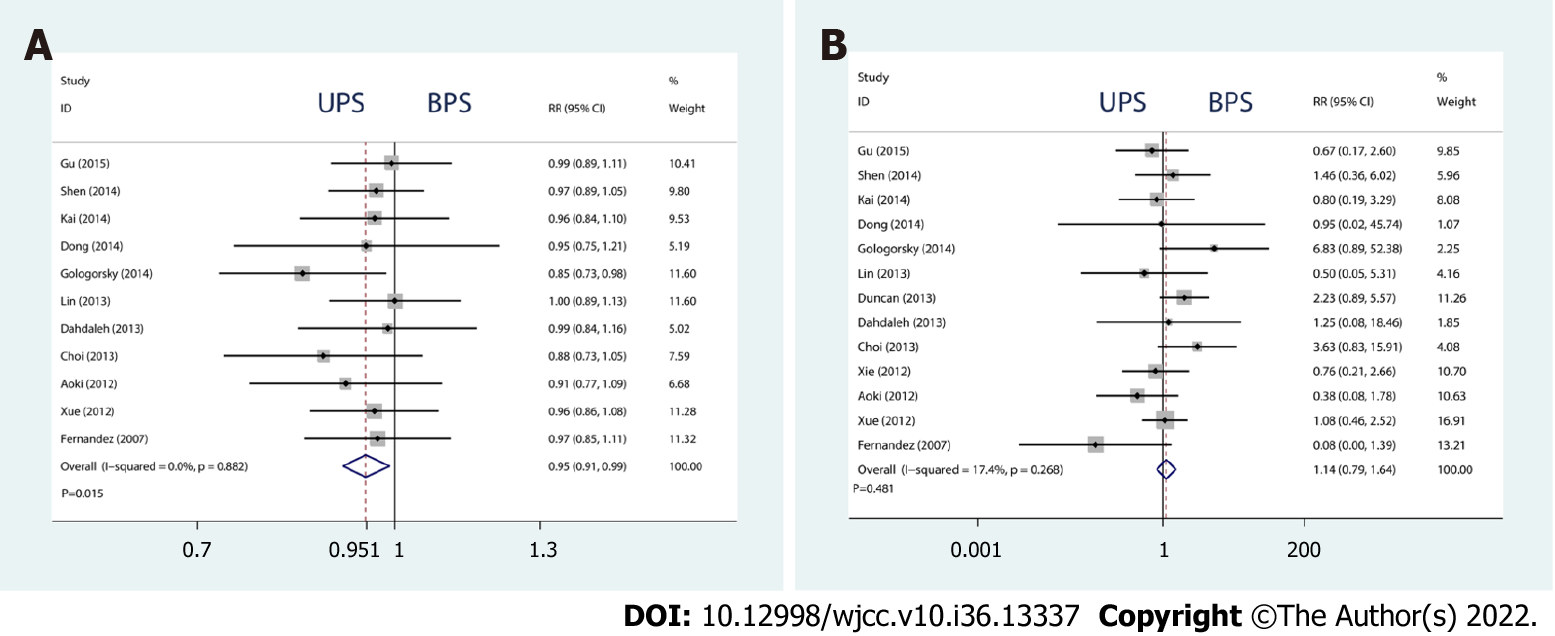
Figure 4 Forest plots of fusion rates and complications.
A: Fusion rates; B: Complications.
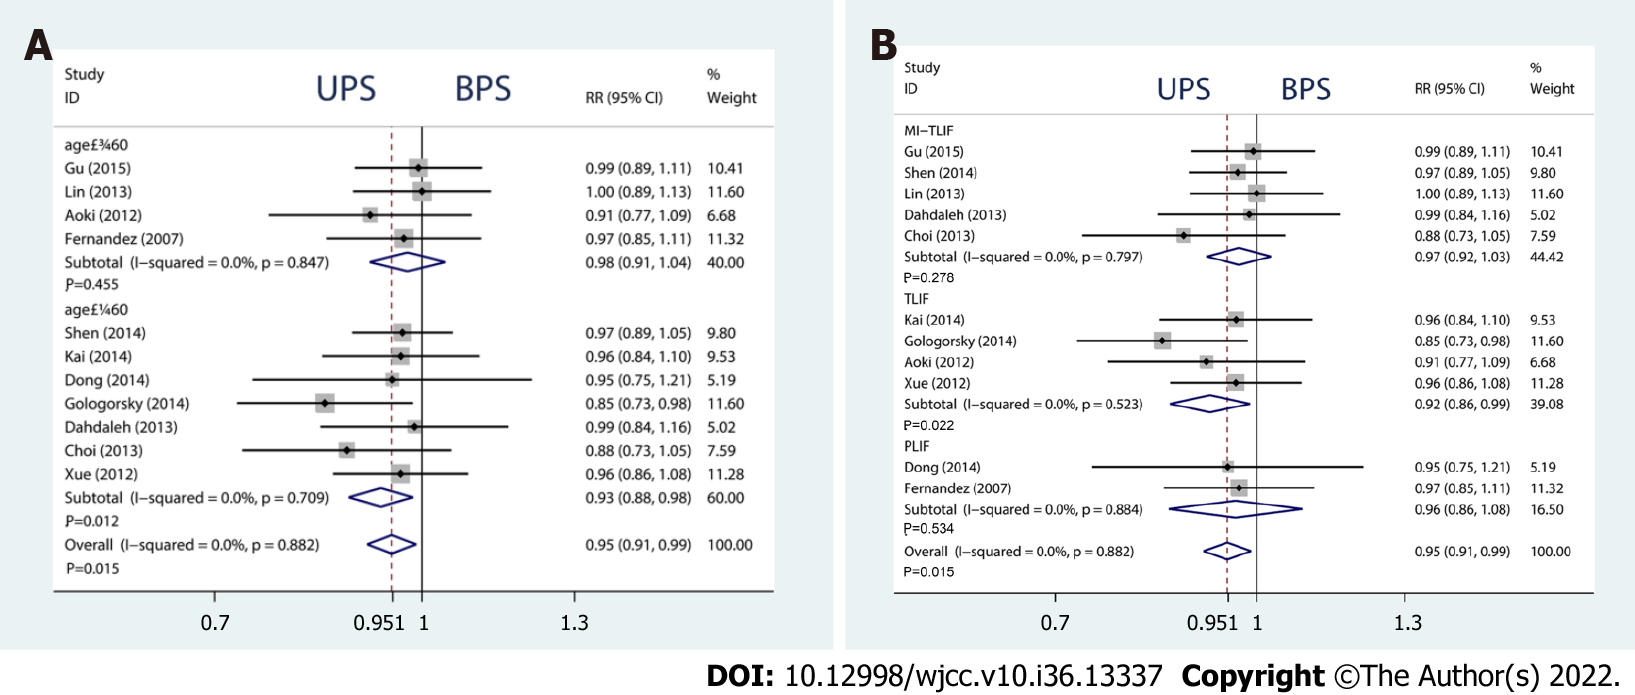
Figure 5 Forest plots of subgroup analysis.
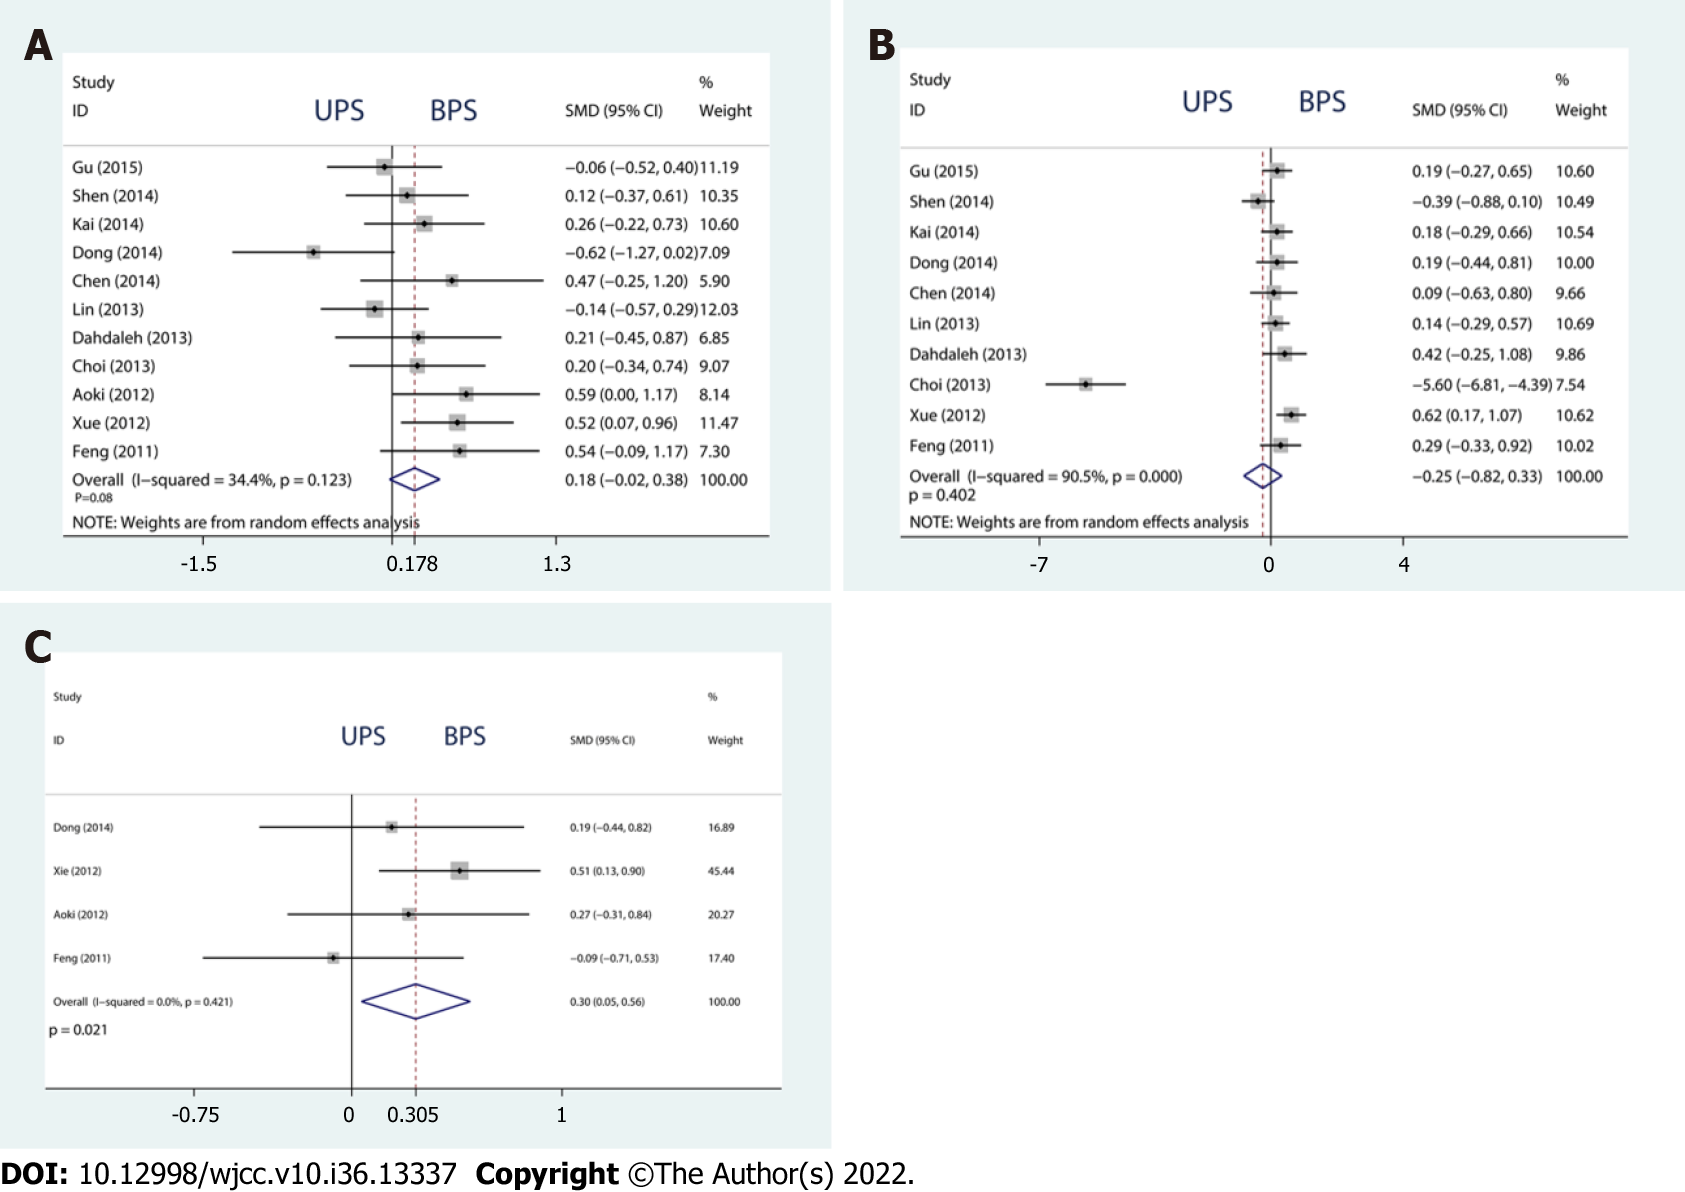
Figure 6 Forest plots of Δ visual analog scale, Δ Oswestry disability index, and Δ Japanese Orthopedic Association.
A: Δ visual analog scale; B: Δ Oswestry disability index; C: Δ Japanese Orthopedic Association.
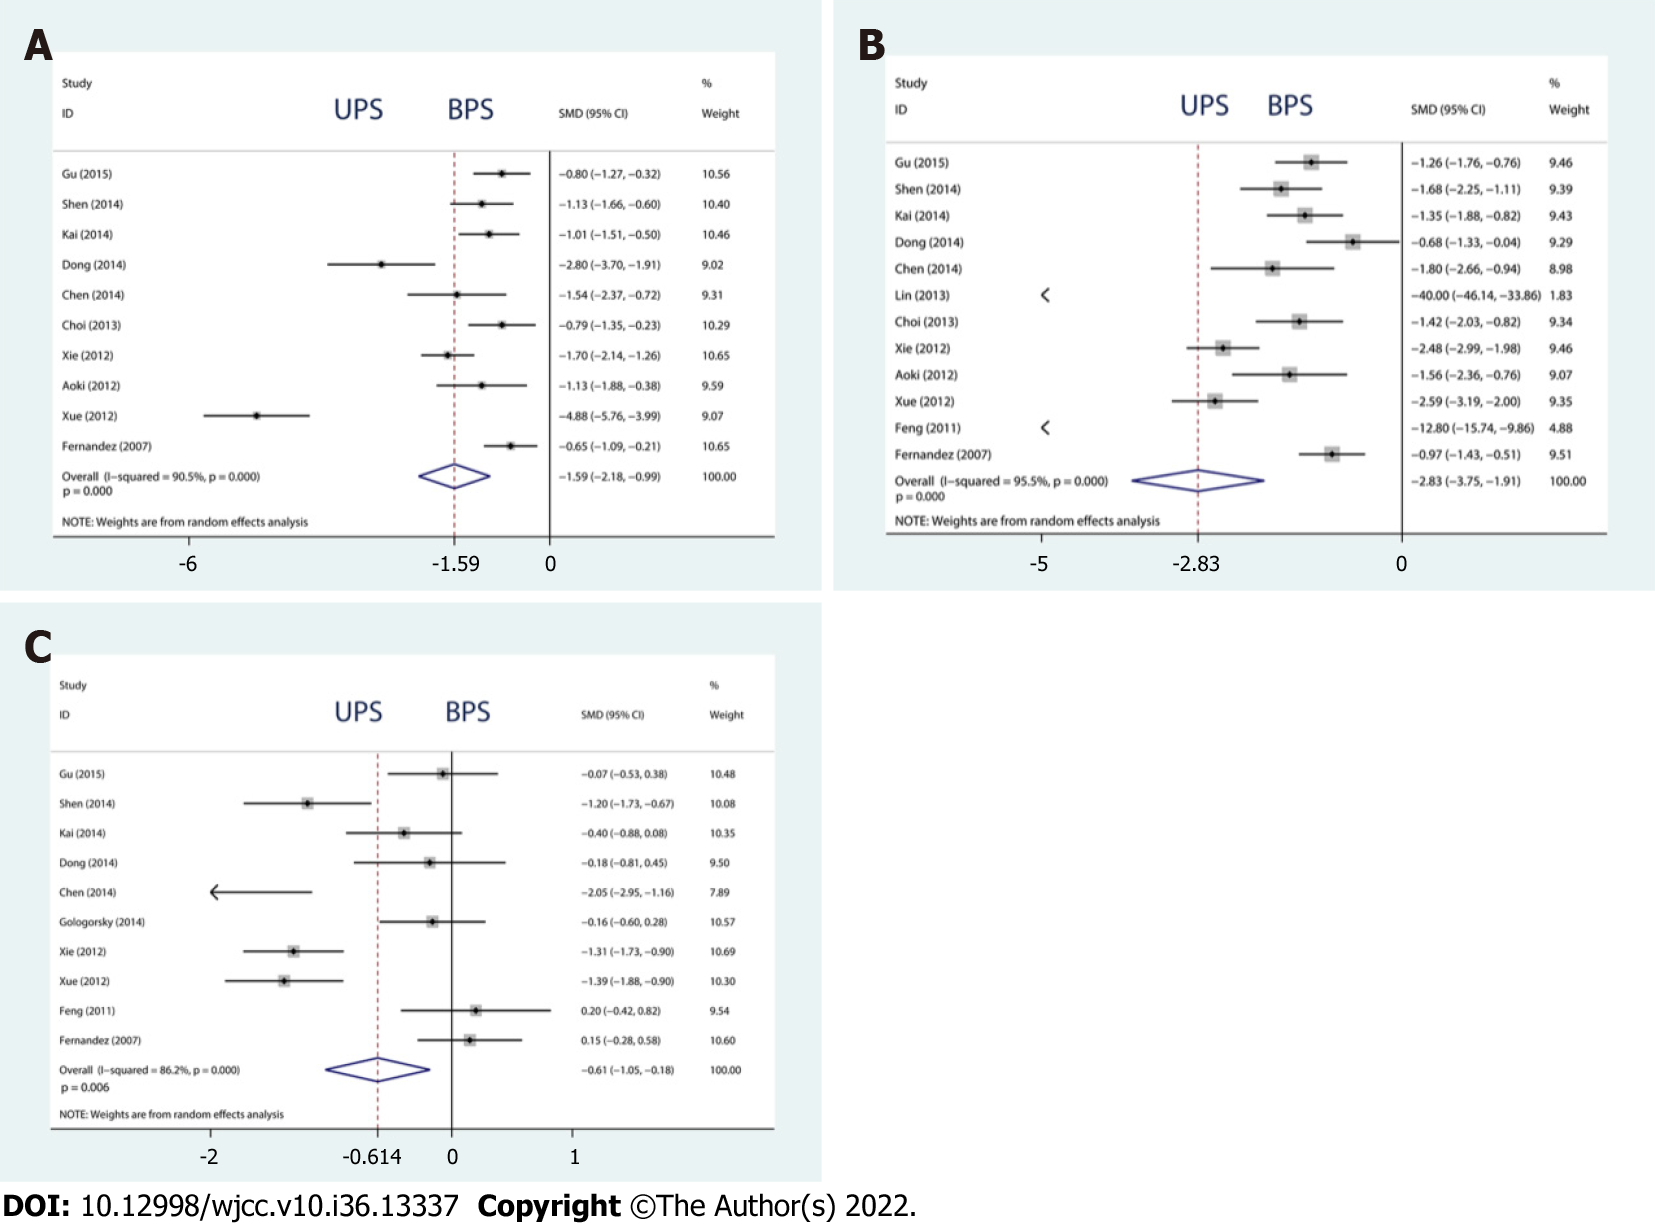
Figure 7 Forest plots of total blood loss, operation time, and length of hospital stay.
A: Total blood loss; B: Operation time; C: Length of hospital stay.
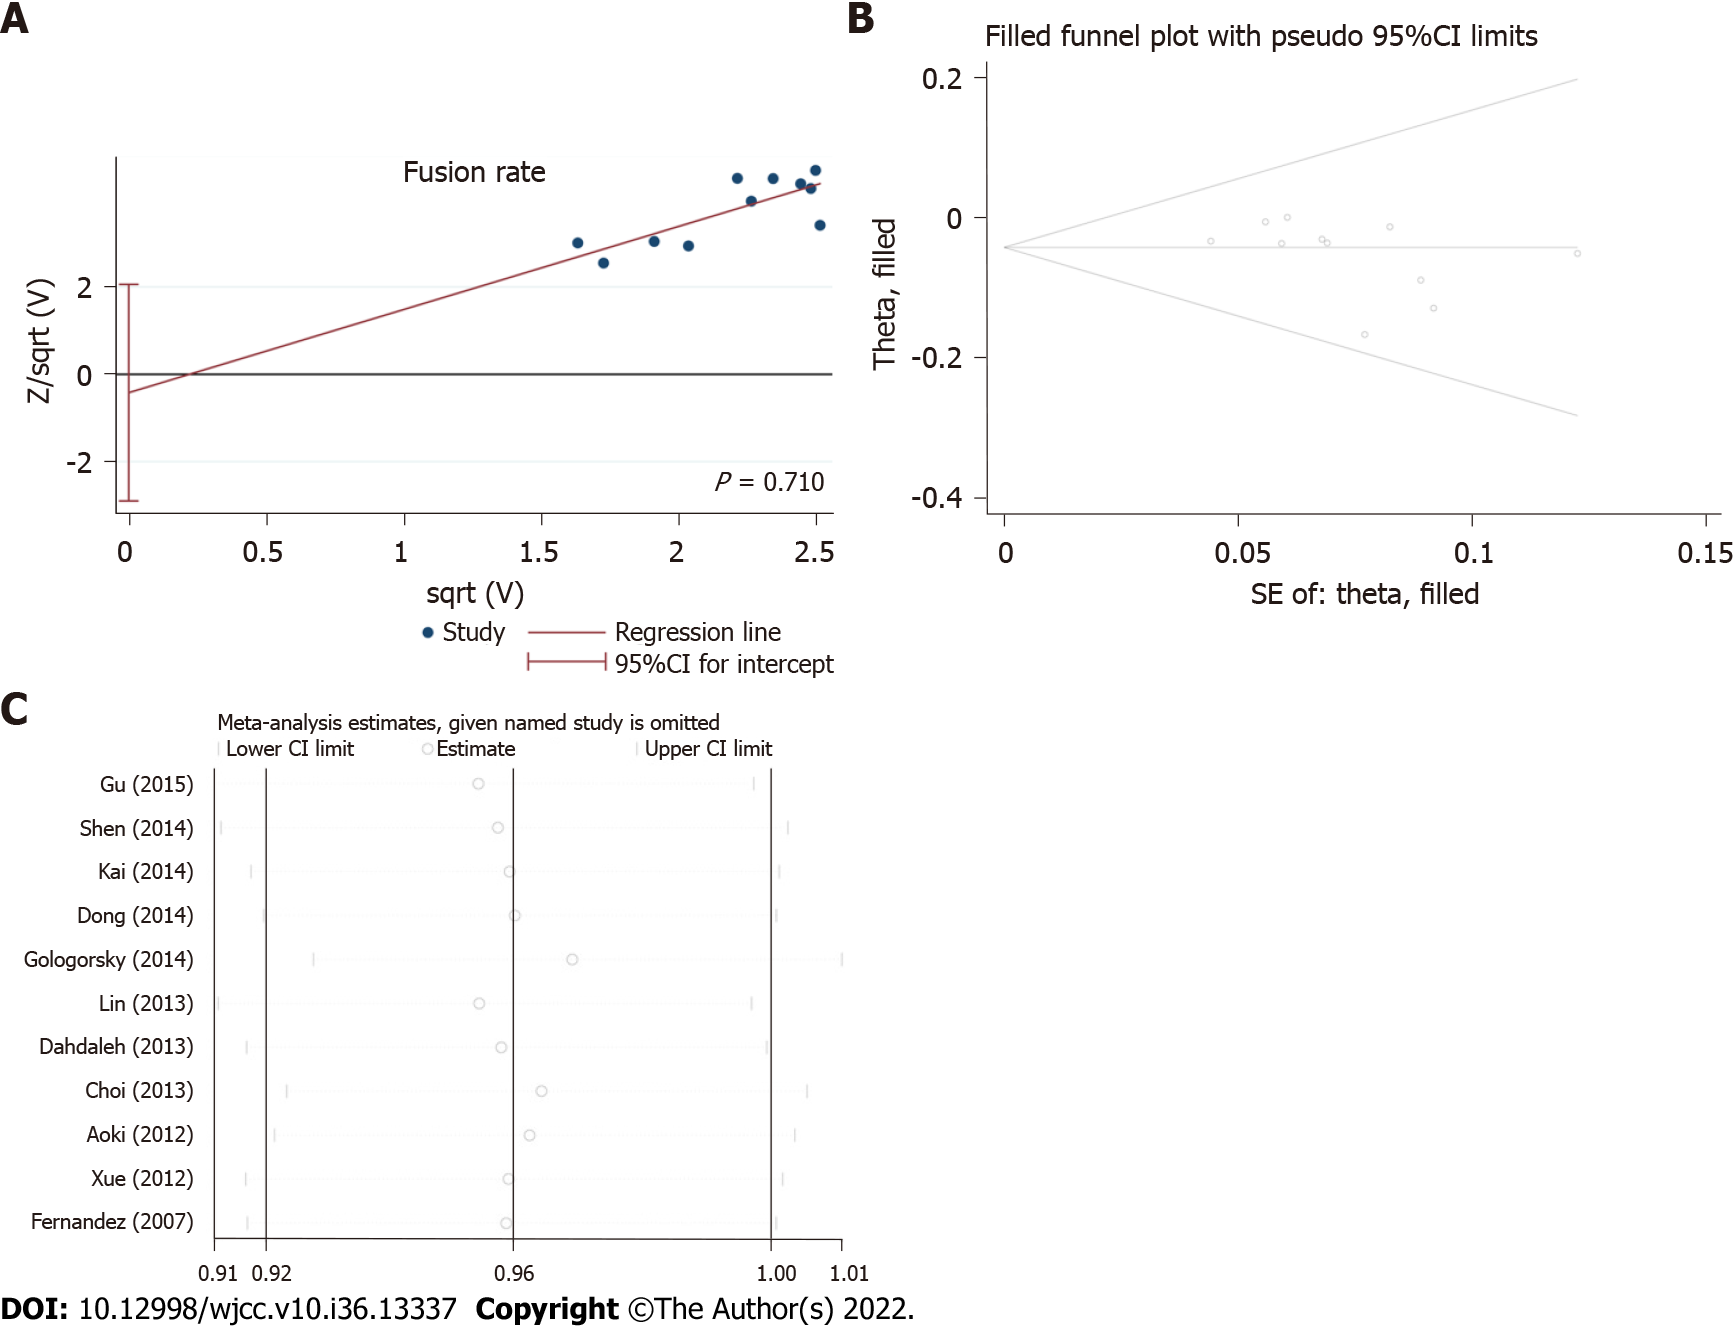
Figure 8 Publication bias, metatrim, and metaninf of fusion rate.
A: Publication bias; B: Metatrim; C: Metaninf.
- Citation: Sun L, Tian AX, Ma JX, Ma XL. Successful outcomes of unilateral vs bilateral pedicle screw fixation for lumbar interbody fusion: A meta-analysis with evidence grading. World J Clin Cases 2022; 10(36): 13337-13348
- URL: https://www.wjgnet.com/2307-8960/full/v10/i36/13337.htm
- DOI: https://dx.doi.org/10.12998/wjcc.v10.i36.13337


