Copyright
©The Author(s) 2022.
World J Clin Cases. Dec 6, 2022; 10(34): 12703-12710
Published online Dec 6, 2022. doi: 10.12998/wjcc.v10.i34.12703
Published online Dec 6, 2022. doi: 10.12998/wjcc.v10.i34.12703
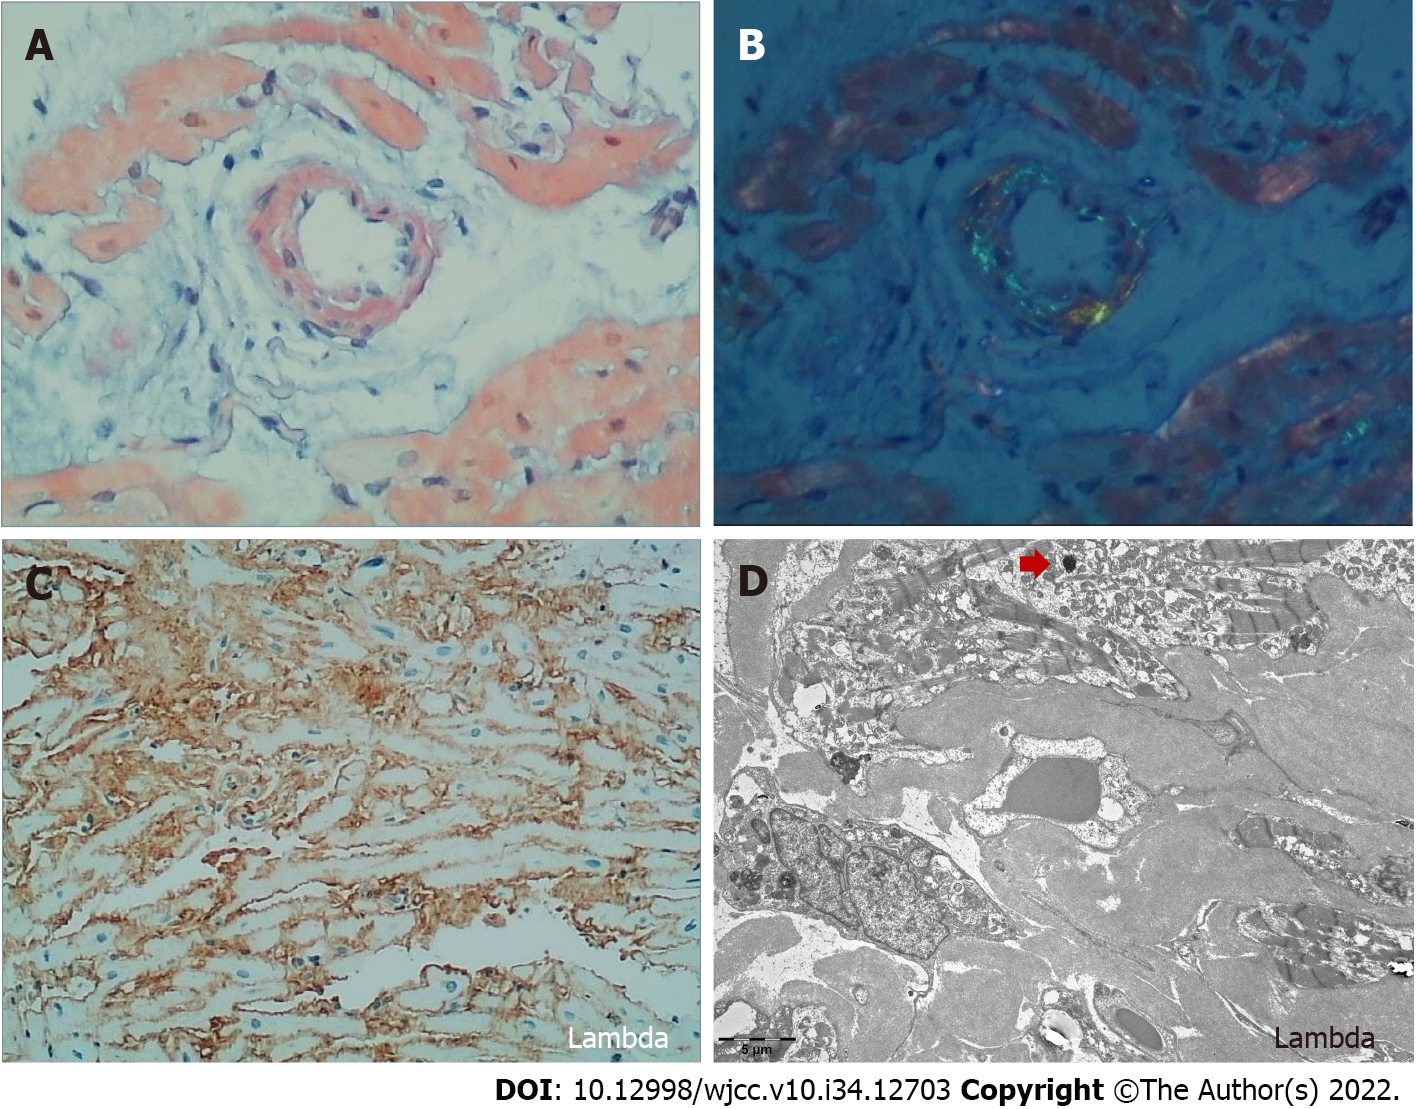
Figure 1 Endomyocardial biopsy.
A: Light microscopy showed amyloid deposits-stained pink to red by Congo red; B: The amyloid showed an apple-green birefringence under polarized light; C: Monoclonal lambda light chains were visualized by immunohistochemistry; D: Electron microscopy showed an 8-12 nm wide fibrillar appearance (400 ×). The red arrow indicates protein colloids in the amyloid fiber.
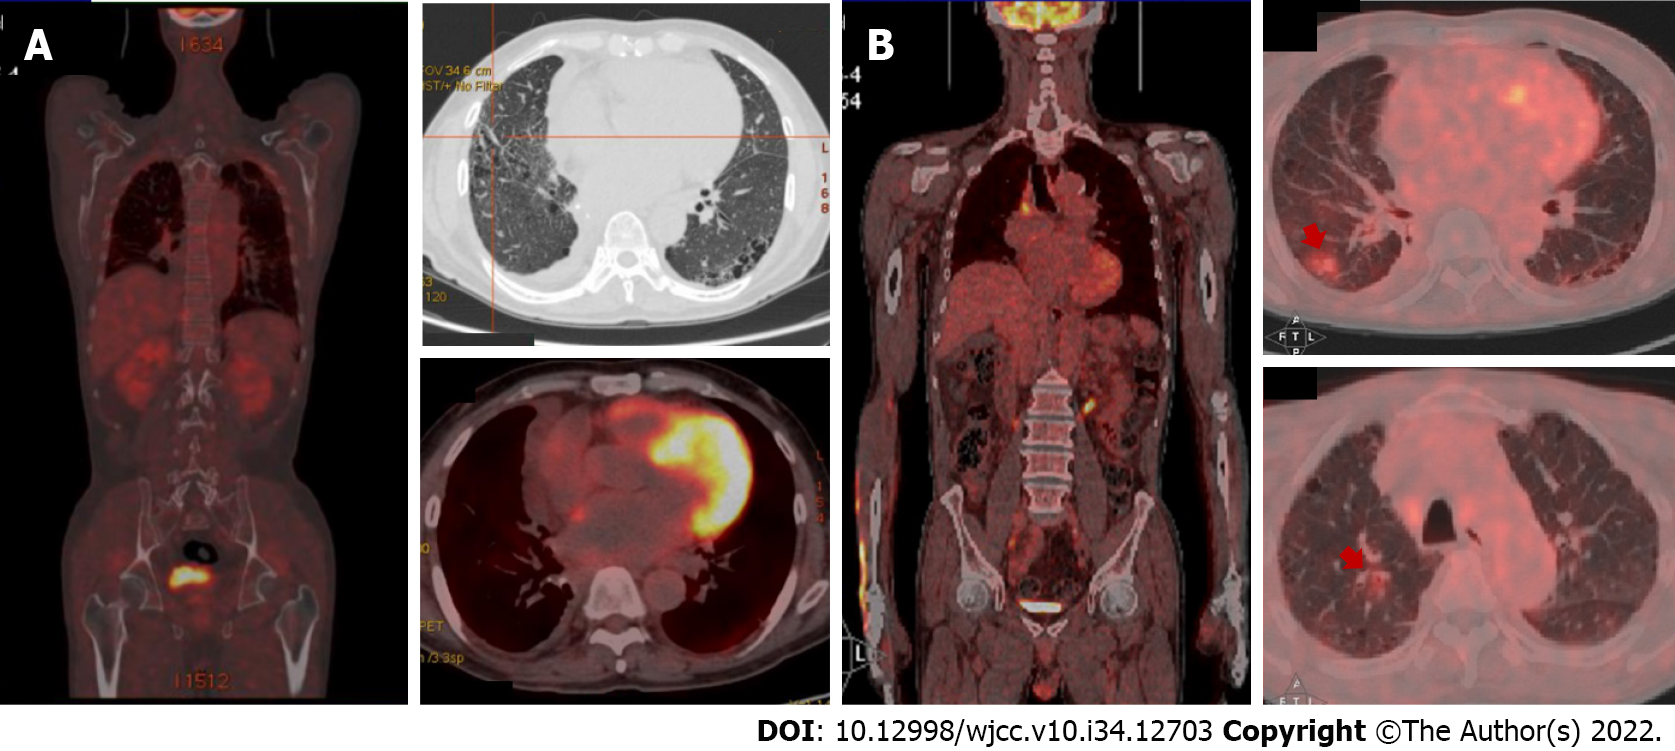
Figure 2 Positron emission tomography/computerized tomography evaluations.
A: Positron emission tomography/computerized tomography (PET/CT) showed no abnormal metabolism lesions at diagnosis; B: PET/CT examination showed significantly positive lesions and confirmed refractory/relapse after first-line therapy. The red arrows indicate increased-fluorodeoxyglucose metabolism lesions.
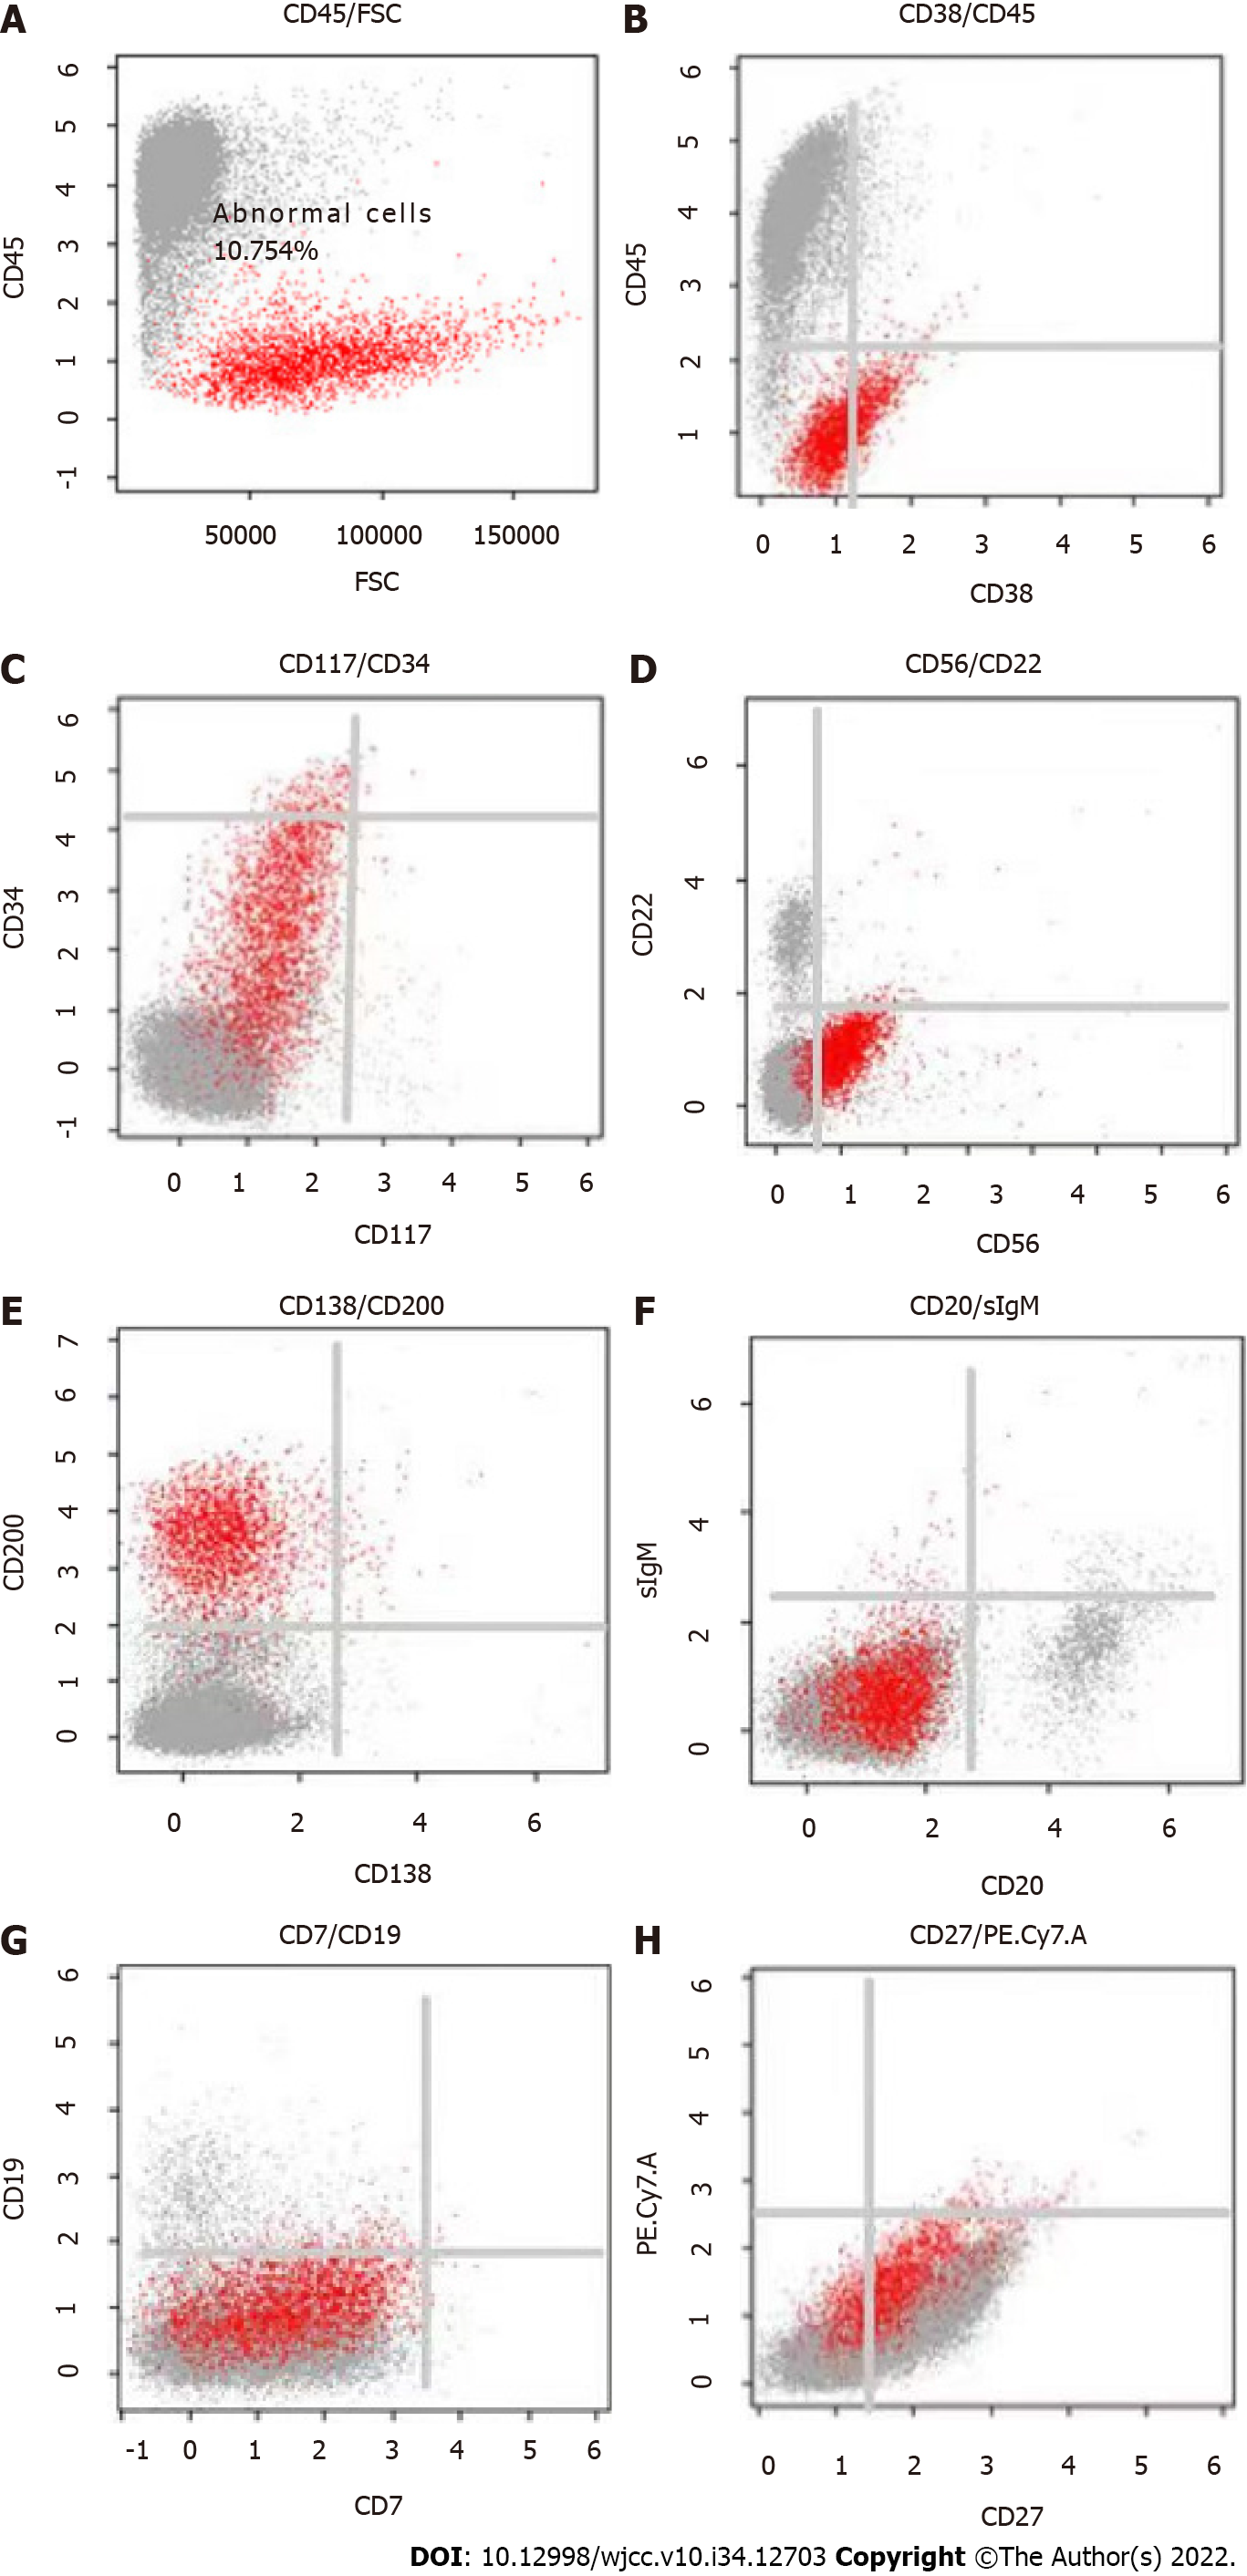
Figure 3 Flow cytometry analysis of a pleural effusion.
A: The result showed abnormal plasma cells accounted for 10.754% (2804/26075) of the nucleated cells; B: These cells were weakly positive for CD38; C: These cells were positive for CD34 and negative for CD117; D: These cells were positive for CD56 and negative for CD22; E: These cells were positive for CD200 and negative for CD138; F: These cells were negative for CD20 and secretory immunoglobulin M; G: These cells were negative for CD19 and CD7; H: These cells were weakly positive for CD27. sIgM: Secretory immunoglobulin M.
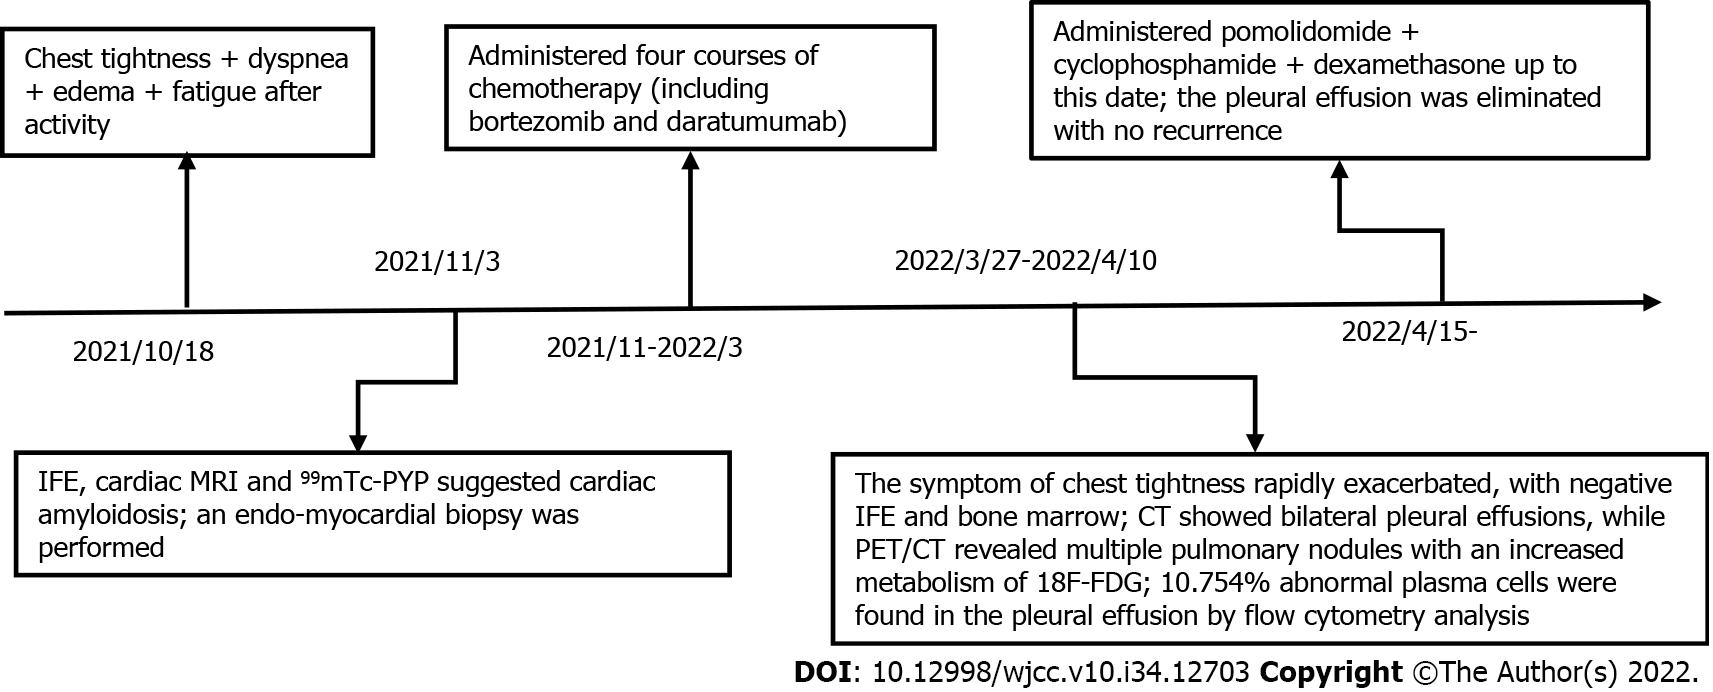
Figure 4 Timeline of reported events.
The most relevant symptoms, diagnostics, and treatment of the patient are presented in chronological order. CT: Computed tomography; IFE: Serum immunofixation; MRI: Magnetic resonance imaging; PET/CT: Positron emission tomography/computerized tomography; 18F-FDG: Fluorodeoxyglucose; 99mTc-PYP: 99Technetium pyrophosphate.
- Citation: Li X, Pan XH, Fang Q, Liang Y. Pomolidomide for relapsed/refractory light chain amyloidosis after resistance to both bortezomib and daratumumab: A case report. World J Clin Cases 2022; 10(34): 12703-12710
- URL: https://www.wjgnet.com/2307-8960/full/v10/i34/12703.htm
- DOI: https://dx.doi.org/10.12998/wjcc.v10.i34.12703


