Copyright
©The Author(s) 2022.
World J Clin Cases. Dec 6, 2022; 10(34): 12648-12653
Published online Dec 6, 2022. doi: 10.12998/wjcc.v10.i34.12648
Published online Dec 6, 2022. doi: 10.12998/wjcc.v10.i34.12648
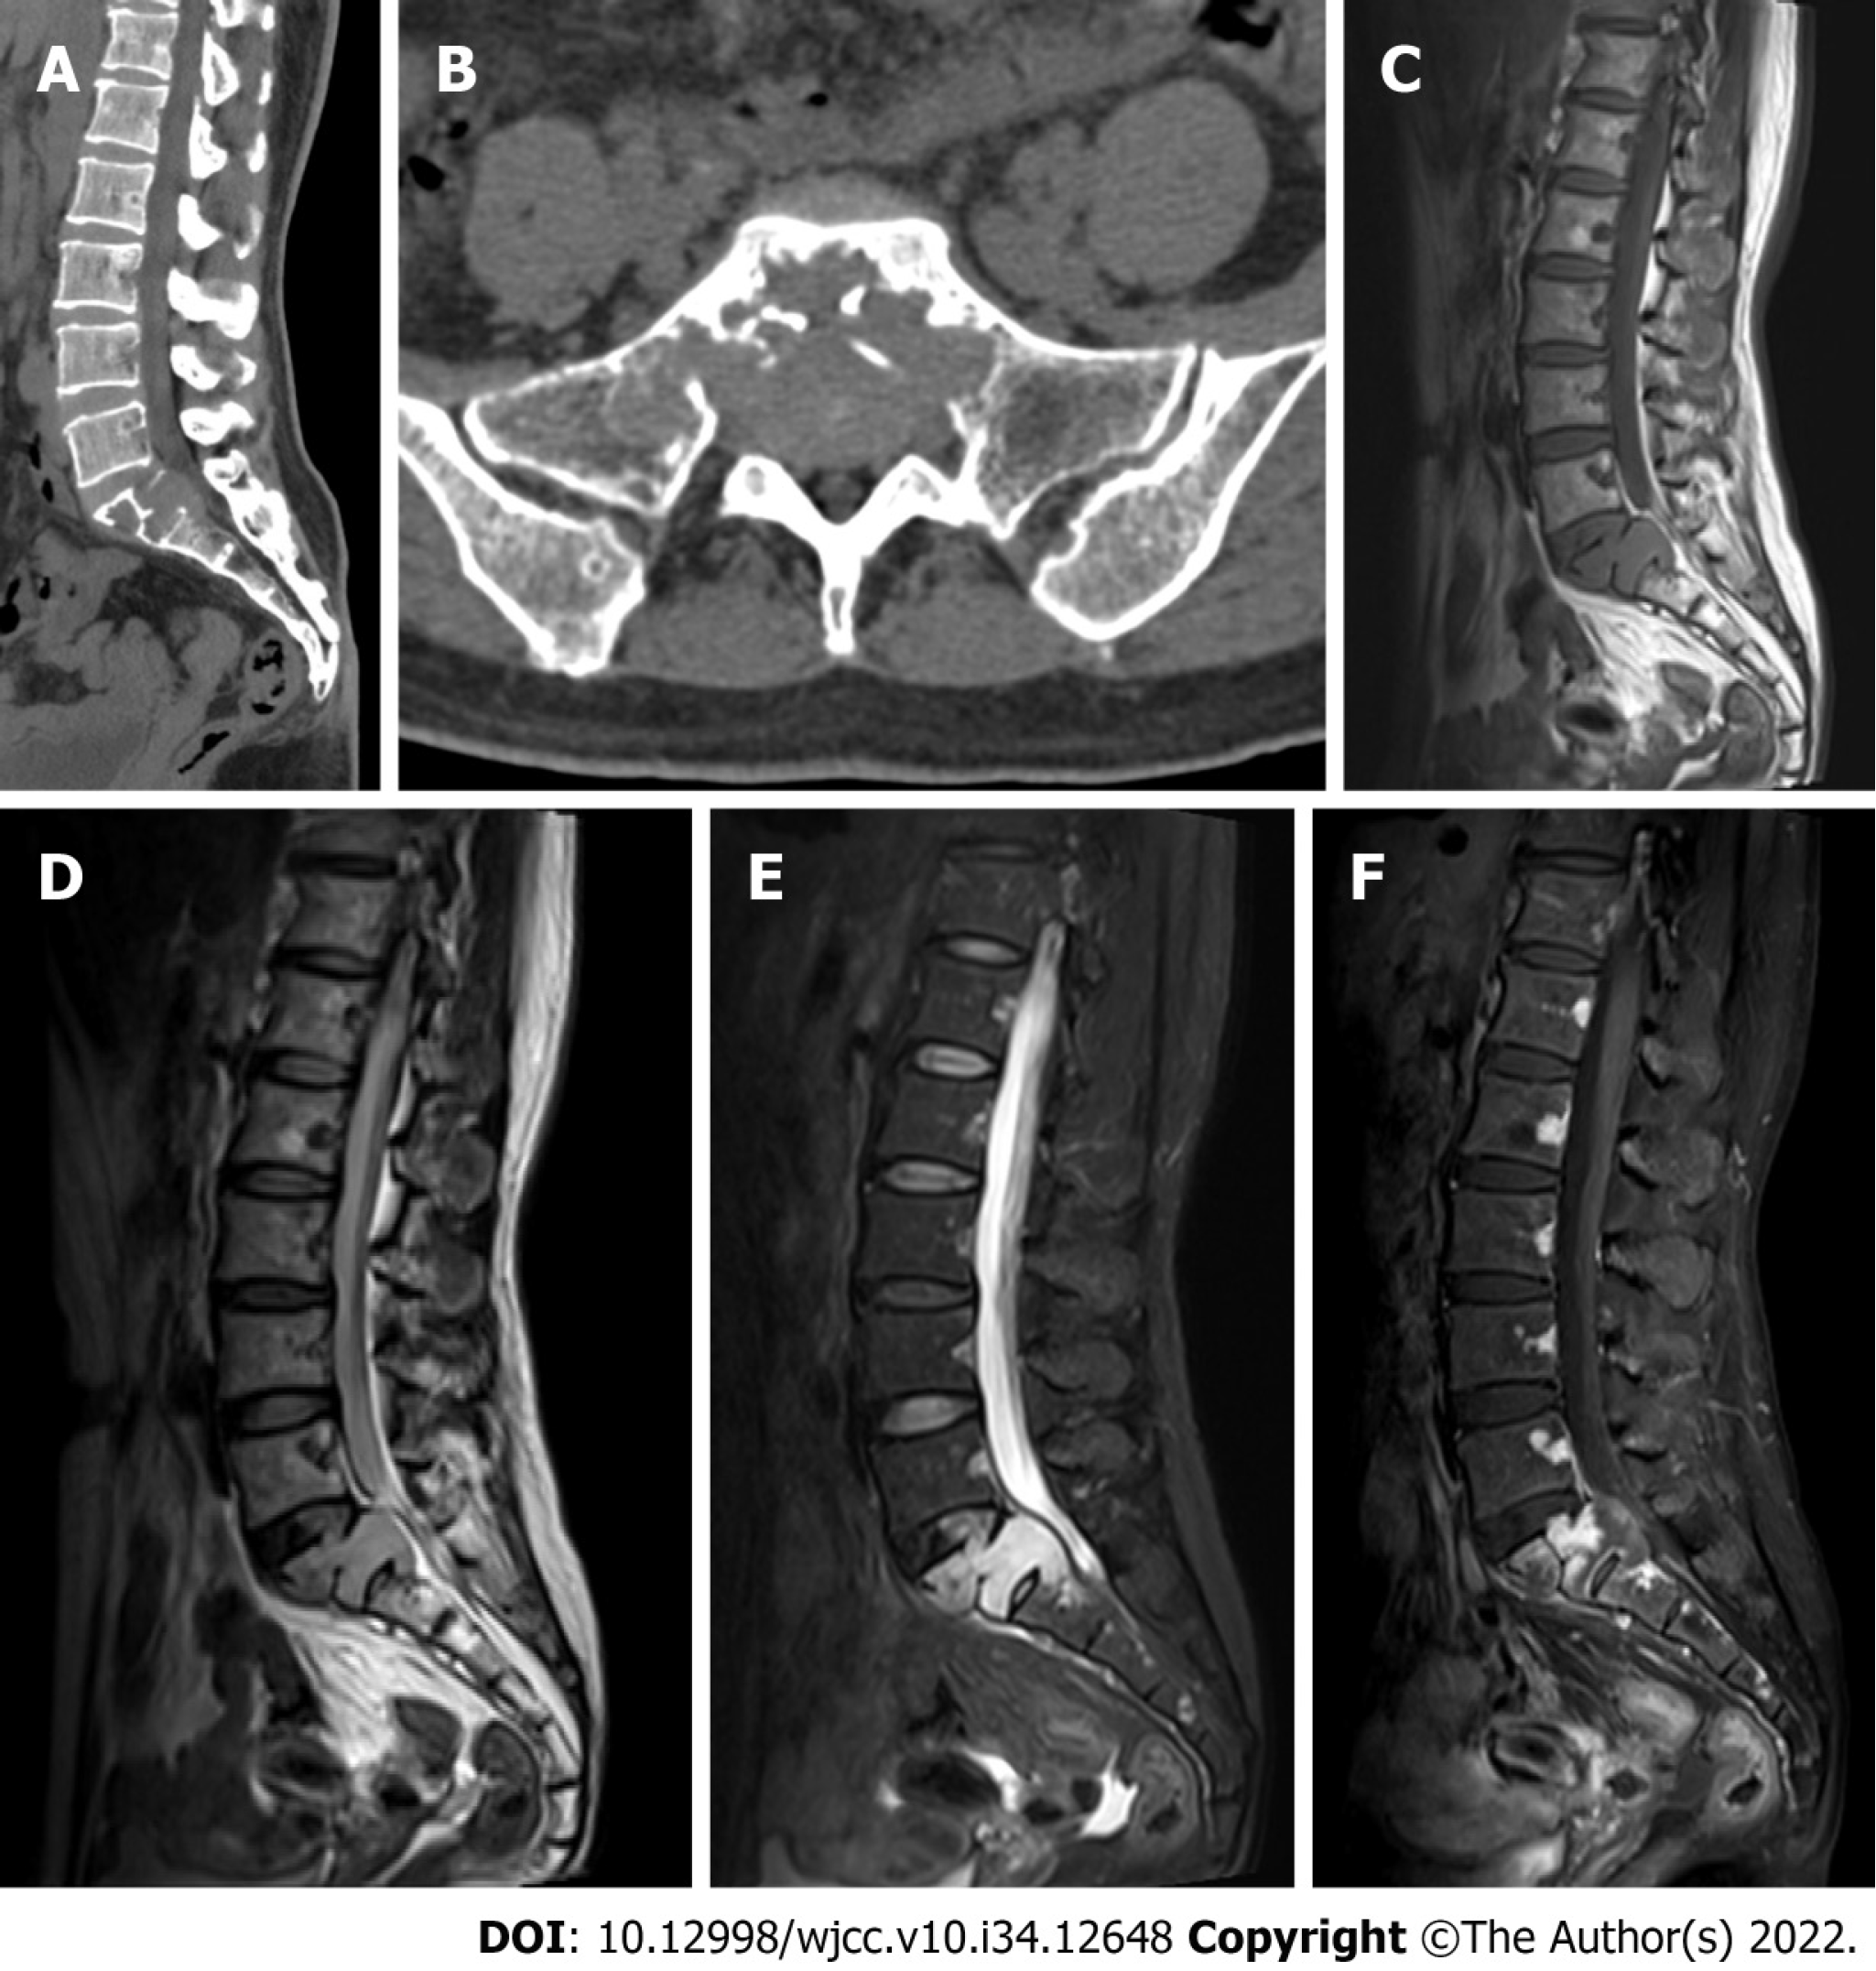
Figure 1 Computed tomography and magnetic resonance imaging.
A and B: Sagittal and axial computed tomography of the lumbosacral spine showed osteolytic bony destruction at S1 and S2 with preservation of the sacral crest; C–F: On sagittal magnetic resonance imaging, the lesion appeared isointense on T1-weighted sequences and heterogeneously hyperintense on T2-weighted and short inversion time inversion recovery sequences. The lesion exhibited heterogeneous contrast enhancement and involved the S1 endplate and S2 vertebral body. A soft tissue mass compressed the thecal sac.
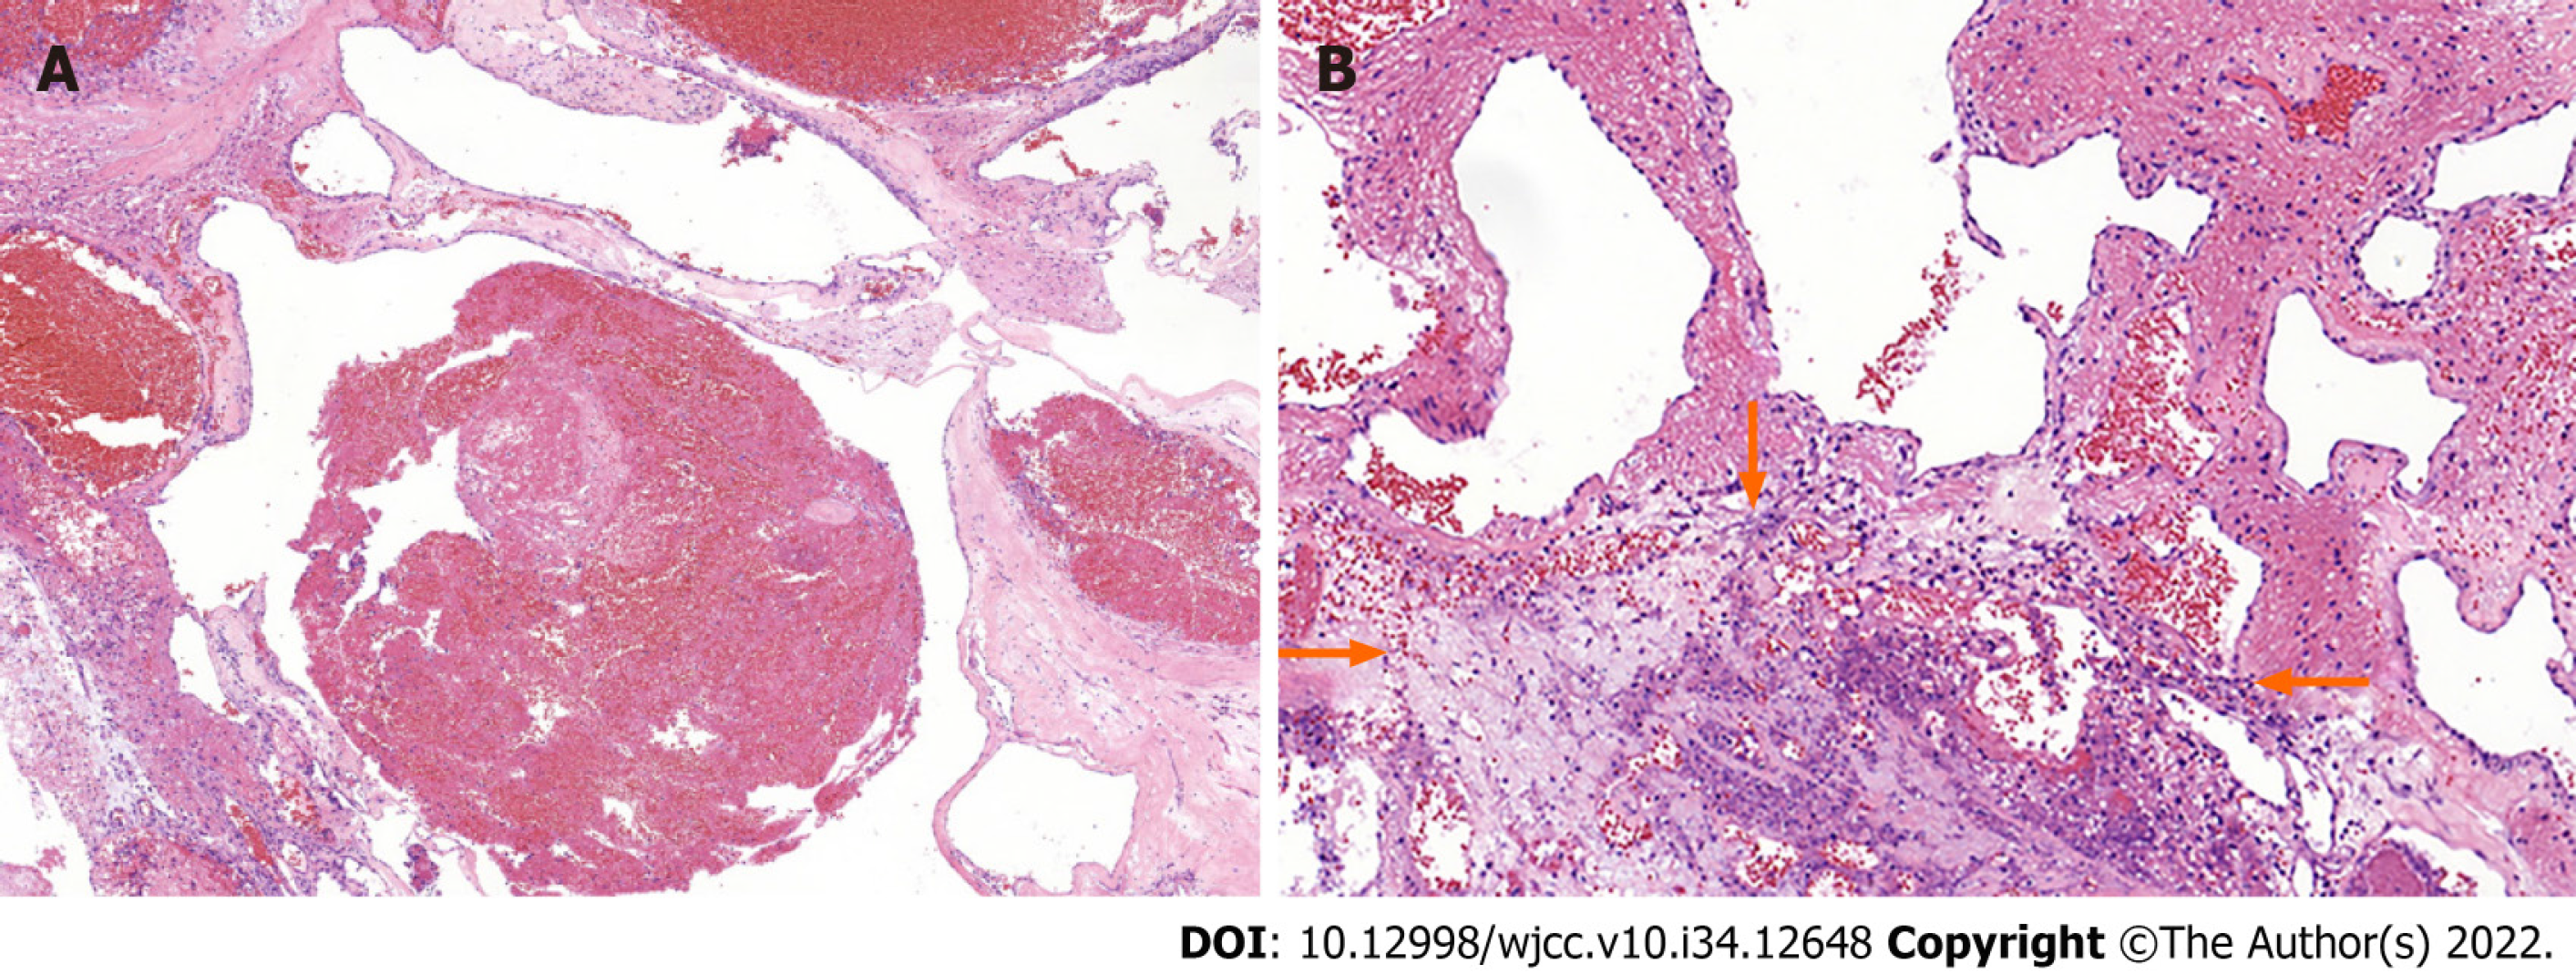
Figure 2 Hematoxylin-eosin staining results (× 200).
The photomicrographs (200 ×) demonstrate blood-filled channels of different diameters with an area of inflammatory necrosis (arrows).
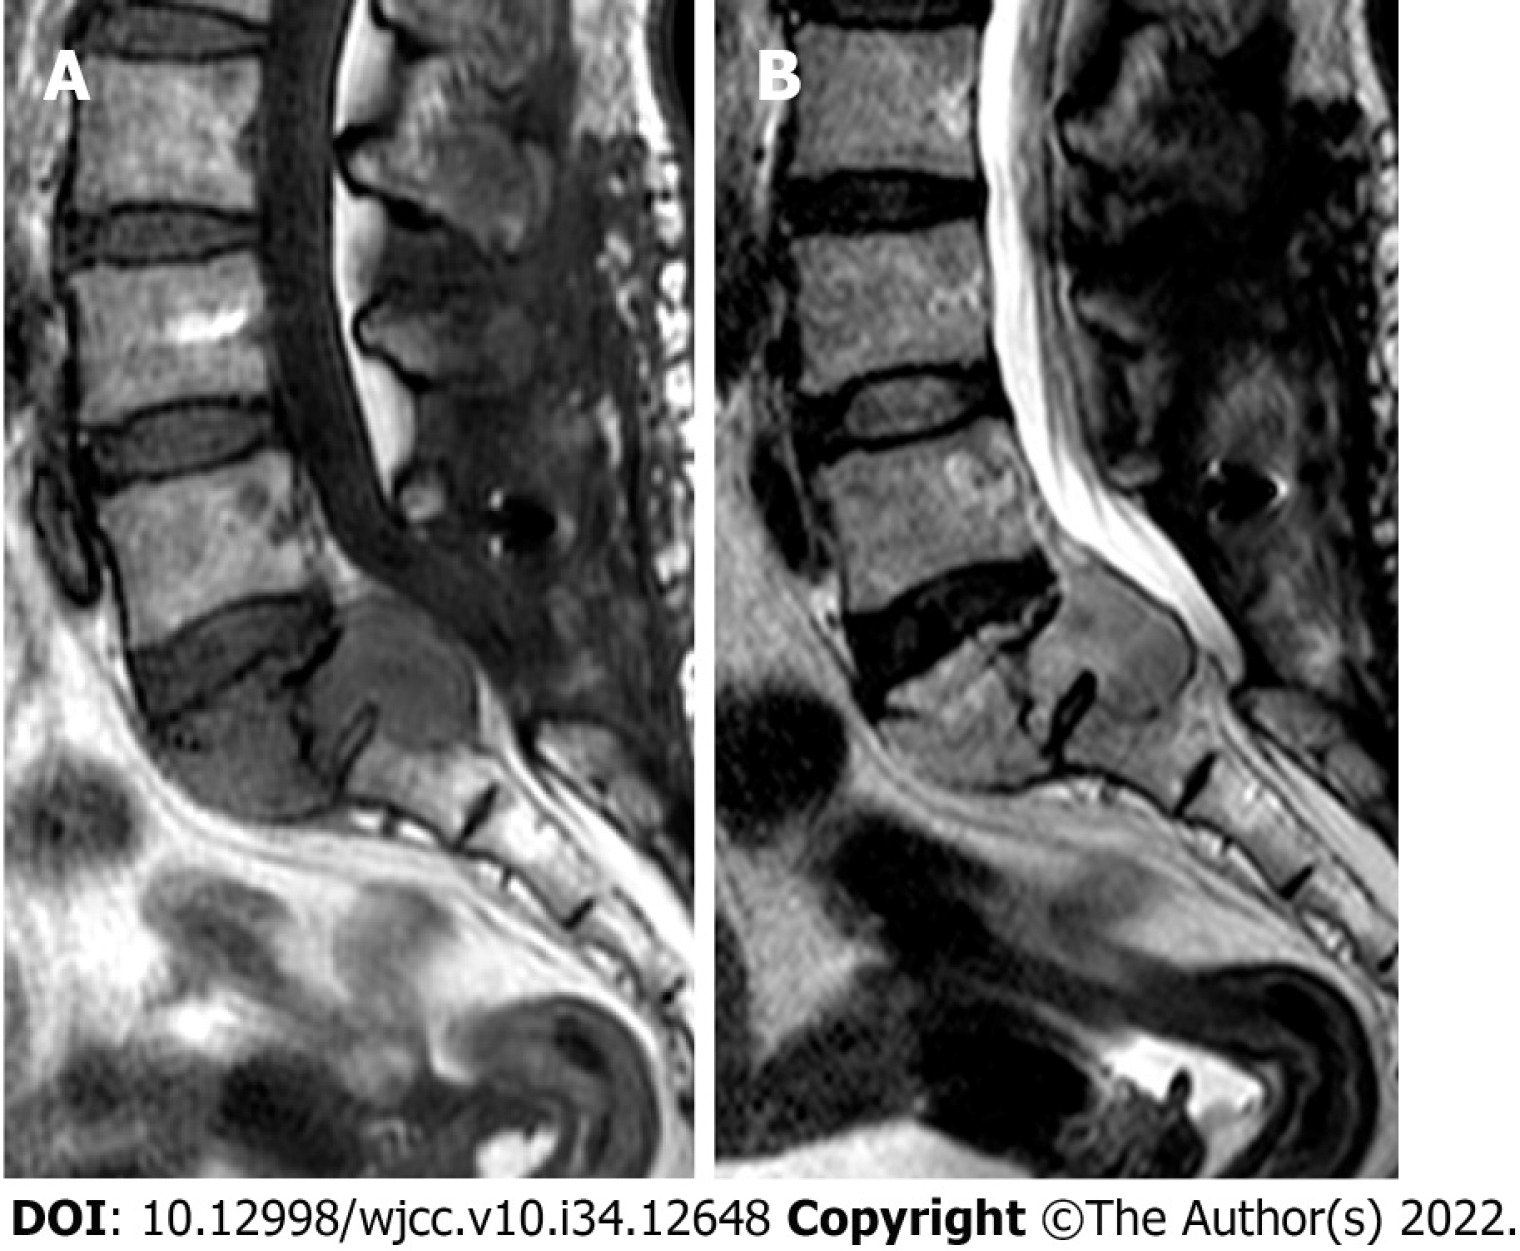
Figure 3 Follow-up magnetic resonance imaging.
Sagittal magnetic resonance imaging 6 mo after surgery showed an enlarged sacral mass and thecal sac compression.
- Citation: Wang GX, Chen YQ, Wang Y, Gao CP. Atypical aggressive vertebral hemangioma of the sacrum with postoperative recurrence: A case report. World J Clin Cases 2022; 10(34): 12648-12653
- URL: https://www.wjgnet.com/2307-8960/full/v10/i34/12648.htm
- DOI: https://dx.doi.org/10.12998/wjcc.v10.i34.12648


