Copyright
©The Author(s) 2022.
World J Clin Cases. Dec 6, 2022; 10(34): 12637-12647
Published online Dec 6, 2022. doi: 10.12998/wjcc.v10.i34.12637
Published online Dec 6, 2022. doi: 10.12998/wjcc.v10.i34.12637
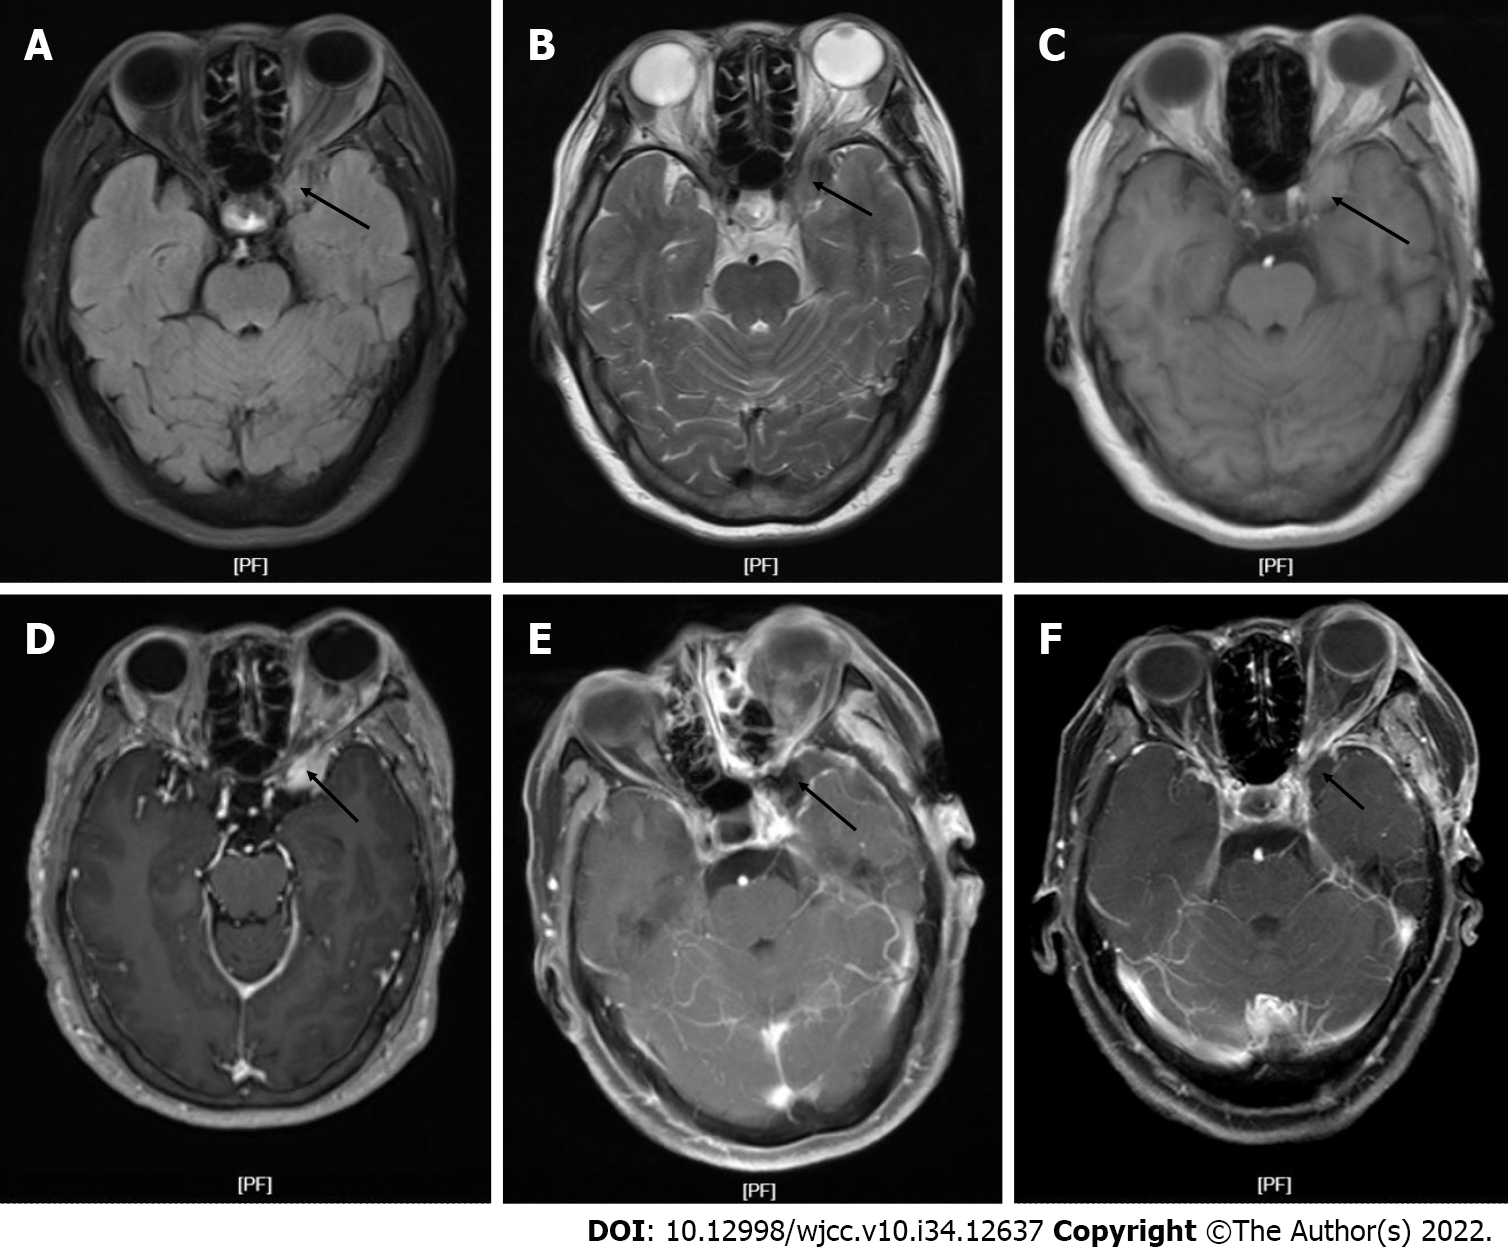
Figure 1 Magnetic resonance imaging.
A: T1-weighted magnetic resonance imaging (MRI) image before the operation showed the left anterior fossa floor occupation (arrow); B: T2-weighted MRI before surgery showed the left anterior fossa floor occupation (arrow); C: MRI fluid attenuated inversion recovery sequence before operation showed the left anterior fossa floor occupation (arrow); D: Preoperative MRI enhancement sequence showed the left anterior fossa floor occupation (arrow); E: One week after the operation, the MRI enhanced sequence showed the left anterior fossa base occupation (arrow); F: Three months after surgery, MRI enhanced sequence showed the left anterior fossa floor occupation (arrow).
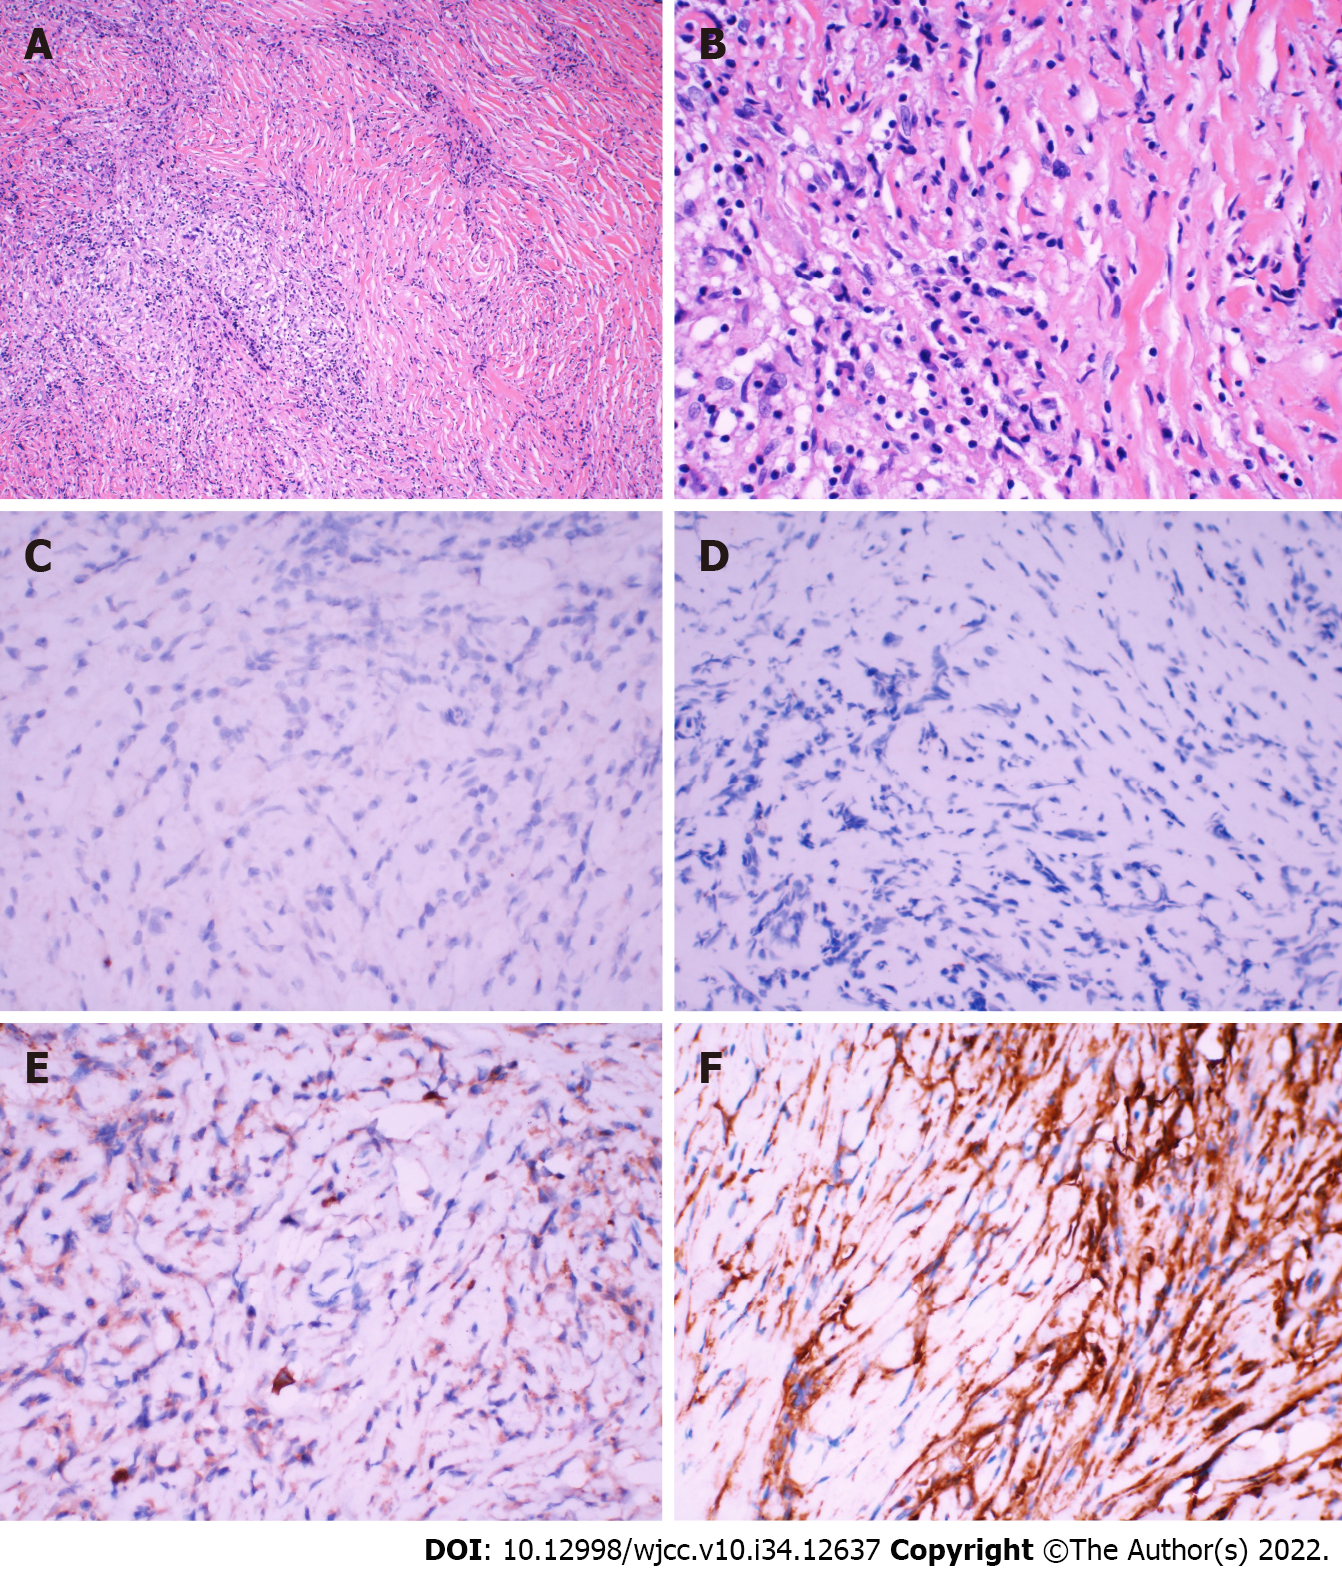
Figure 2 Pathological section.
A: Magnification of hematoxylin-eosin staining pathological section (× 100); B: Magnification of hematoxylin-eosin staining pathological section (× 400); C: Immunohistochemical anaplastic lymphoma kinase of tumor pathological section (magnification × 400); D: Immunohistochemical exponential moving average of tumor pathological section (magnification × 400); E: Tumor pathological section immunohistochemical immunoglobulin G4 (magnification × 400); F: Immunohistochemical vimentin of tumor pathological section (magnification × 400).
- Citation: Su ZJ, Guo ZS, Wan HT, Hong XY. Inflammatory myofibroblastic tumor of the central nervous system: A case report. World J Clin Cases 2022; 10(34): 12637-12647
- URL: https://www.wjgnet.com/2307-8960/full/v10/i34/12637.htm
- DOI: https://dx.doi.org/10.12998/wjcc.v10.i34.12637


