Copyright
©The Author(s) 2022.
World J Clin Cases. Dec 6, 2022; 10(34): 12578-12586
Published online Dec 6, 2022. doi: 10.12998/wjcc.v10.i34.12578
Published online Dec 6, 2022. doi: 10.12998/wjcc.v10.i34.12578
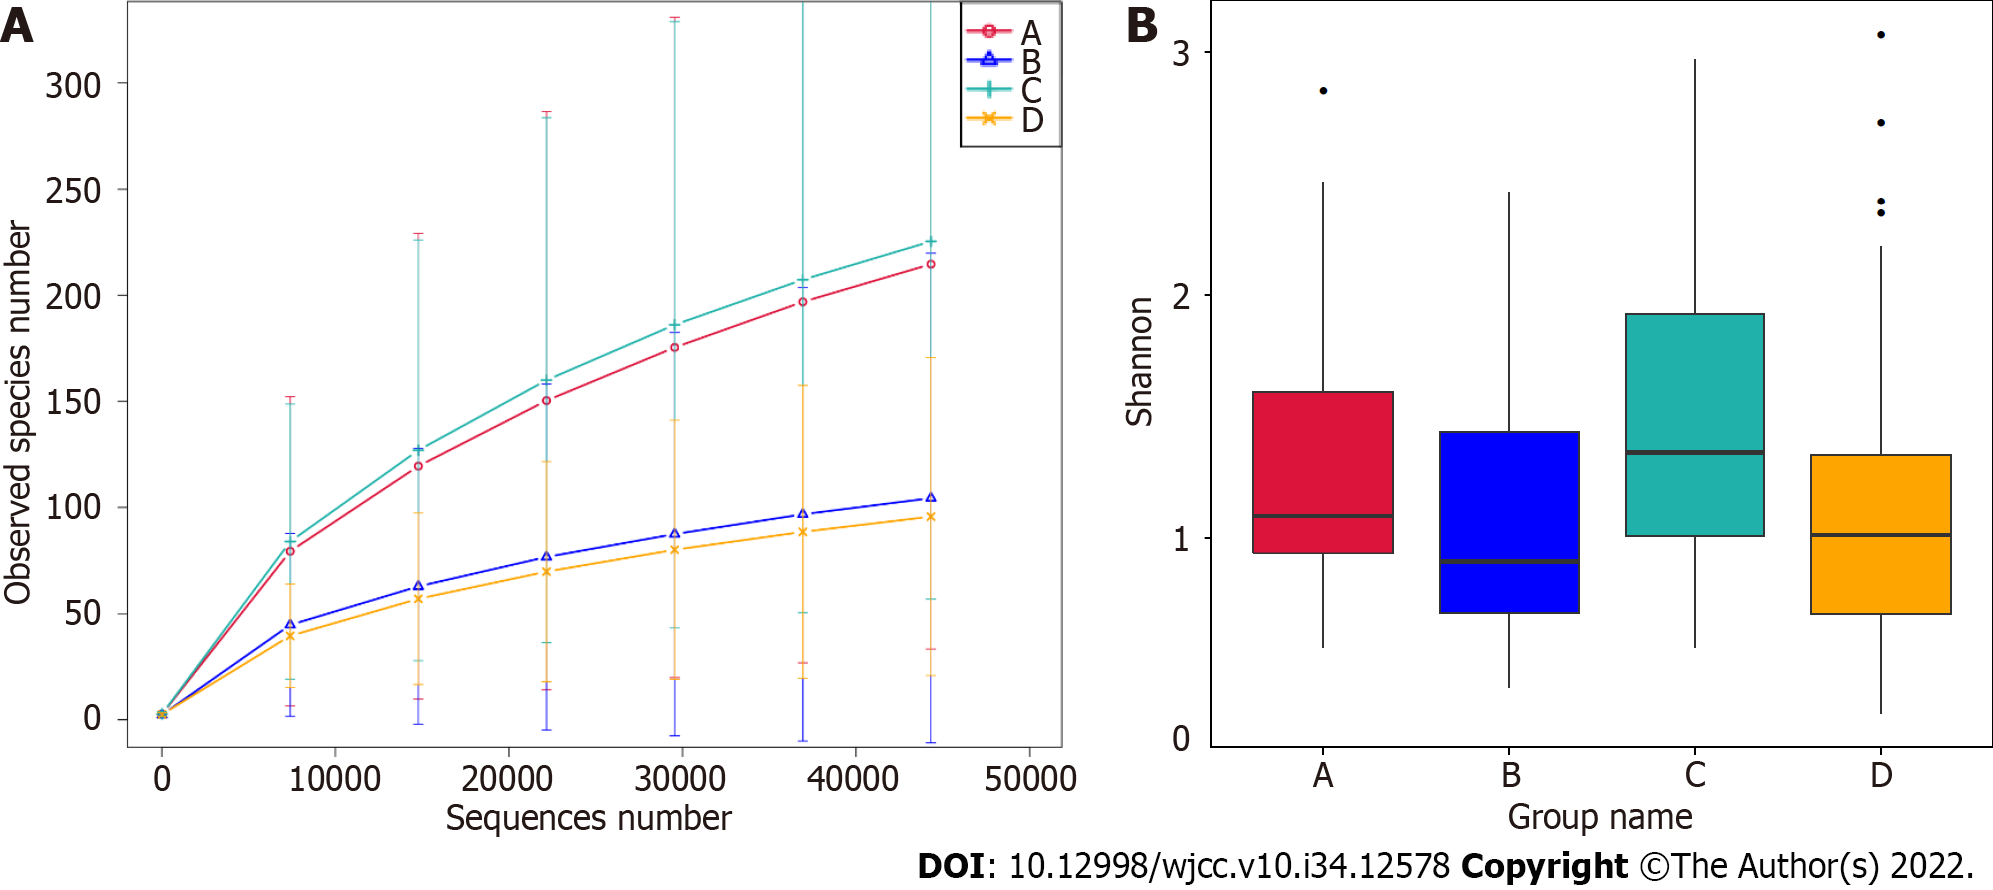
Figure 1 Alpha diversity analysis.
A: Rarefaction curves of observed species of the four groups in the 16S rRNA gene amplicon sequencing are shown; B: The Shannon index was assessed using alpha diversity analysis of the four groups in the 16S rRNA gene amplicon sequencing, Wilcoxon rank-sum test, P > 0.05.
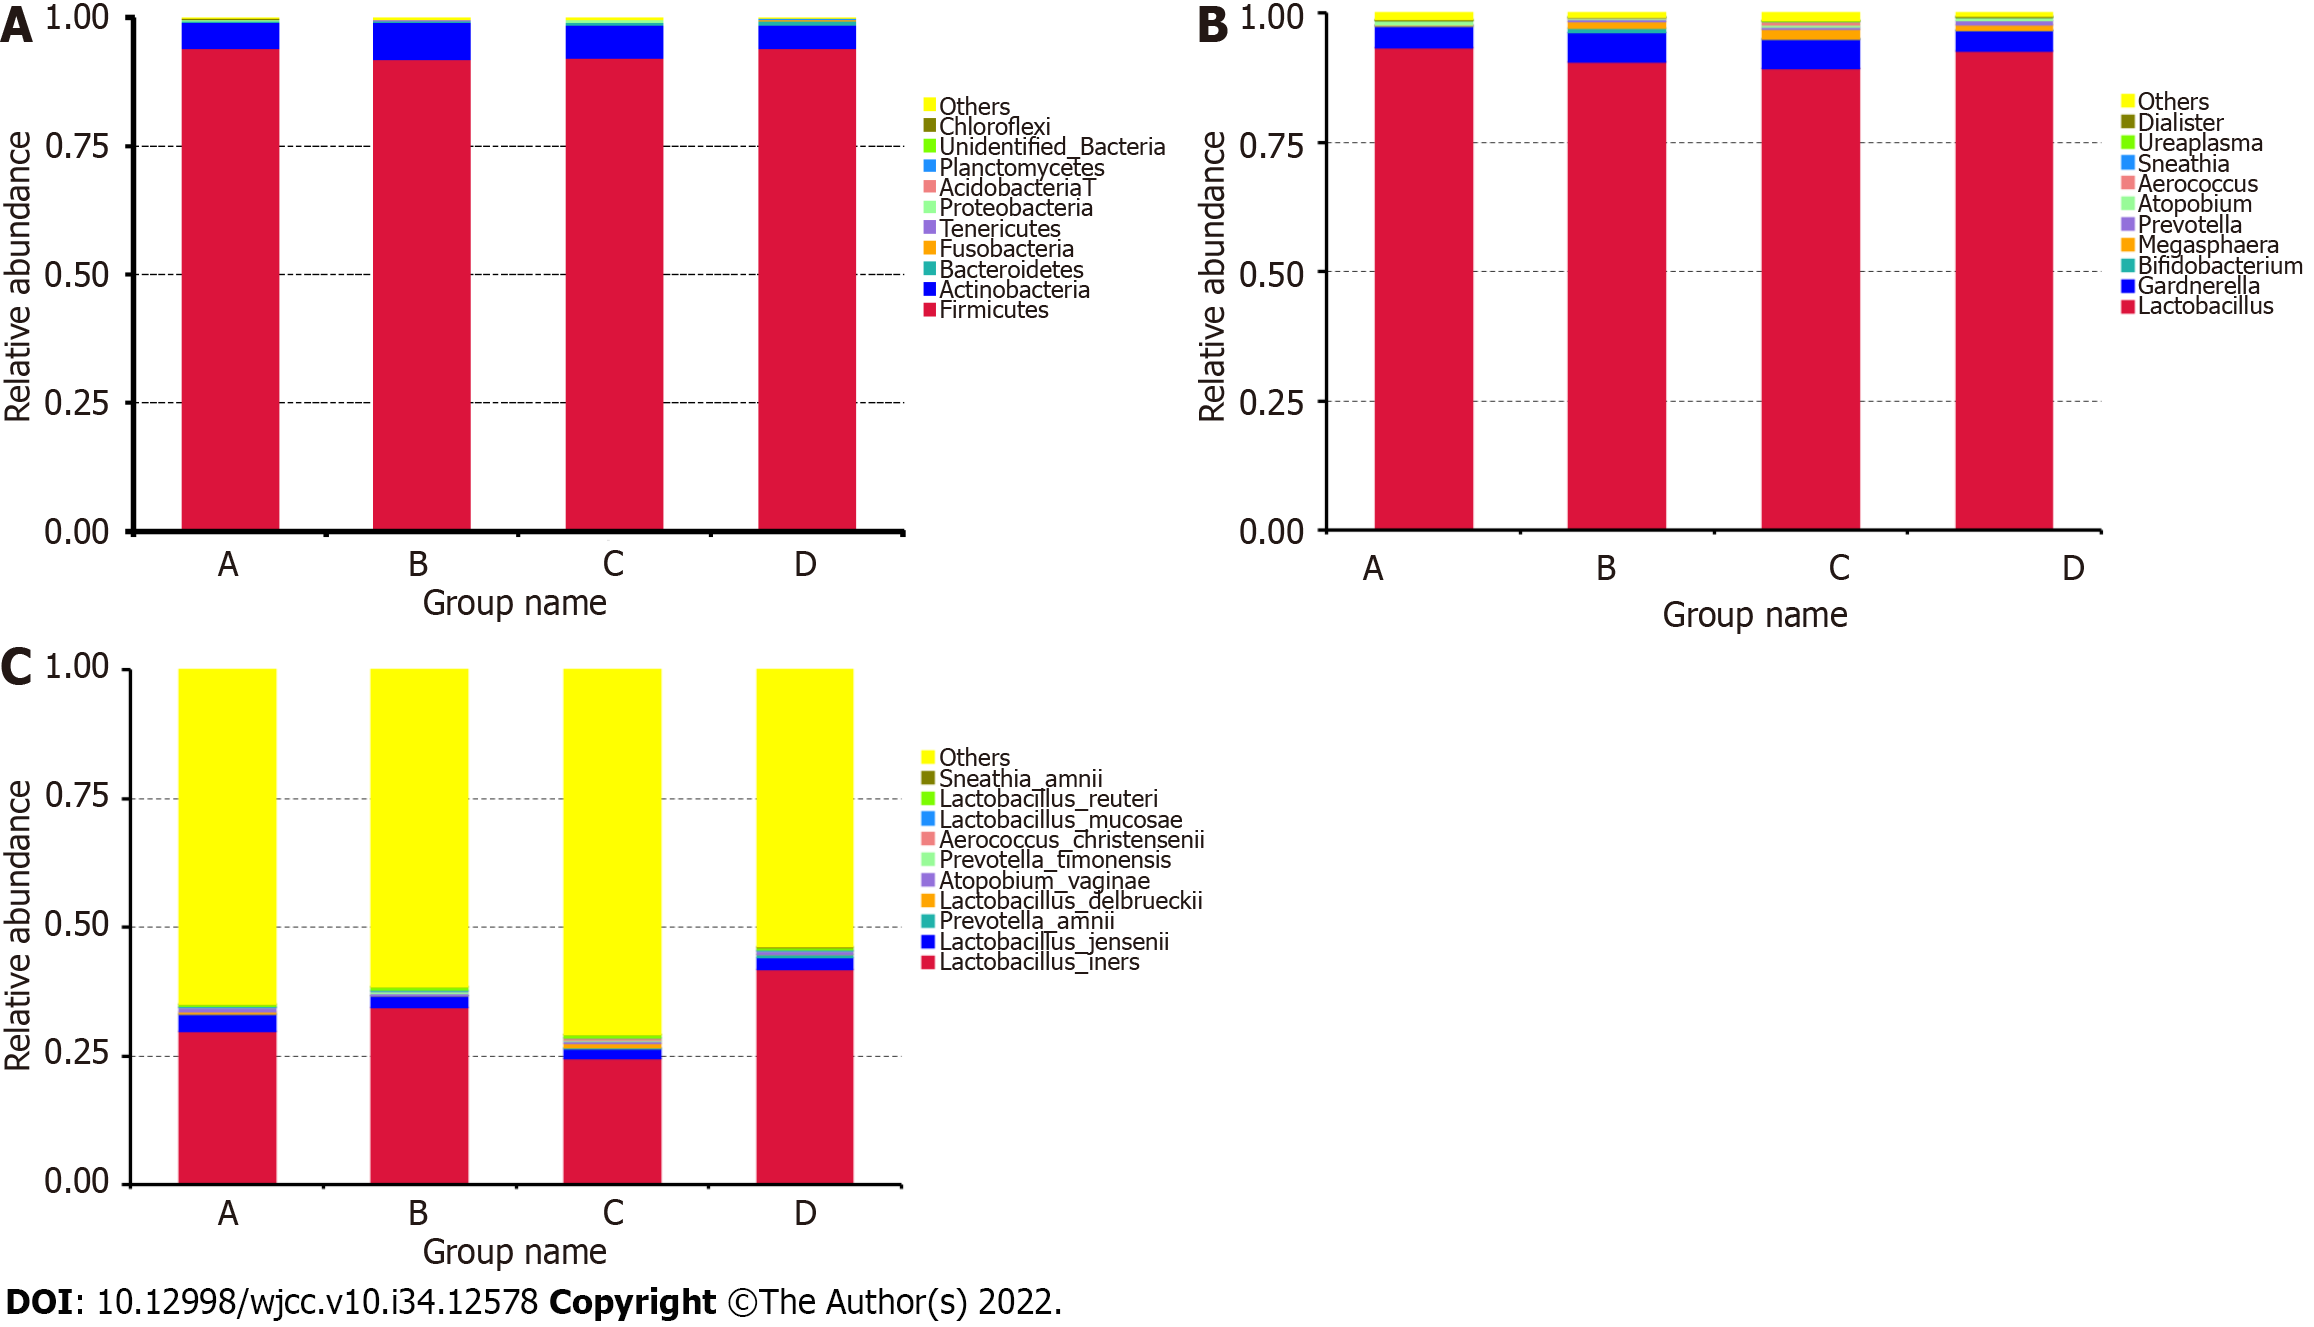
Figure 2 Comparison of relative taxa abundance.
A-C: The taxa abundance was compared among the four groups at the phylum (A), genus (B), and species (C) levels.
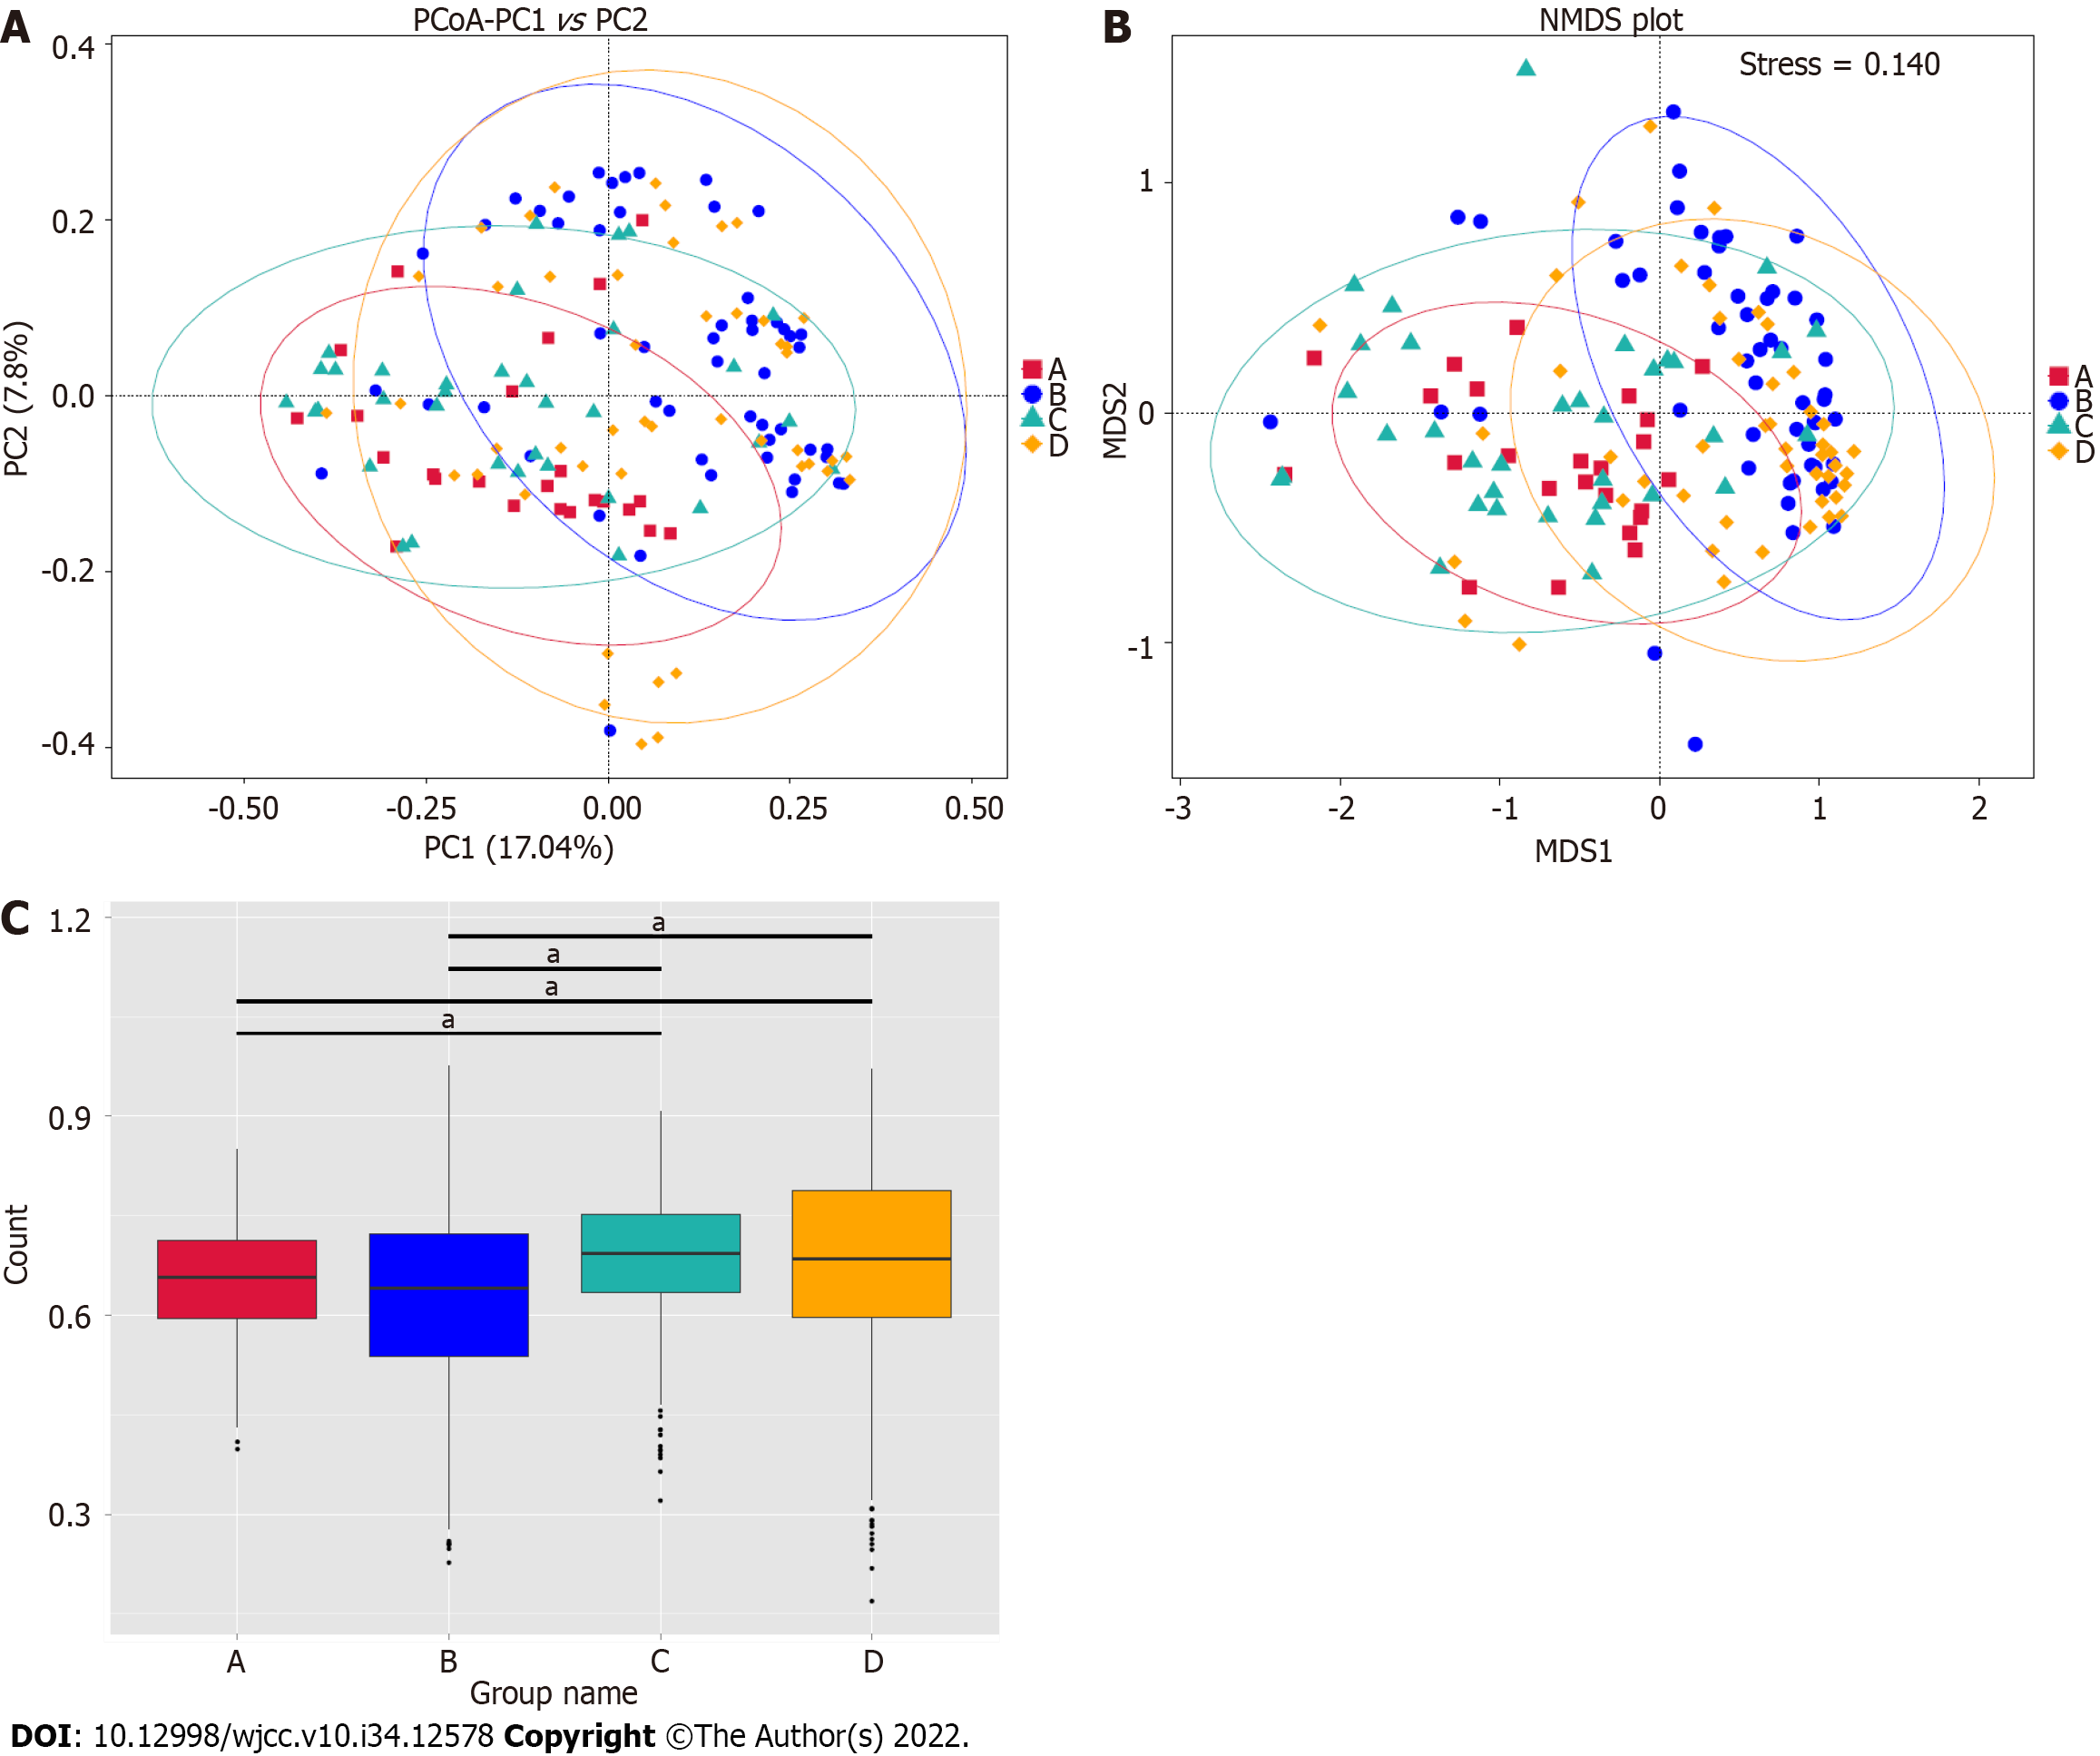
Figure 3 Principal coordinates analysis and non-metric multidimensional scaling analysis.
A: The Principal coordinates analysis based on the unweighted UniFrac distance is shown. Red, blue, green, and orange represent groups A, B, C, and D, respectively. The distance of the points represents comparability; B: The non-metric multidimensional scaling analysis based on the microbial clusters is shown. Red, blue, green, and orange represent groups A, B, C, and D, respectively. The distance of the points represents comparability; C: Unweighted Unifrac Beta analysis based on microbial clusters was shown. Red represented group A, blue represented group B, green represented group C, and orange represented group D. aP < 0.01.
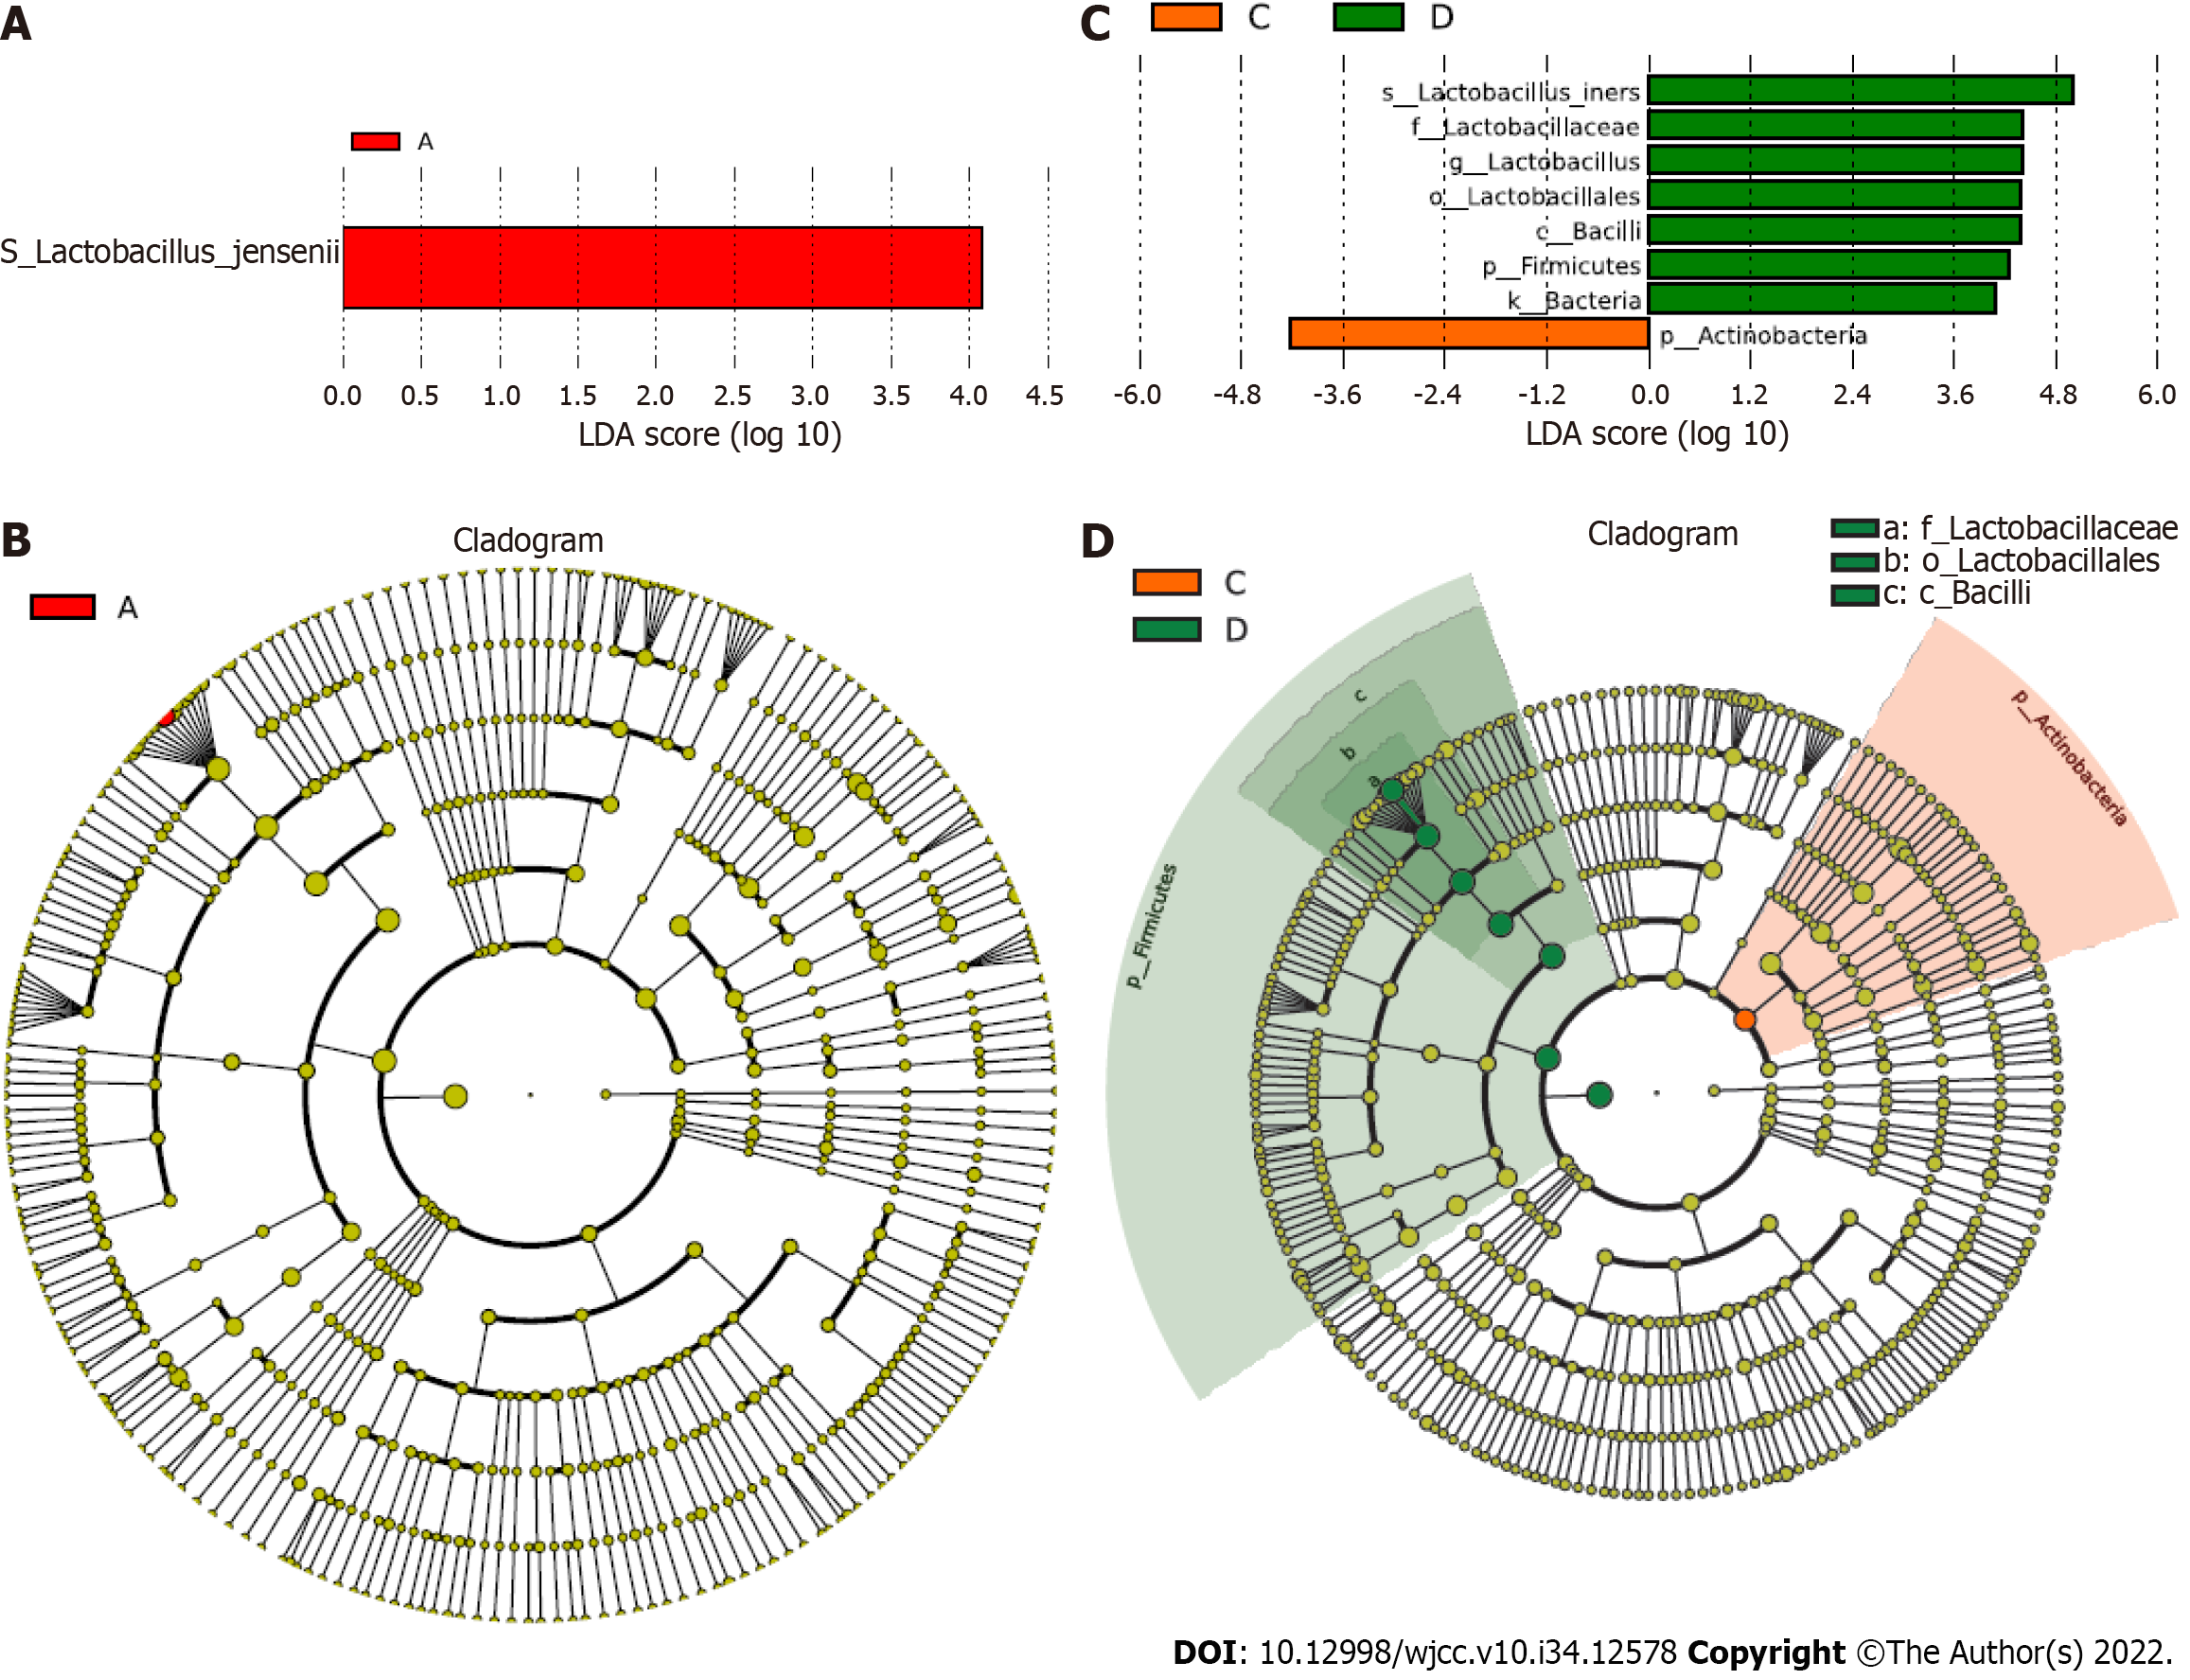
Figure 4 Specific taxa analysis.
A-D: The correlation of specific taxa with GBS status was analyzed using linear discriminant analysis (LDA). The LDA biomarkers and trees are shown.
- Citation: Liao Q, Zhang XF, Mi X, Jin F, Sun HM, Wang QX. Influence of group B streptococcus and vaginal cleanliness on the vaginal microbiome of pregnant women. World J Clin Cases 2022; 10(34): 12578-12586
- URL: https://www.wjgnet.com/2307-8960/full/v10/i34/12578.htm
- DOI: https://dx.doi.org/10.12998/wjcc.v10.i34.12578


