Copyright
©The Author(s) 2022.
World J Clin Cases. Oct 6, 2022; 10(28): 10260-10265
Published online Oct 6, 2022. doi: 10.12998/wjcc.v10.i28.10260
Published online Oct 6, 2022. doi: 10.12998/wjcc.v10.i28.10260
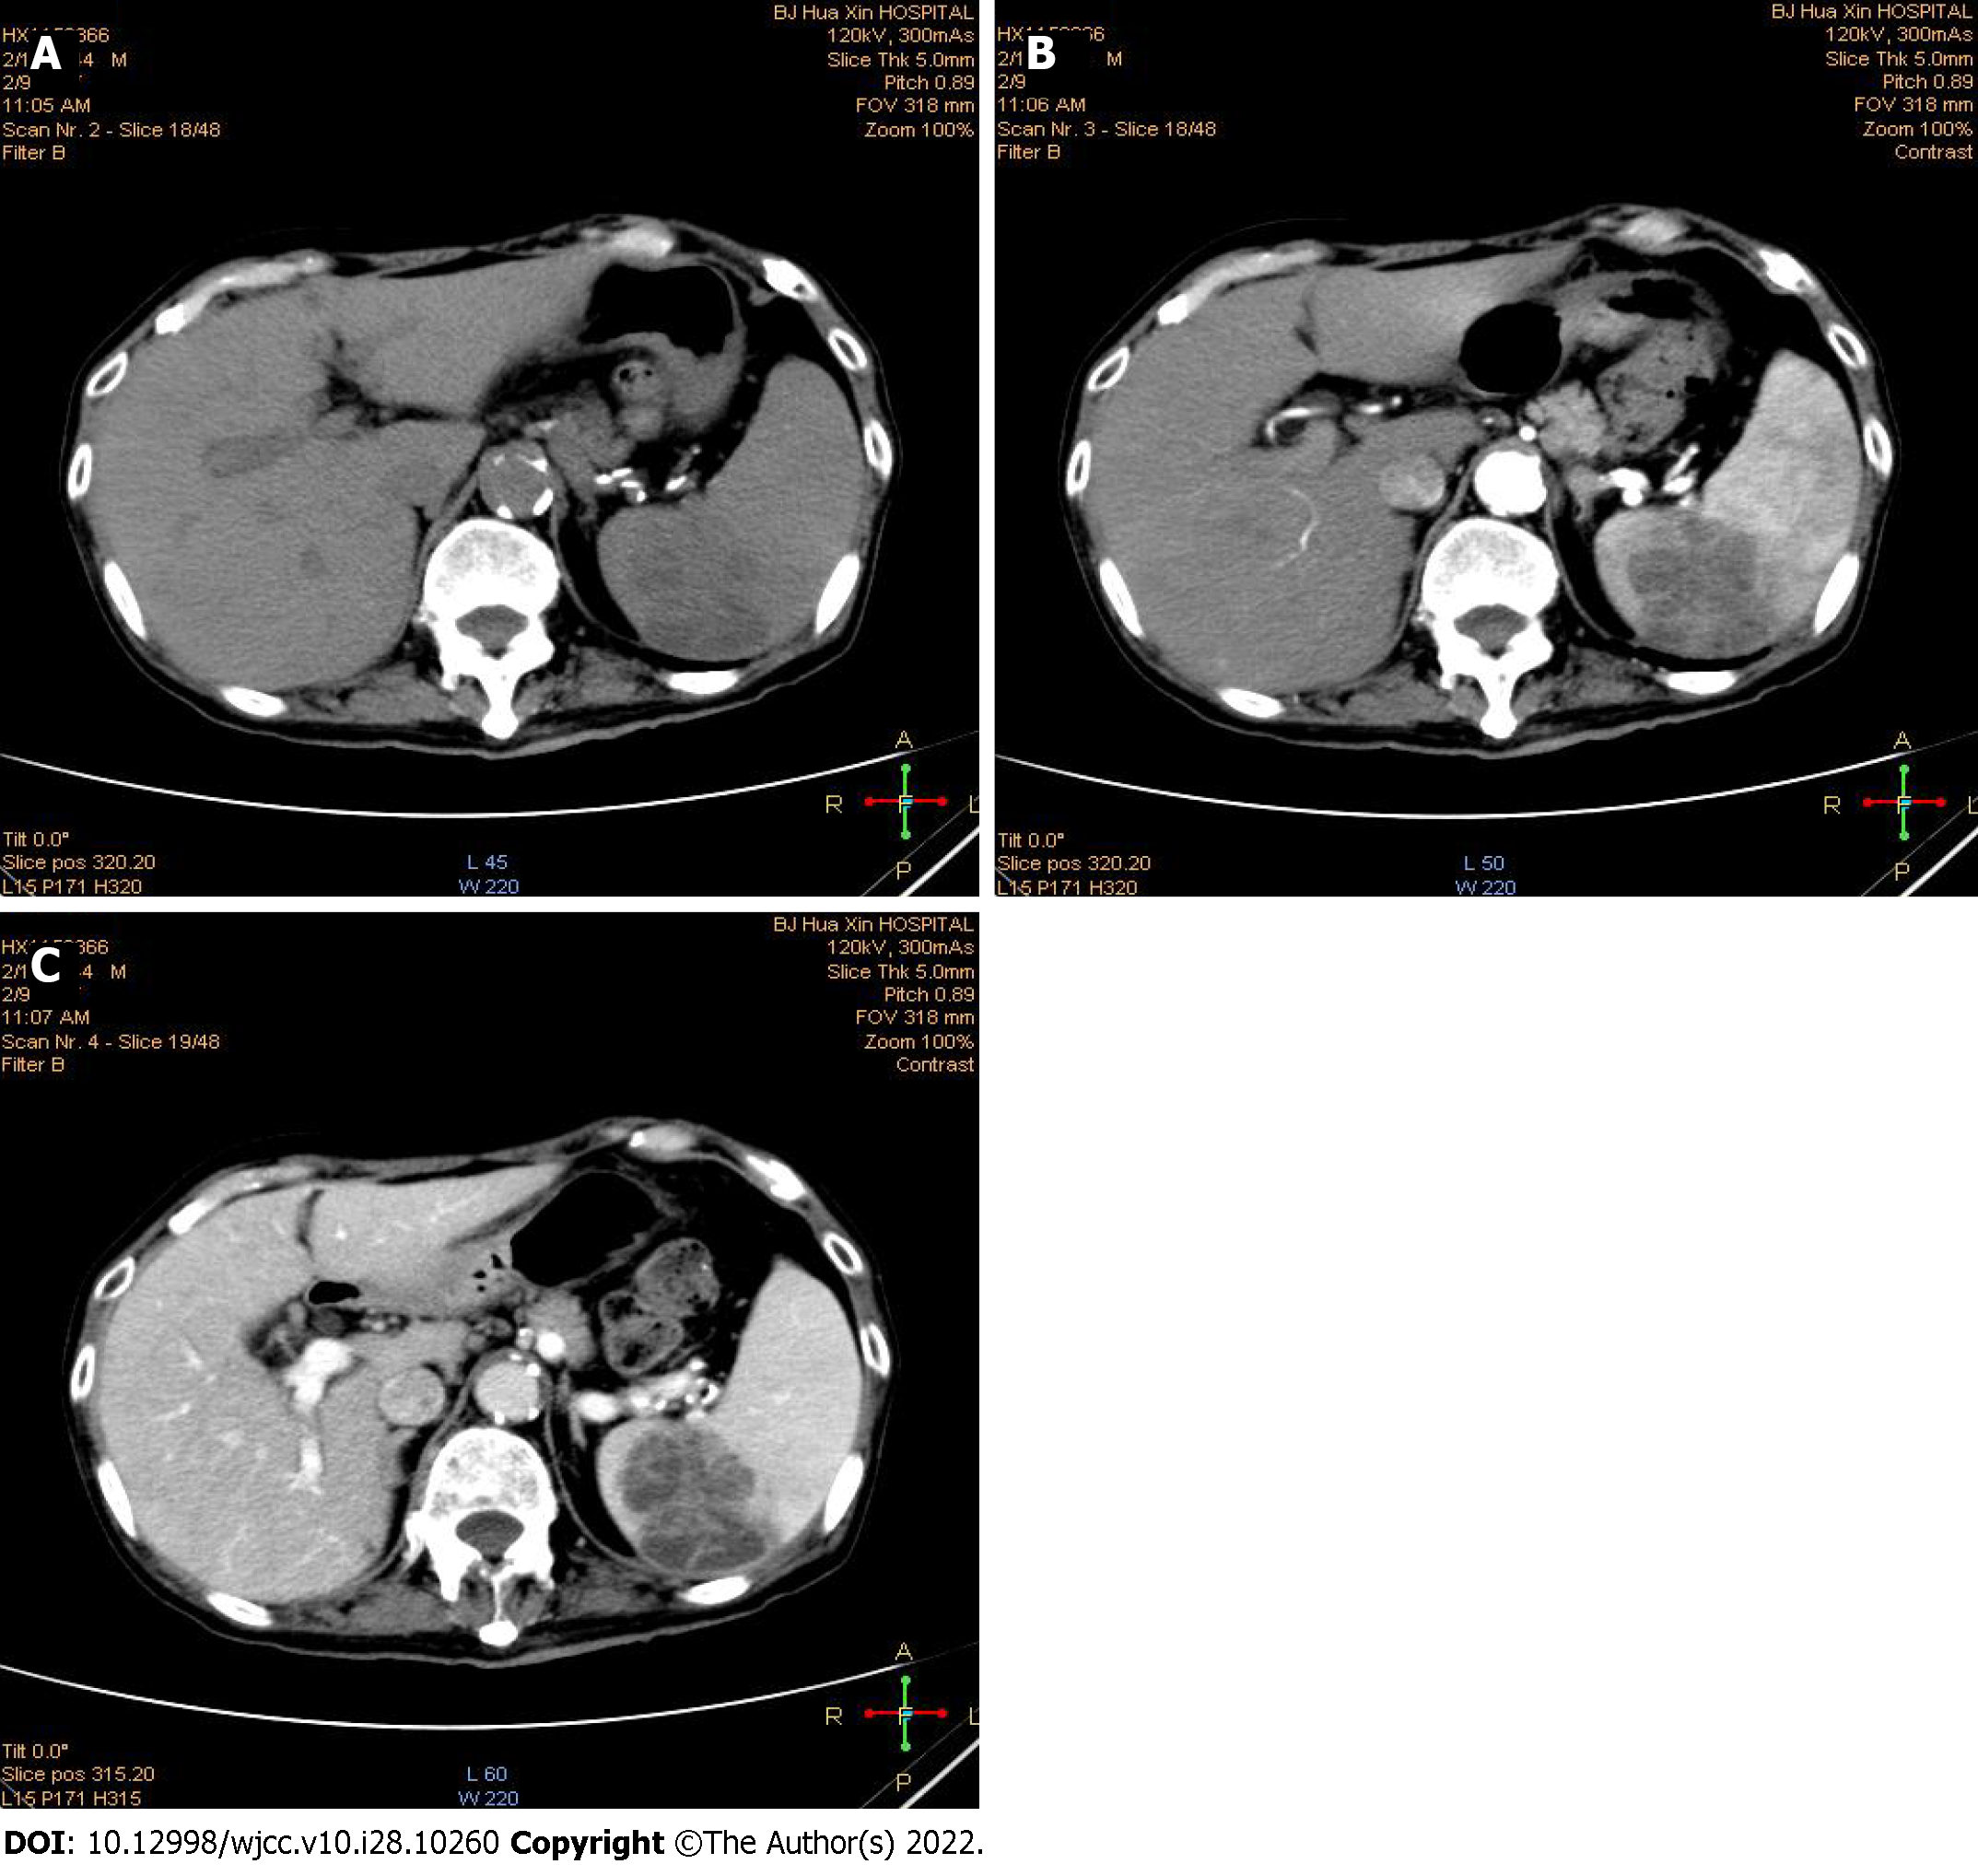
Figure 1 Abdominal computed tomography of a large circular lesion in the spleen.
A: Plain computed tomography (CT) showed a large circular lesion of mixed density (4.4 cm × 5.5 cm) in the spleen, and the CT value was 19-25 HU; B: Contrast-enhanced CT indicated the lesion and the CT value was 36 HU; C: Portal phase CT showed the lesion and the CT value was 48 HU. There were small patches of low-density liquefaction necrosis in the splenic parenchyma shown in (B) and (C).
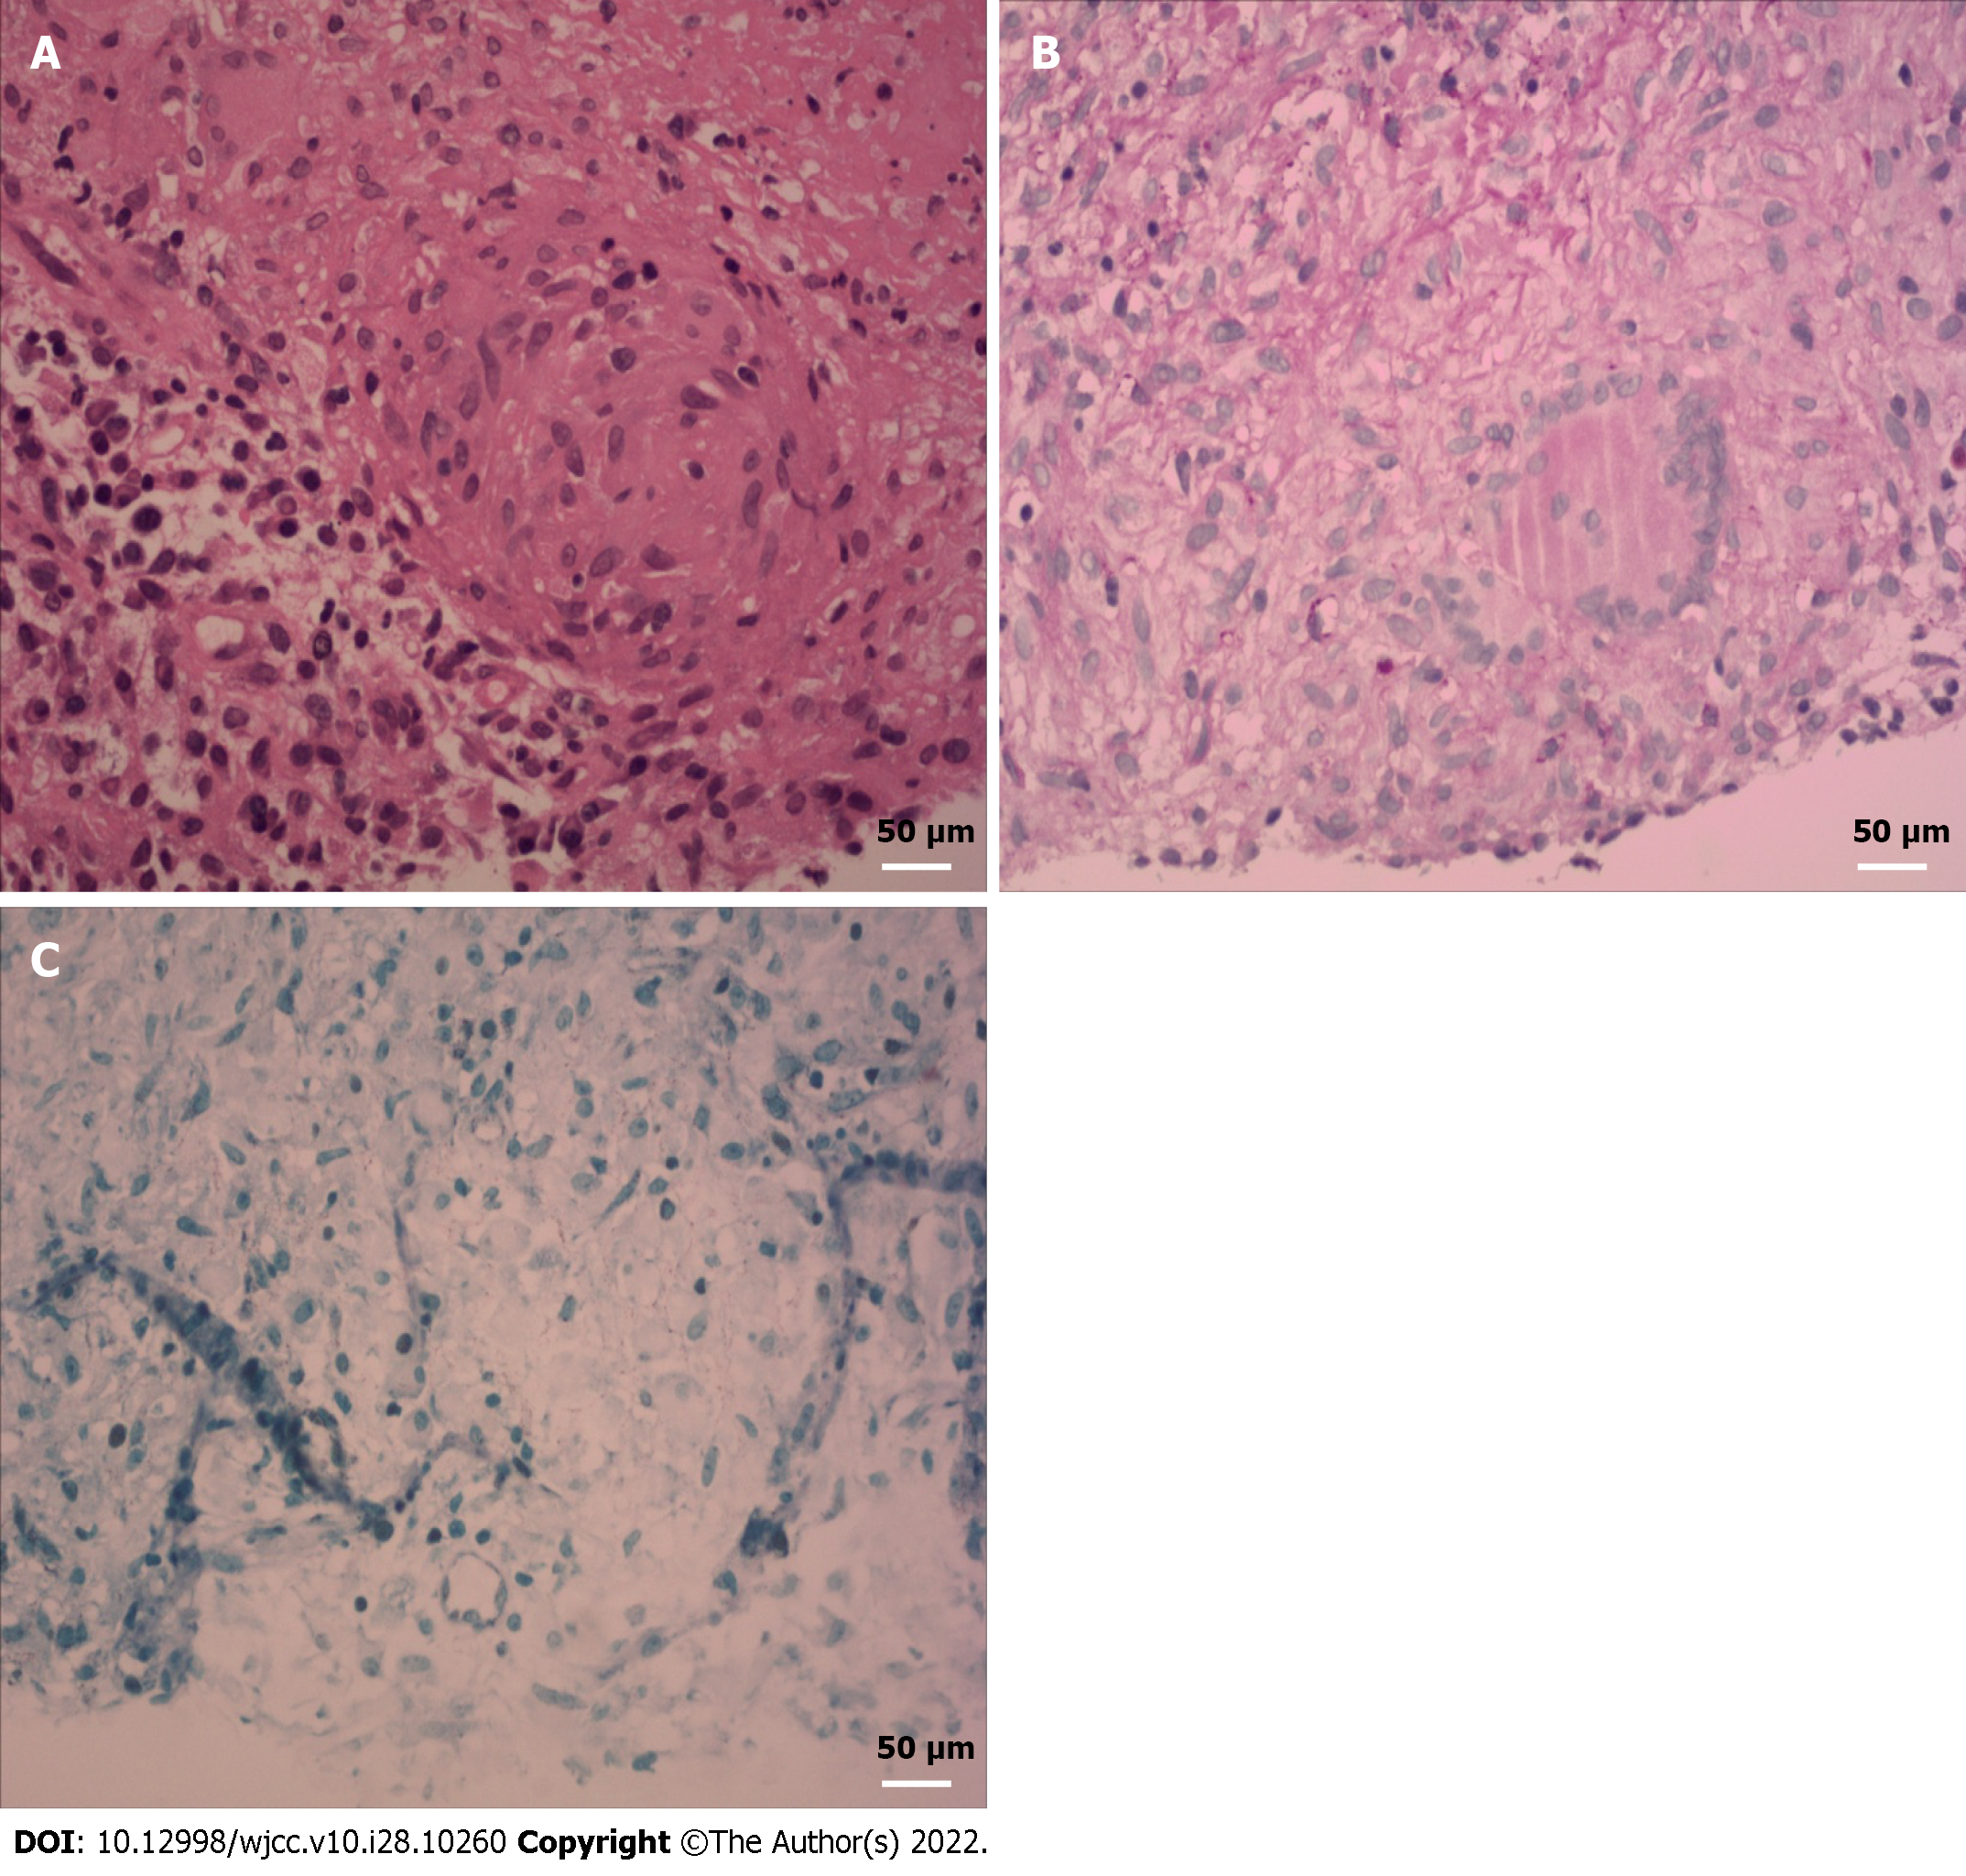
Figure 2 Pathological analysis of the splenic lesion.
A-C: Splenic tuberculosis pathological lesions including (A) granuloma (× 40), (B) multinucleate giant cells (× 40) and (C) acid-fast bacilli (× 40) were identified by hematoxylin and eosin staining and acid-fast staining.
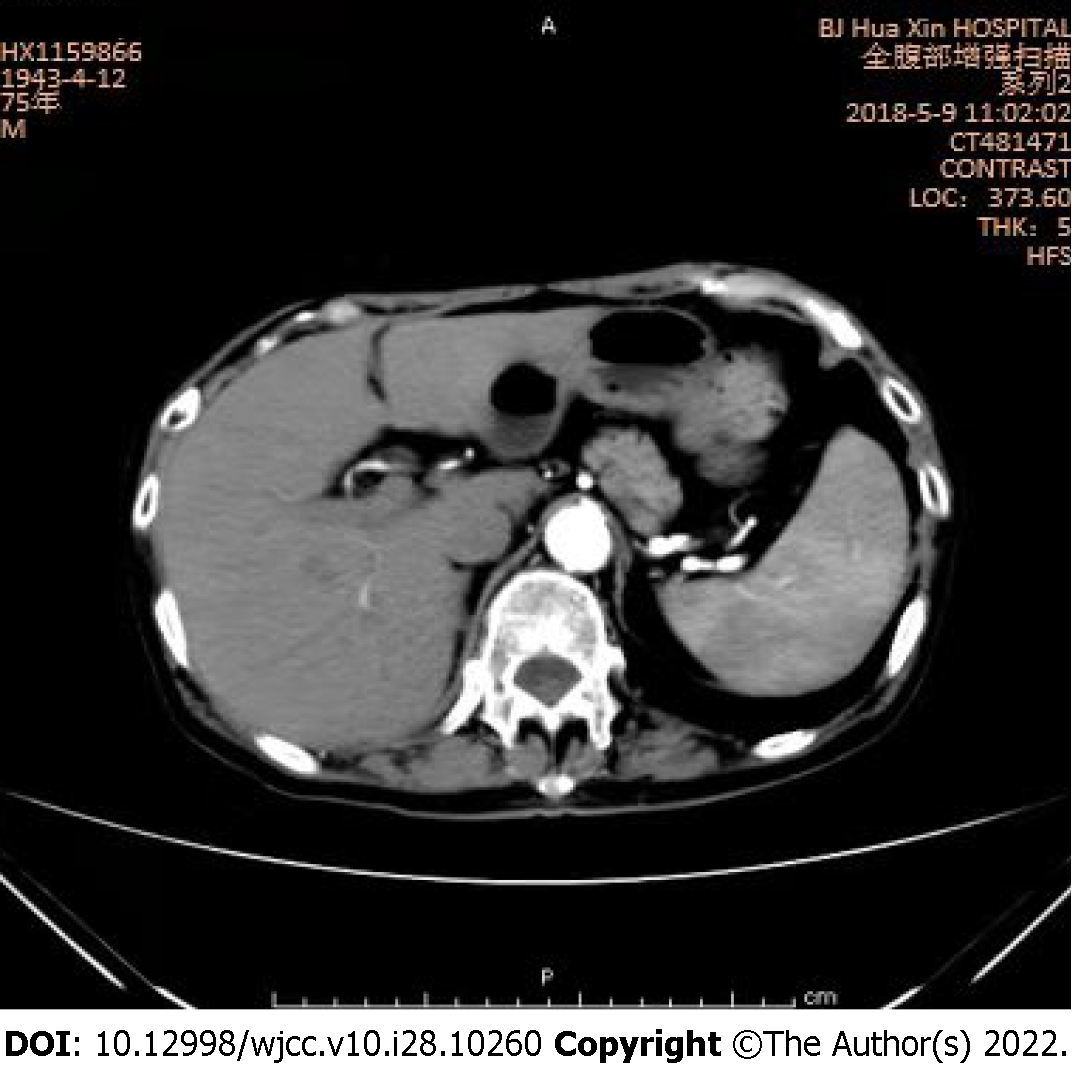
Figure 3 Abdominal contrast-enhanced computed tomography of the splenic lesion.
The lesion had shrunk significantly.
- Citation: Guo HW, Liu XQ, Cheng YL. Solitary splenic tuberculosis: A case report. World J Clin Cases 2022; 10(28): 10260-10265
- URL: https://www.wjgnet.com/2307-8960/full/v10/i28/10260.htm
- DOI: https://dx.doi.org/10.12998/wjcc.v10.i28.10260


