Copyright
©The Author(s) 2022.
World J Clin Cases. Oct 6, 2022; 10(28): 10236-10243
Published online Oct 6, 2022. doi: 10.12998/wjcc.v10.i28.10236
Published online Oct 6, 2022. doi: 10.12998/wjcc.v10.i28.10236
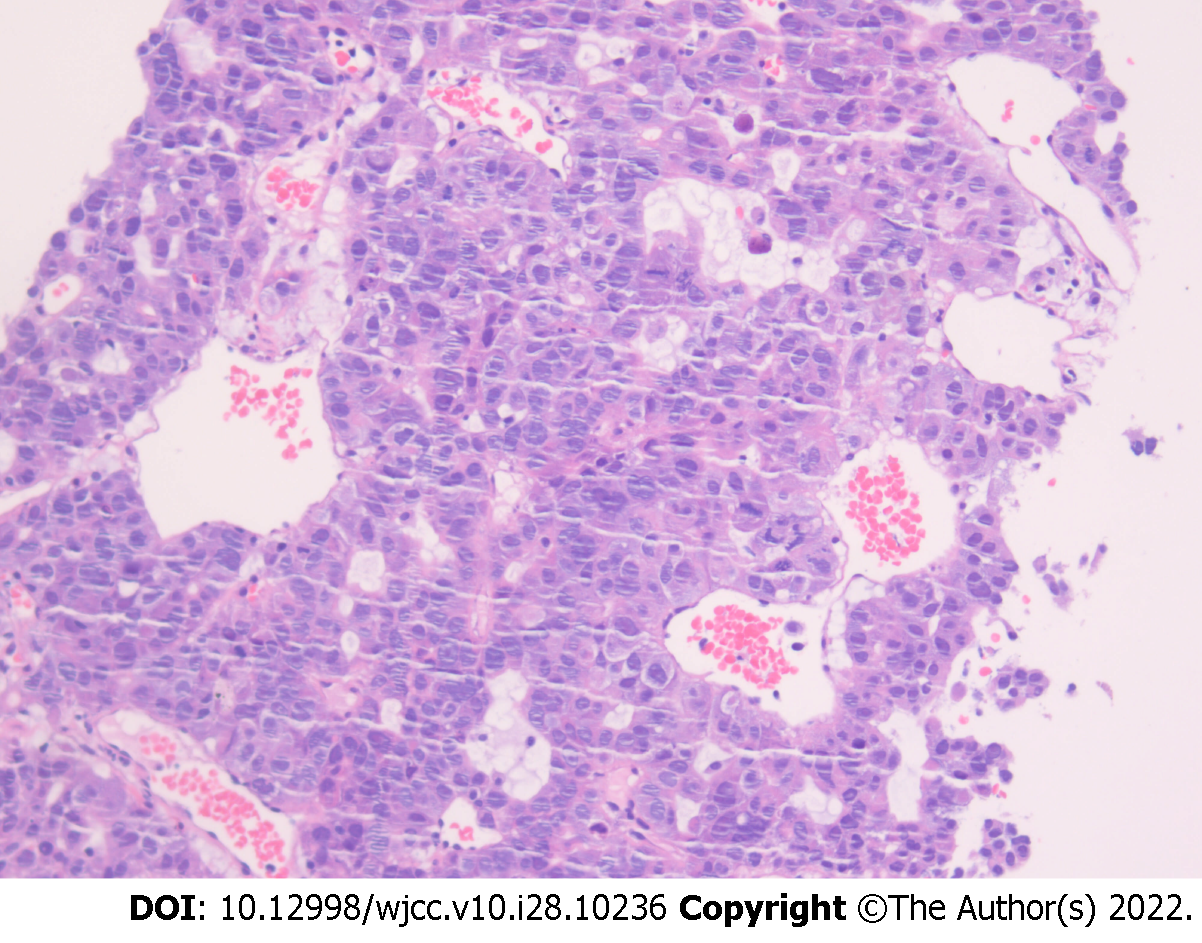
Figure 1 Ultrasound guided coarse-needle puncture biopsy of the left upper lobe mass showed non-small-cell poorly differentiated carcinoma with neuroendocrine differentiation.
Figure 2 Second immunohistochemical staining analysis on patient’s tumor tissue.
A: Alpha-fetoprotein; B: CK18; C: GPC-3; D: Hepatocyte.
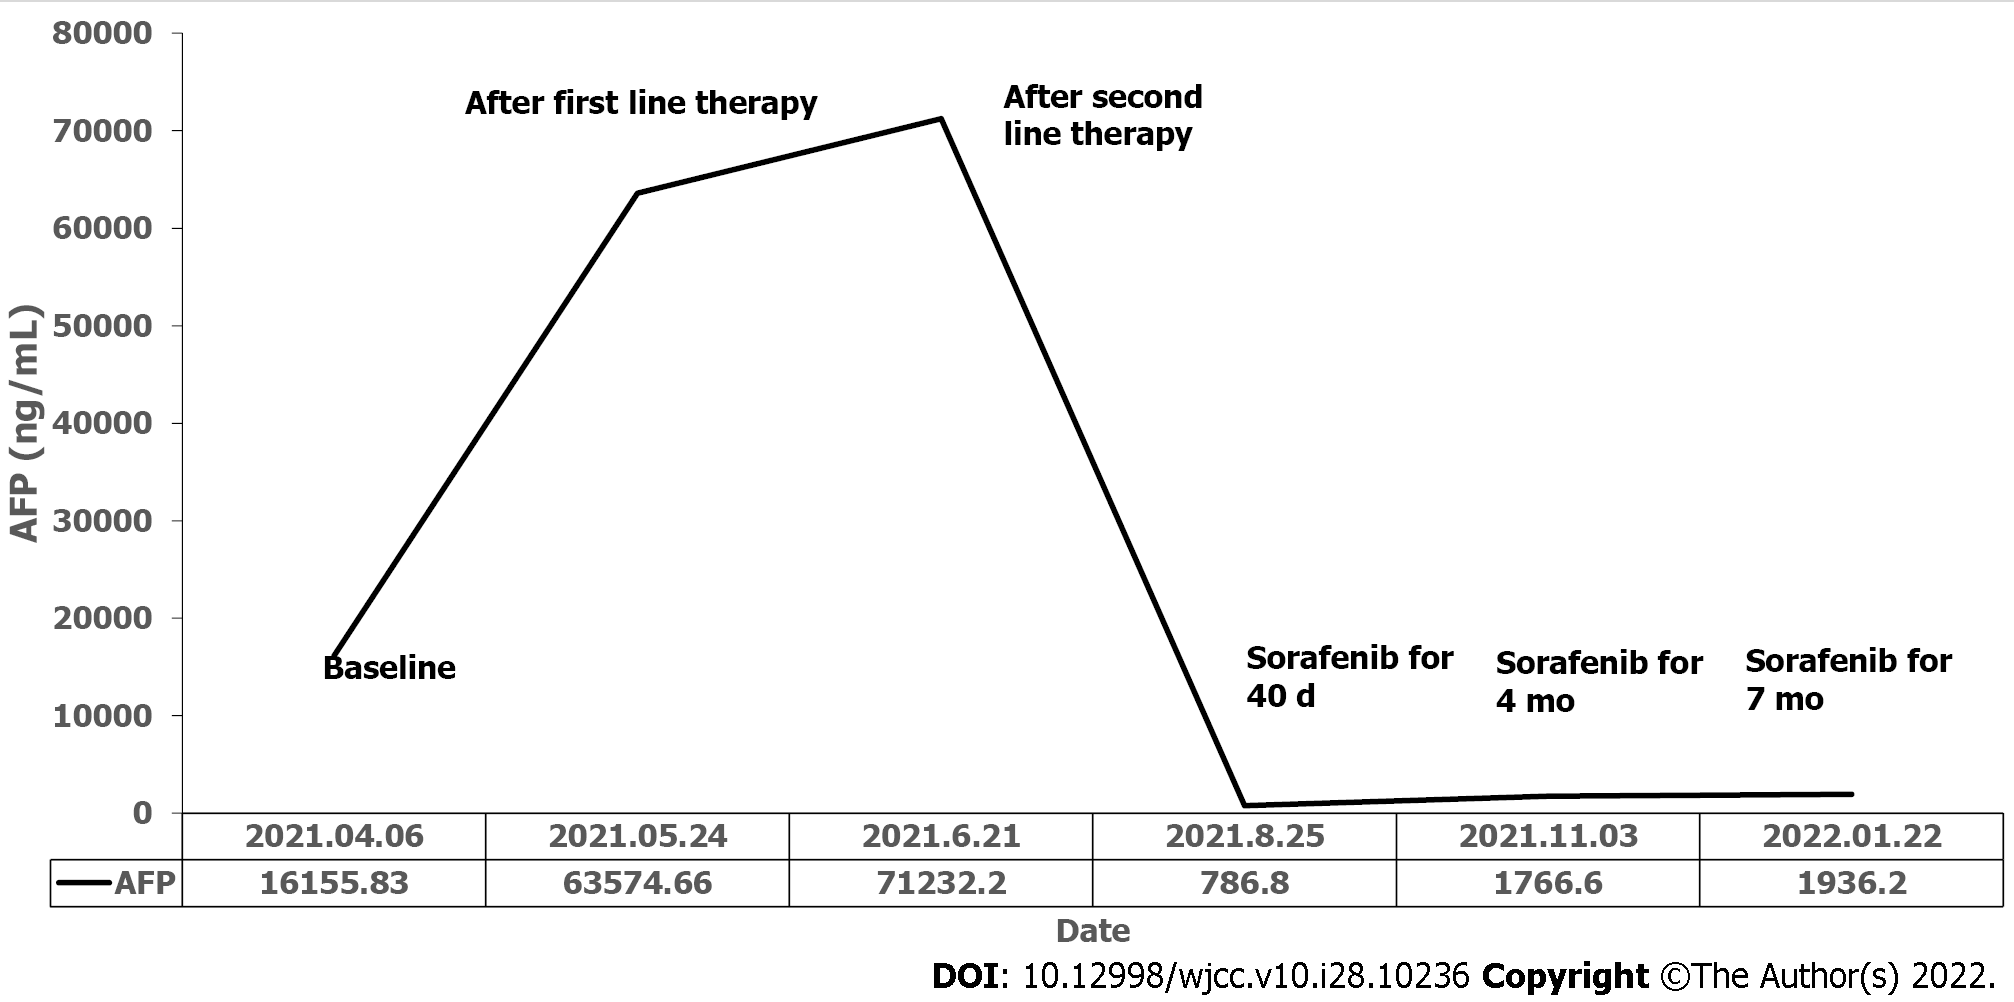
Figure 3 Trend of serum alpha-fetoprotein level during the clinical course.
Figure 4 Lung window views of chest-computed tomography scans showed tumor mass at different stages of the disease.
A: Baseline scan revealed a 8.46 cm × 6.53 cm mass on the left upper chest wall; B: The computed tomography (CT) scan after first-line therapy showed that the mass increased to 8.81 cm × 7.66 cm; C: The CT scan after second-line therapy showed that the mass increased to 8.86 cm × 8.21 cm; D: After treatment with sorafenib monotherapy for 40 d, the CT revealed a marked decrease in the size of the huge subpleural mass (5.63 cm × 5.29 cm); E and F: The CT showed that the mass still decreased after sorafenib monotherapy for 4 mo (5.08 cm × 4.89 cm) and 7 mo (4.95 cm × 4.69 cm).
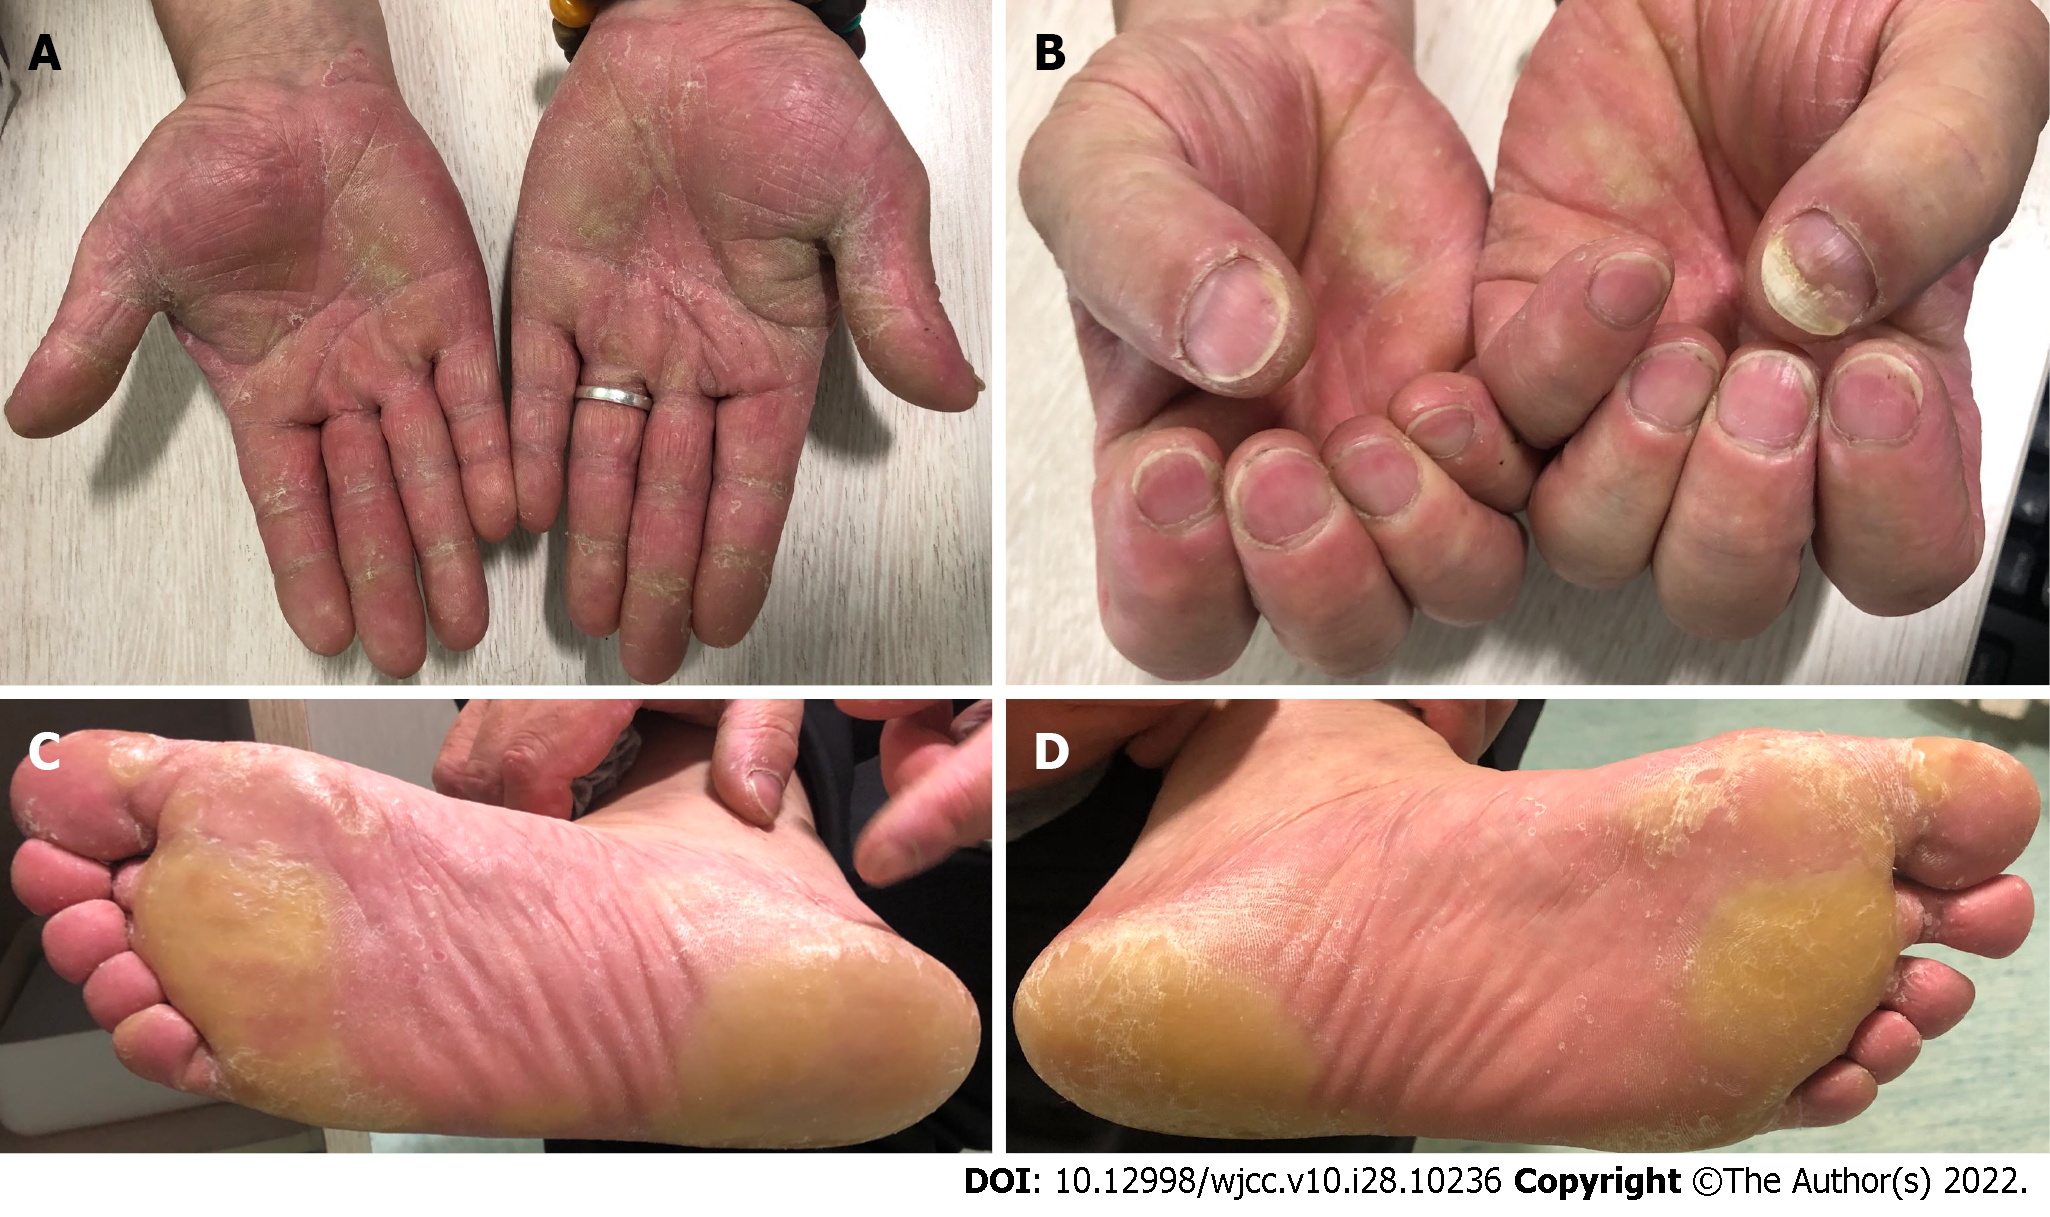
Figure 5 The patient developed grade II hand foot syndrome.
A: Palms of both hands; B: Fingernails of both hands; C: Sole of right foot; D: Sole of left foot.
- Citation: Xu SZ, Zhang XC, Jiang Q, Chen M, He MY, Shen P. Alpha-fetoprotein-producing hepatoid adenocarcinoma of the lung responsive to sorafenib after multiline treatment: A case report. World J Clin Cases 2022; 10(28): 10236-10243
- URL: https://www.wjgnet.com/2307-8960/full/v10/i28/10236.htm
- DOI: https://dx.doi.org/10.12998/wjcc.v10.i28.10236


