Copyright
©The Author(s) 2022.
World J Clin Cases. Oct 6, 2022; 10(28): 10017-10030
Published online Oct 6, 2022. doi: 10.12998/wjcc.v10.i28.10017
Published online Oct 6, 2022. doi: 10.12998/wjcc.v10.i28.10017
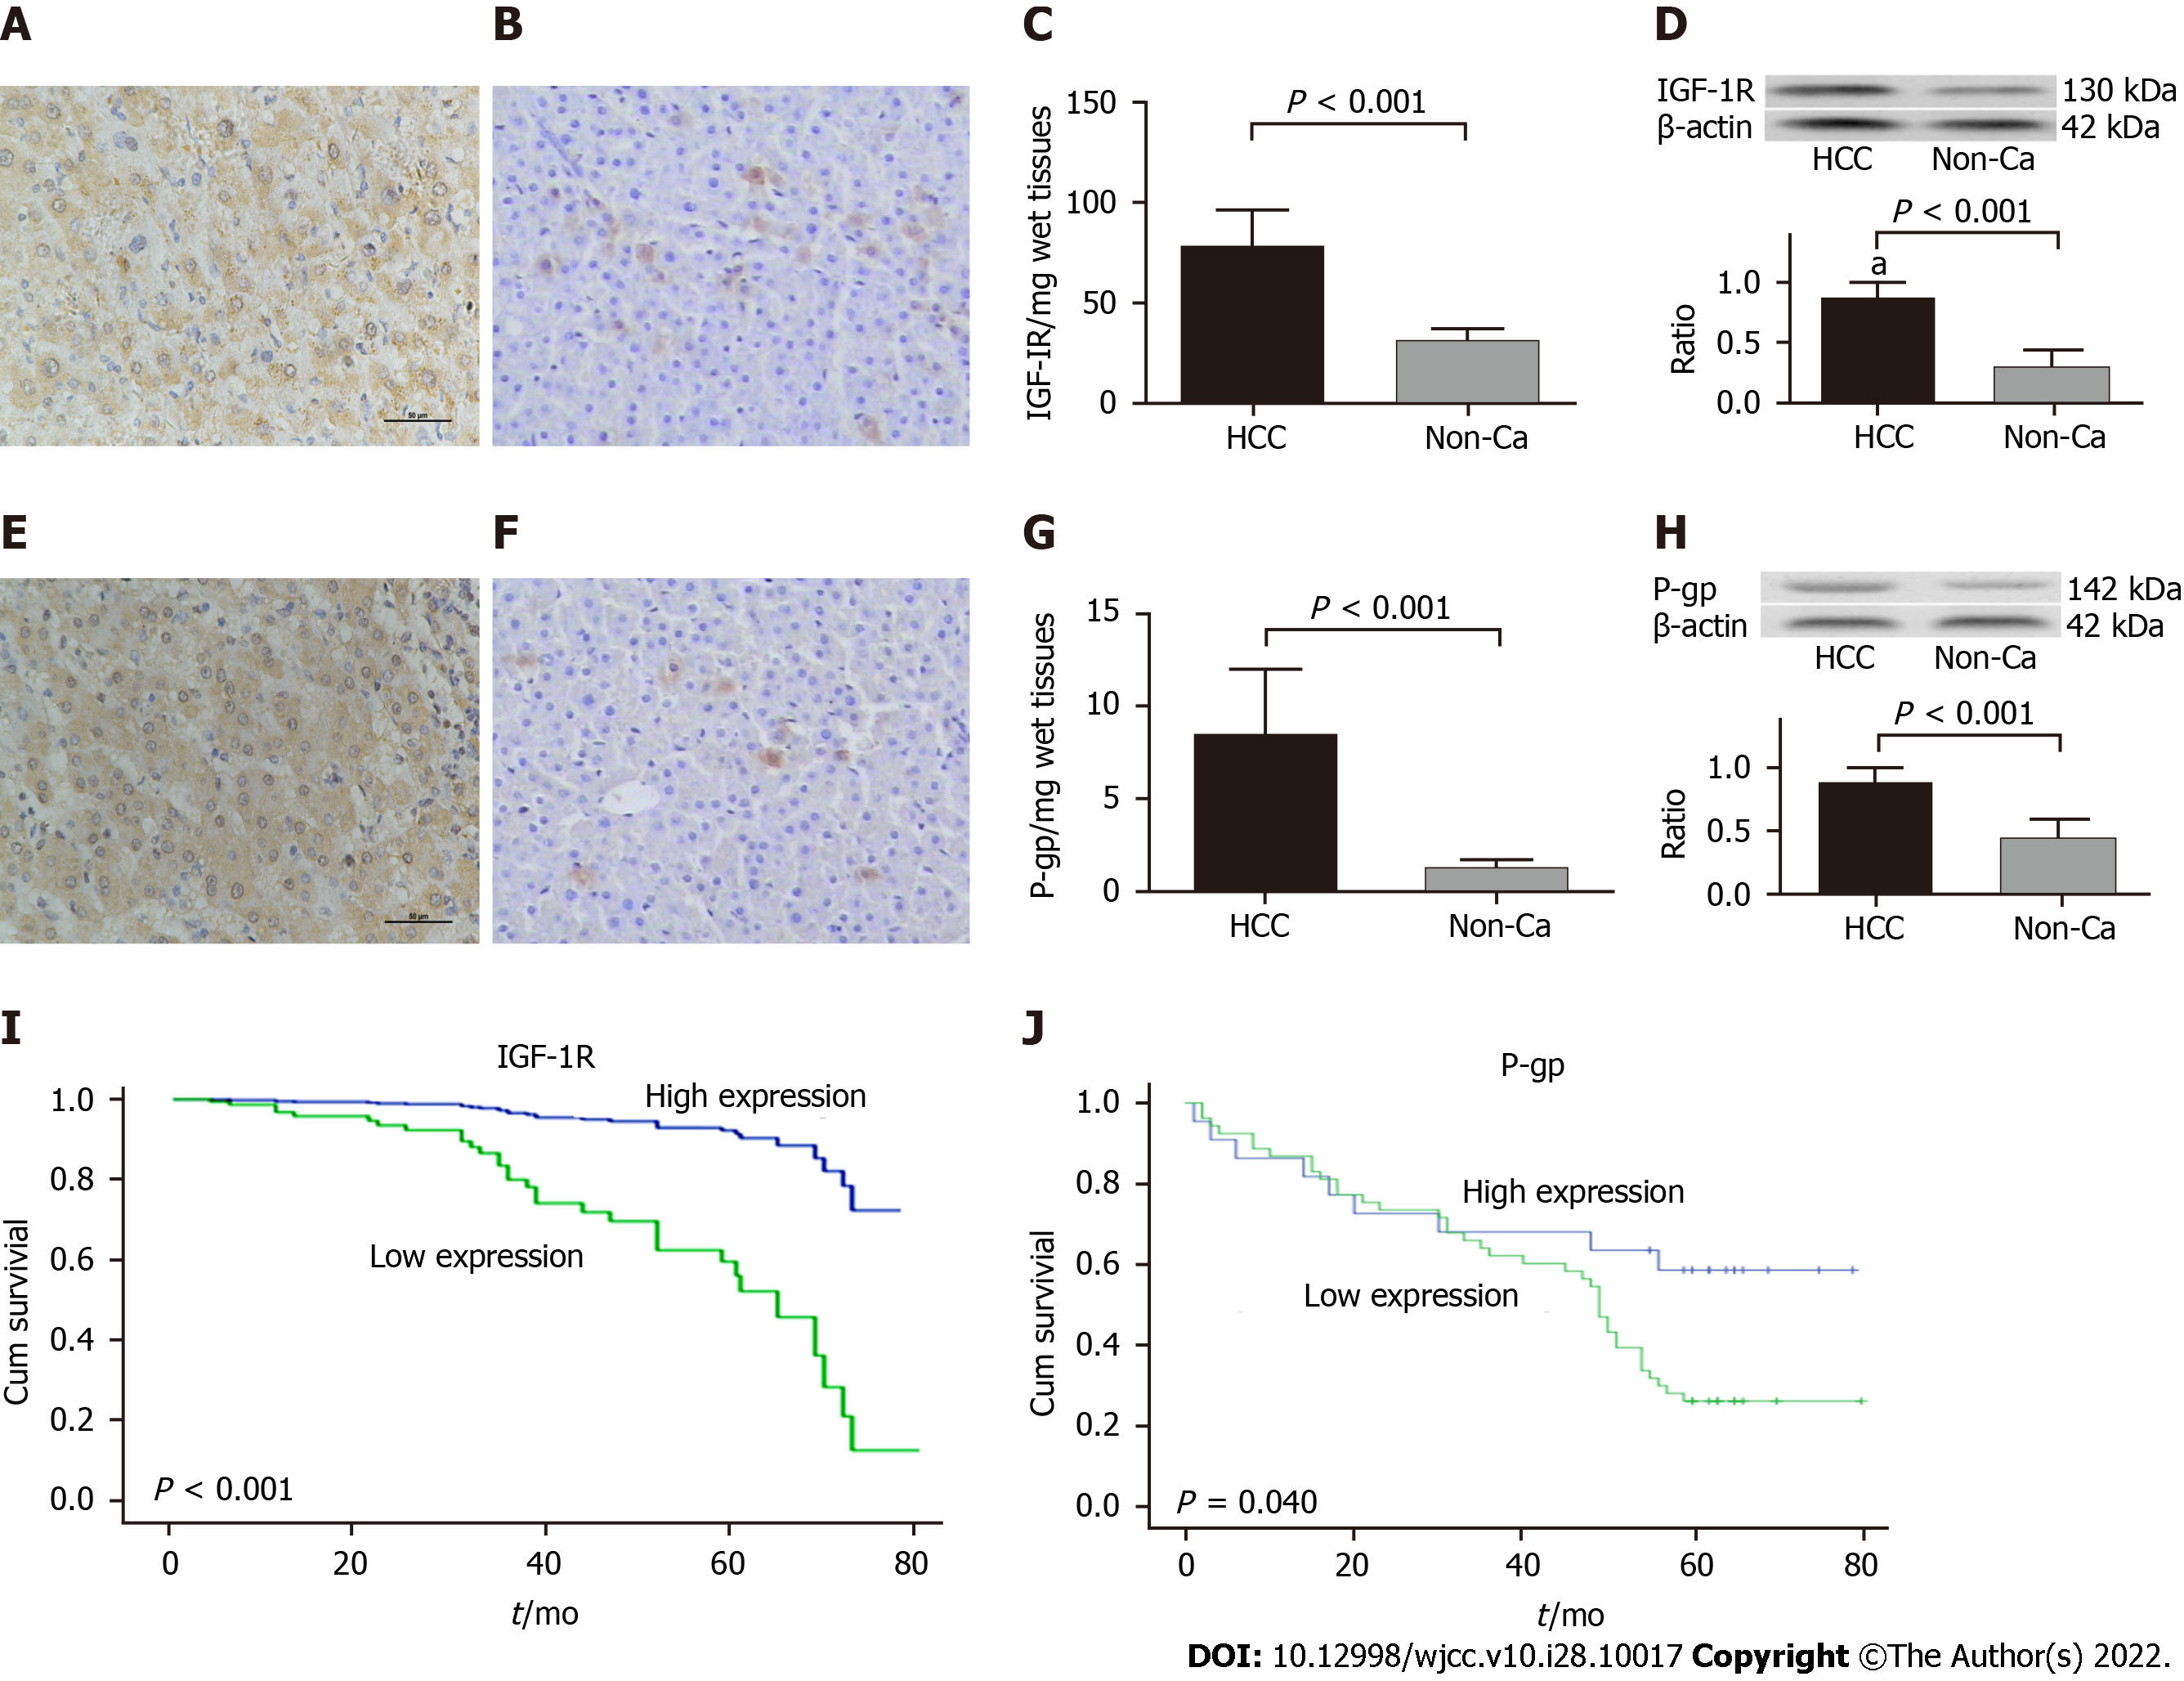
Figure 1 Expression of insulin-like growth factor-1 receptor or P-glyco protein with cumulative survival of hepatocellular carcinoma patients.
Liver insulin-like growth factor-1 receptor (IGF-1R) or P-glyco protein (P-gp) in the hepatocellular carcinoma (HCC) group were analyzed using immunohistochemistry (IHC) with anti-human IGF-1R or P-gp antibodies. A: The IGF-1R staining in HCC by IHC (× 200); B: The IGF-1R staining in distal non-cancerous tissues (non-Ca, × 200); C: The specific concentration of IGF-1R/per mg wet liver in the HCC (78.62 ± 18.42 pg) or non-Ca (31.22 ± 6.38 pg) group; D: The IGF-1R by Western blotting (130 kDa, upper) and the ratios form IGF-1R to β-actin (down). Similar to hepatic IGF-1R, E: The P-gp staining in HCC by IHC (× 200); F: The P-gp staining in non-Ca (× 200); G: The specific concentration of P-gp/per mg wet liver in the HCC (8.52 ± 3.49 ng) or D-can (1.28 ± 0.46 ng) group; H: The P-gp by Western blotting (142 kDa, upper) and the ratios form IGF-1R to β-actin (down). I: The cumulative survival curve of HCC patients with high IGF1R expression. J: The cumulative survival curve of HCC patients with high P-gp expression.
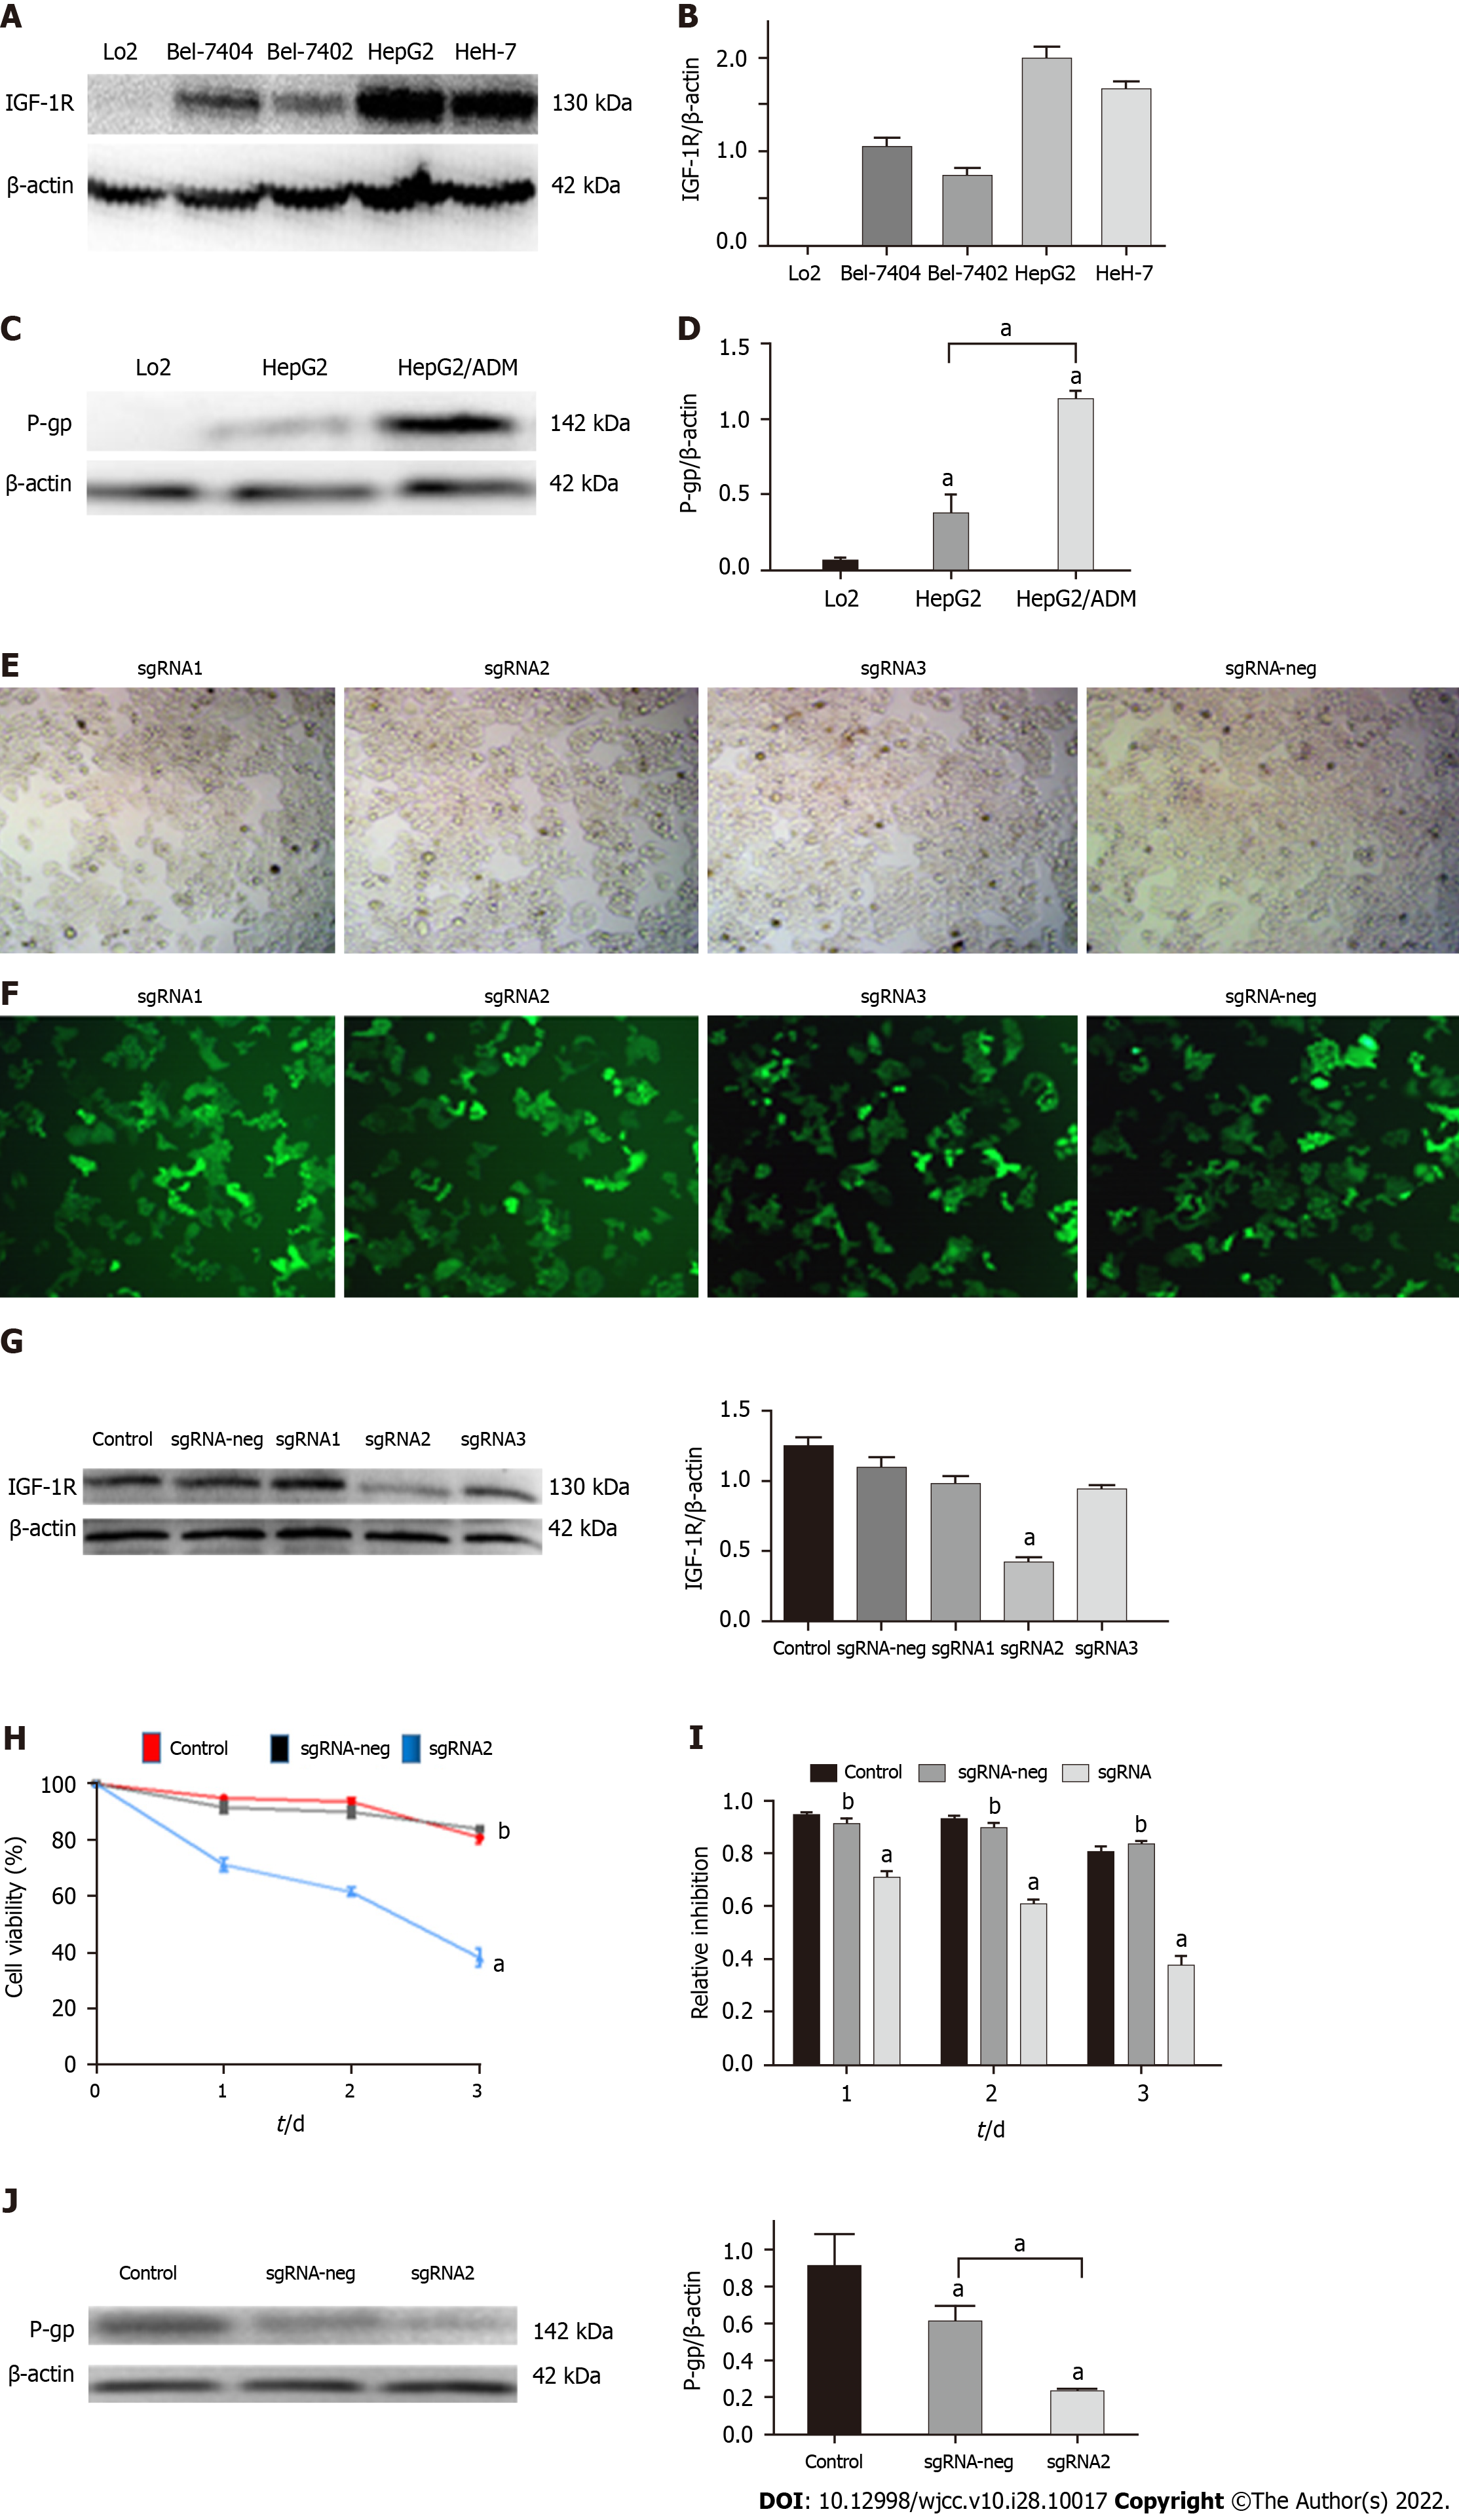
Figure 2 Editing IGF-1R on effects of HepG2 cell proliferation and P-glyco protein expression.
A: The insulin-like growth factor-1 receptor (IGF-1R) expression among human LO2 cells, hepatocellular carcinoma Bel-7404, Bel-7402, HepG2, and HeH-7 cell lines; B: The relative ratios of IGF-1R to β-actin from Figure 2A; C: The P-glyco protein (P-gp) expression in human HepG2 cells and HepG2/ADM cells; D: The relative ratios of P-gp to β-actin from Figure 2C; E: HepG2 cells (black & white) were transfected by the sgRNA1, sgRNA2, sgRNA3, and sgRNA-neg plasmids using the Crispr/Cas9 system. F: HepG2 cells (fluorescent) transfection efficiencies of the sgRNA1, sgRNA2, sgRNA3, and sgRNA-neg plasmids; G: The IGF-IR expression in HepG2 cells of the different transfected groups: Upper, IGF-1R analyzed by Western bolting; Down, the relative ratios of IGF-1R to β-actin; H: The inhibiting curve of HepG2 cells with specific sgRNA2 transfection in a time-dependent manner; I: The bar graph corresponding to Figure 2H; J: The significant decreasing of P-gp expression in HepG2/ADM cells transfected with sgRNA2 plasmids. aP < 0.05; bP < 0.01.
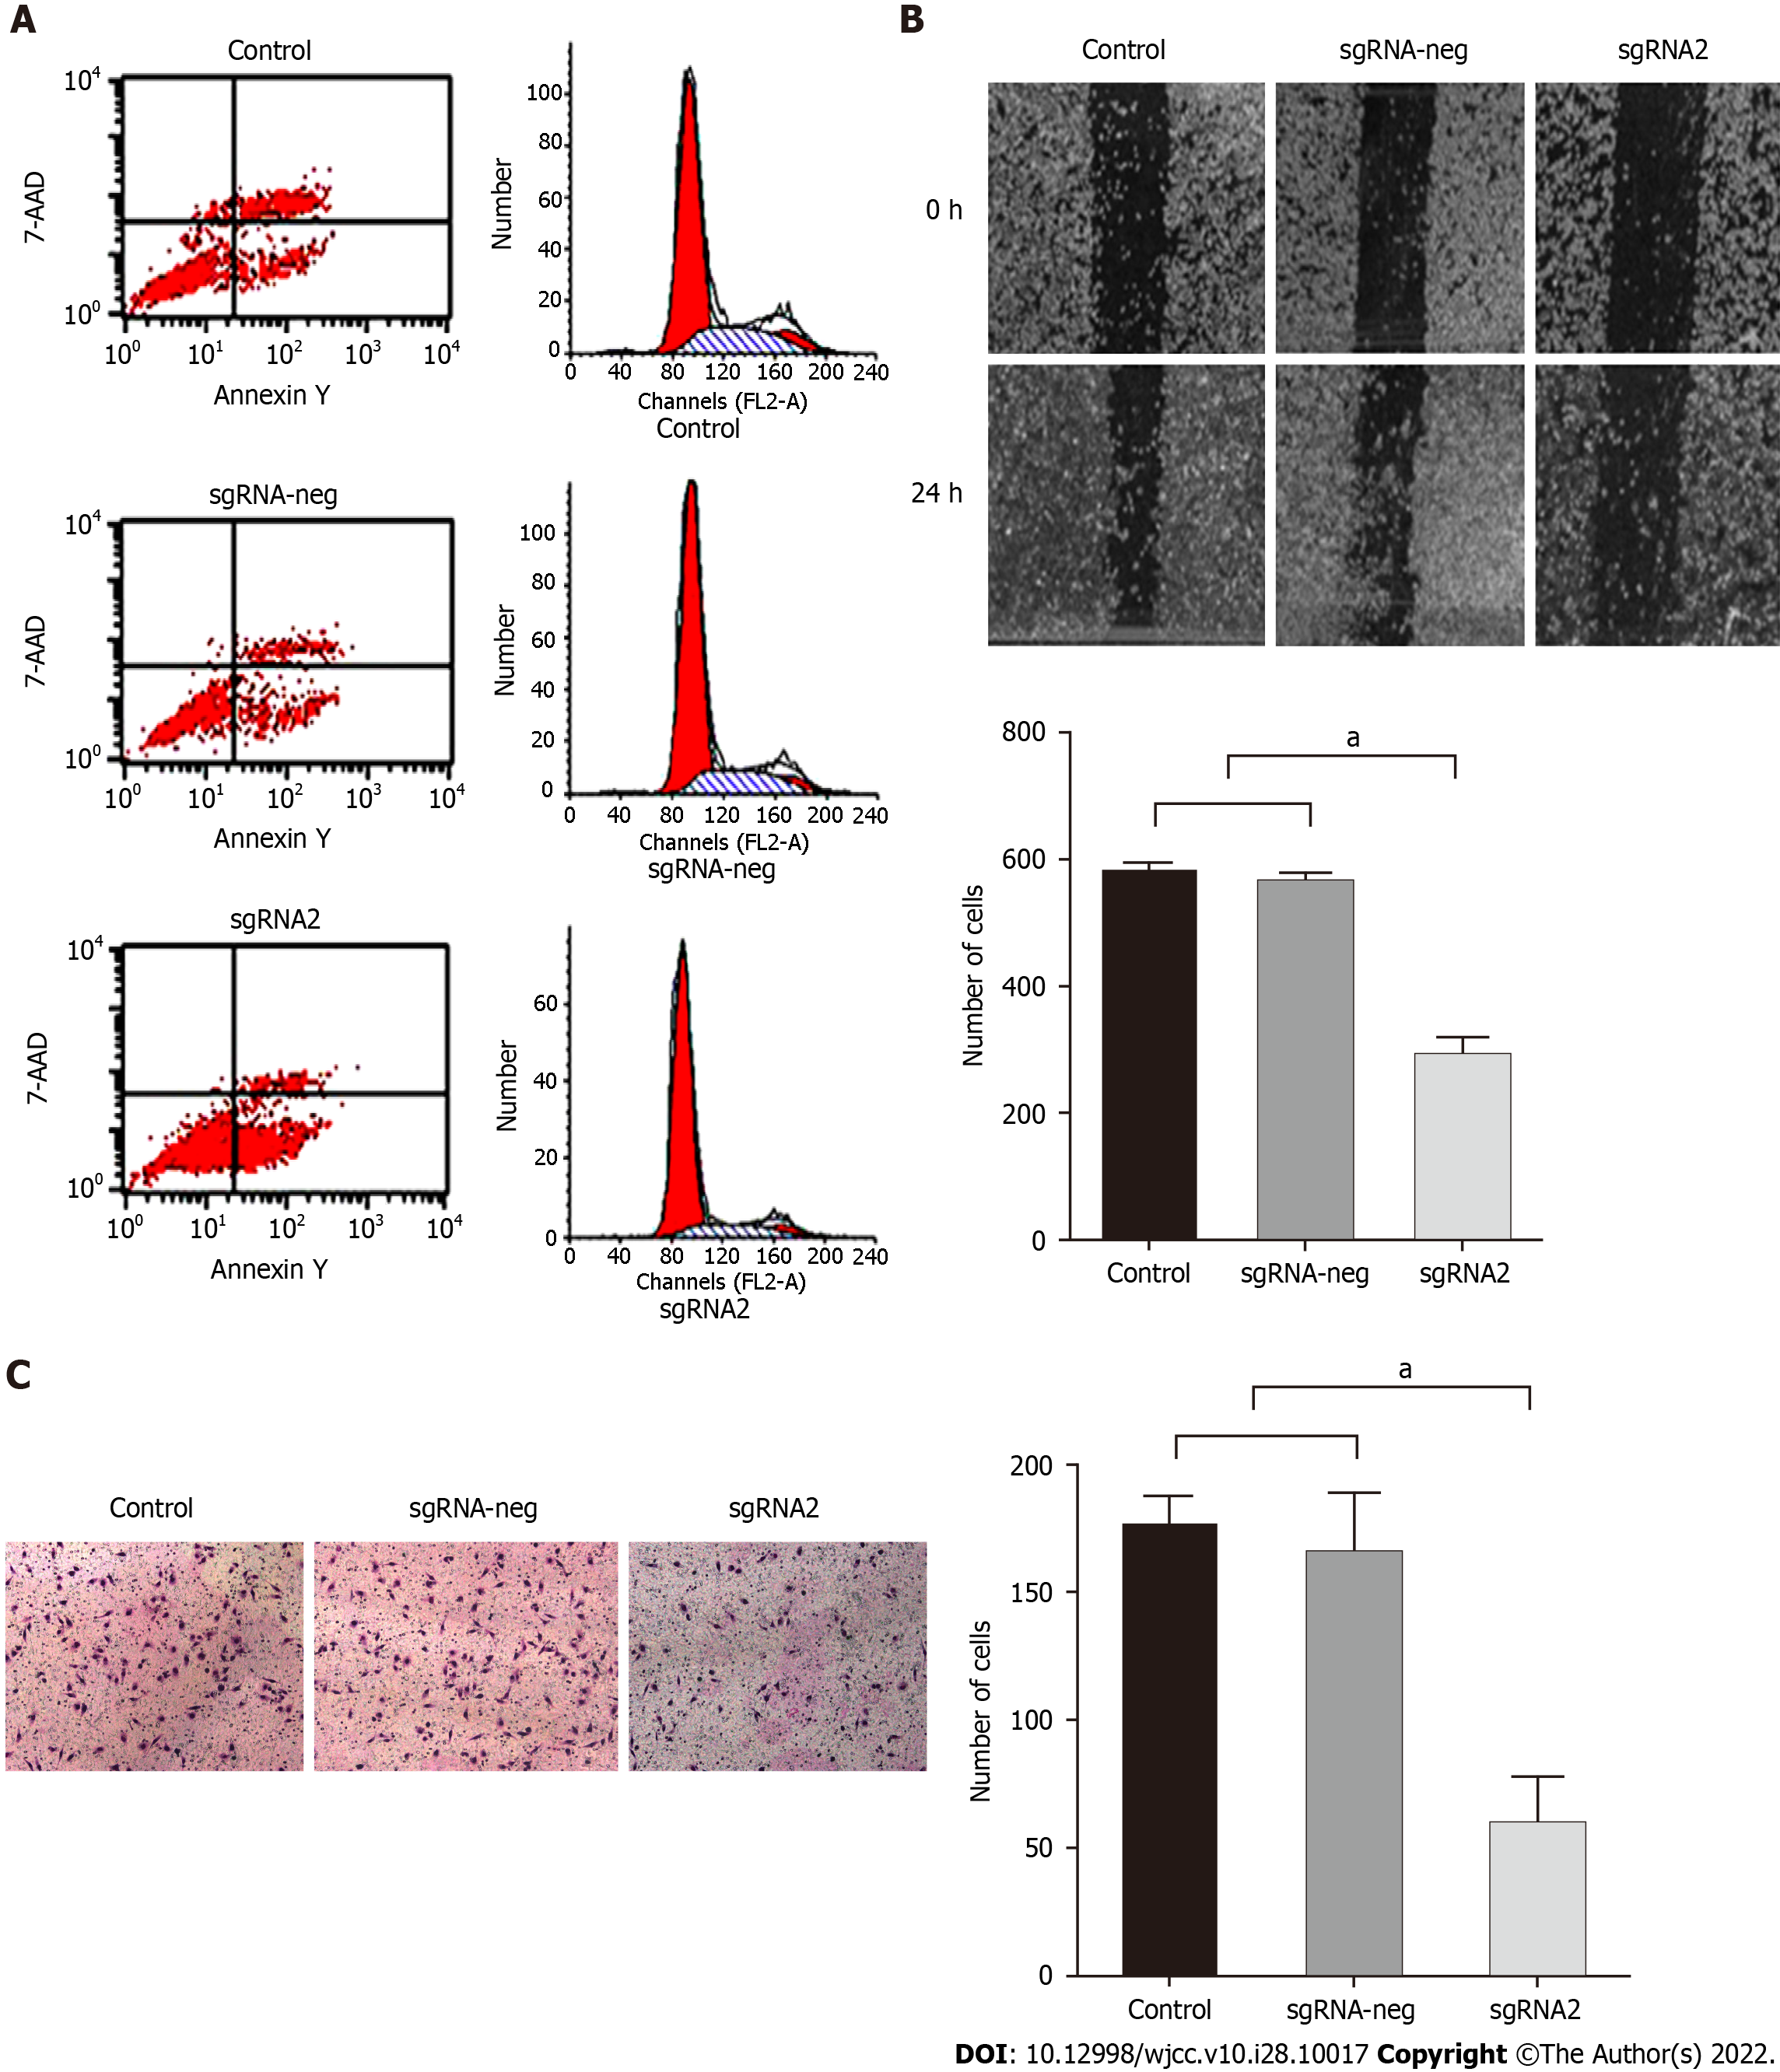
Figure 3 Editing IGF-1R on effects of biological features of HepG2 cells.
HepG2 cells were divided into control, sgRNA-neg, and sgRNA2 groups. After HepG2 cells transfected with sgRNA2 plasmids: A: Number of apoptotic cells in the sgRNA2 group was significantly higher than those in the sgRNA-neg or control group. B: Migration rates of HepG2 cells were detected by scratch wound test and suppressive effect of specific sgRNA2-mediated IGF-1R on the migration potential of HepG2 cells. Left: Representative images of migration cells at 0 h or at24 h from the control, sgRNA-neg, and sgRNA group; Right: Comparative analysis of migration cells among the different group. C: Invasion rates of HepG2 cells for 24 h were detected by Transwell assay and suppressive effect of sgRNA2-mediated IGF-1R on the invasion potential of HepG2 cells. Invaded cells were enumerated under a light microscope (magnification × 100). Left: Representative images of invasive cells stained with crystal violet from the control, sgRNA-neg, and sgRNA group; Right: Comparative analysis of invasive cells among the different group. P < 0.001 vs Control or sgRNA-neg group. The data were shown as mean ± SD. IGF-IR: Insulin-like growth factor-1 receptor. aP < 0.05.
- Citation: Yao M, Cai Y, Wu ZJ, Zhou P, Sai WL, Wang DF, Wang L, Yao DF. Effects of targeted-edited oncogenic insulin-like growth factor-1 receptor with specific-sgRNA on biological behaviors of HepG2 cells. World J Clin Cases 2022; 10(28): 10017-10030
- URL: https://www.wjgnet.com/2307-8960/full/v10/i28/10017.htm
- DOI: https://dx.doi.org/10.12998/wjcc.v10.i28.10017


