Copyright
©The Author(s) 2022.
World J Clin Cases. Sep 16, 2022; 10(26): 9524-9535
Published online Sep 16, 2022. doi: 10.12998/wjcc.v10.i26.9524
Published online Sep 16, 2022. doi: 10.12998/wjcc.v10.i26.9524
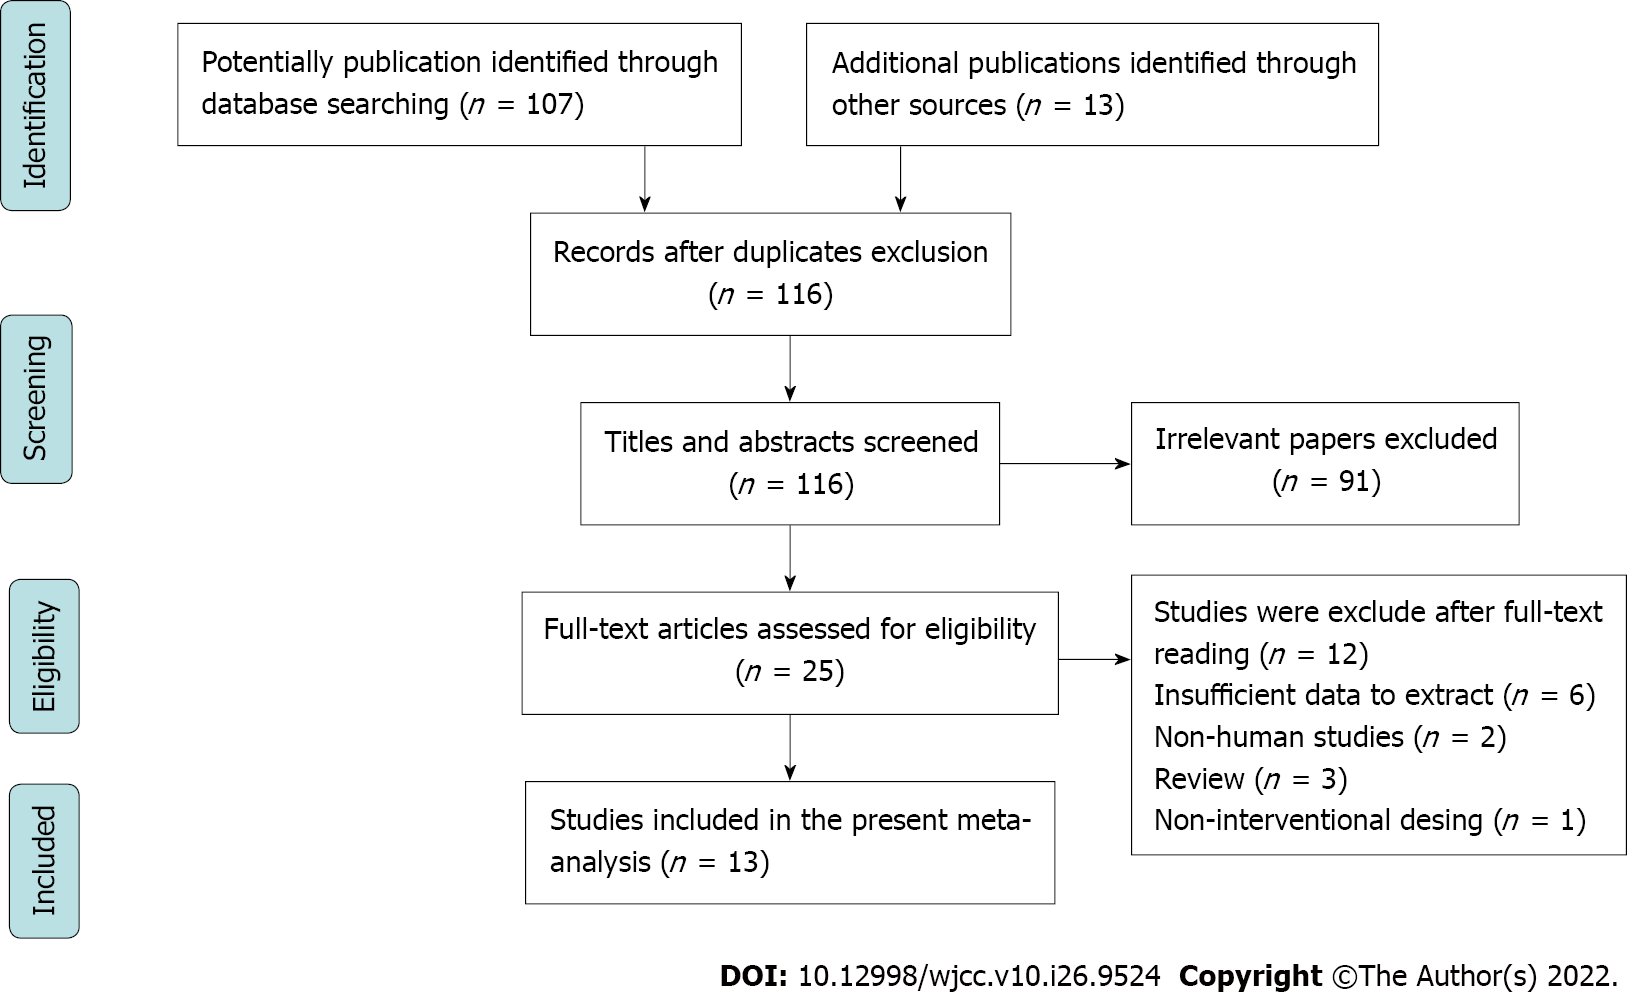
Figure 1 The flow chart depicts the studies that were identified and incorporated in the meta-analysis.
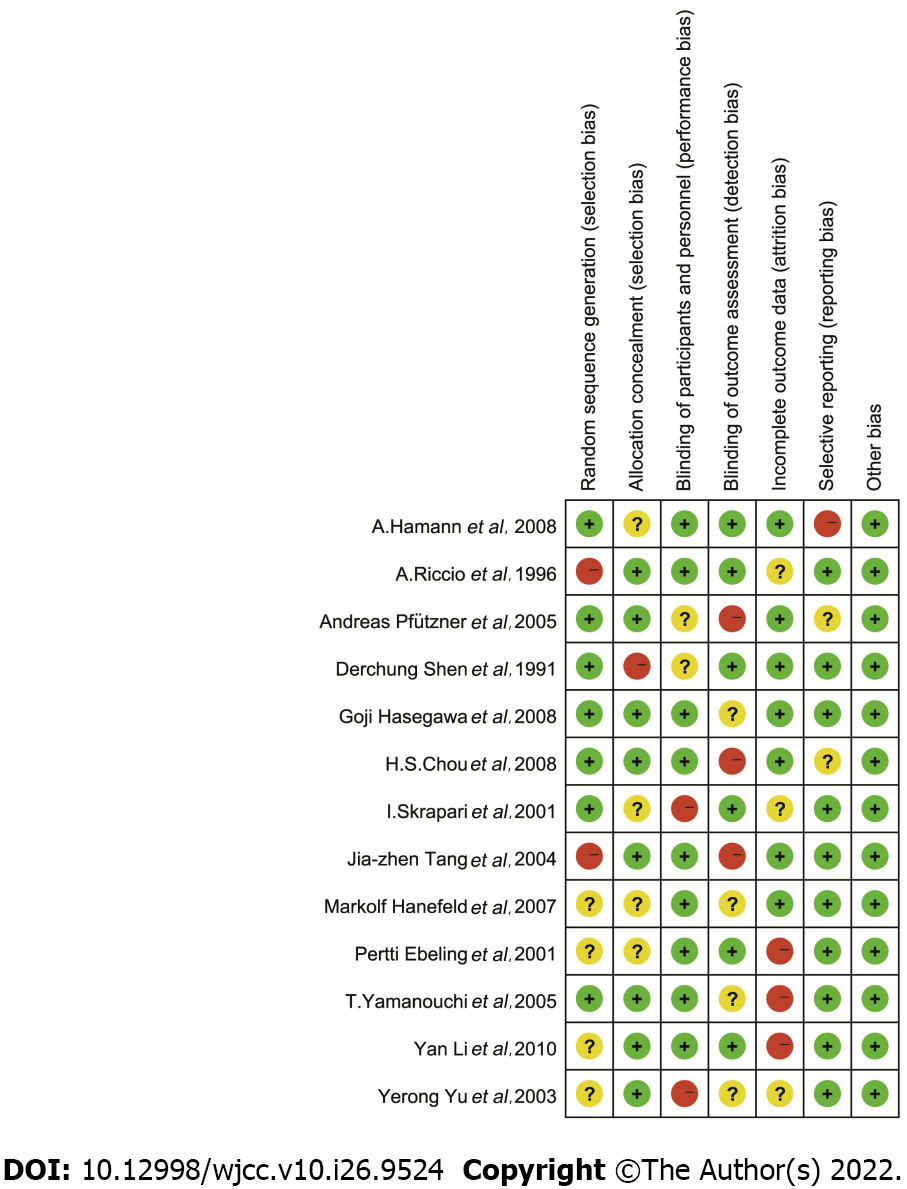
Figure 2 Quality assessment of the studies incorporated in the meta-analysis.
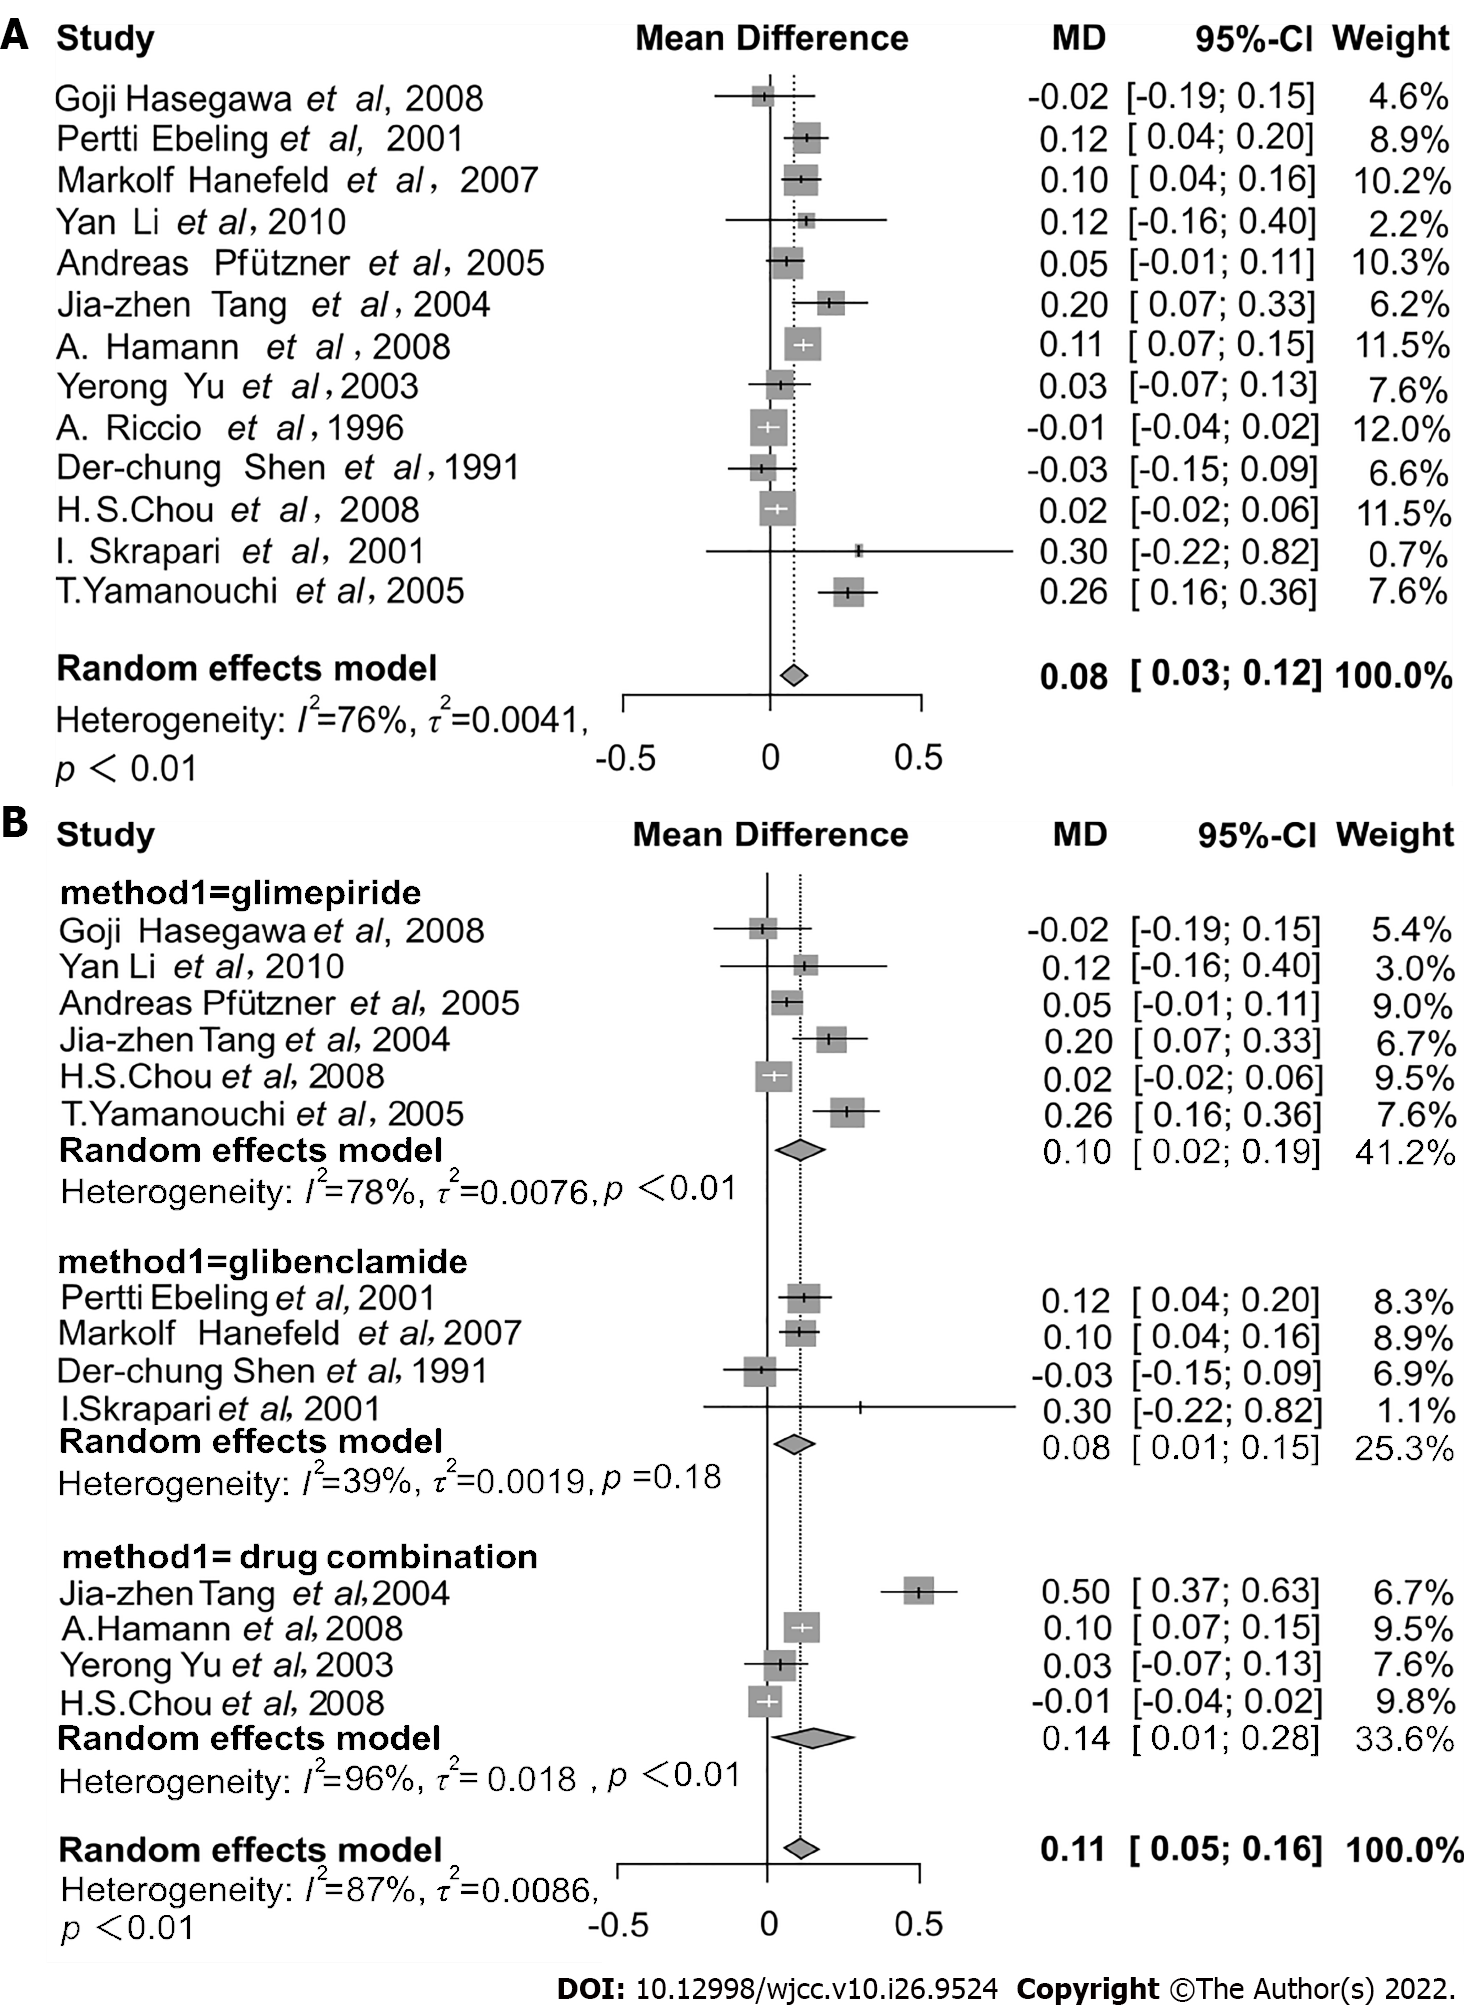
Figure 3 Forest plot.
A: The assessment of overall effects of sulfonylurea therapy on free fatty acid concentration; B: Subgroup analysis assessing the effects of sulfonylurea therapy on free fatty acid concentrations based on different sulfonylurea drugs and forest plot assessing the effects of combination drugs therapy on free fatty acid concentration. CI: Confidence interval; MD: Mean difference.
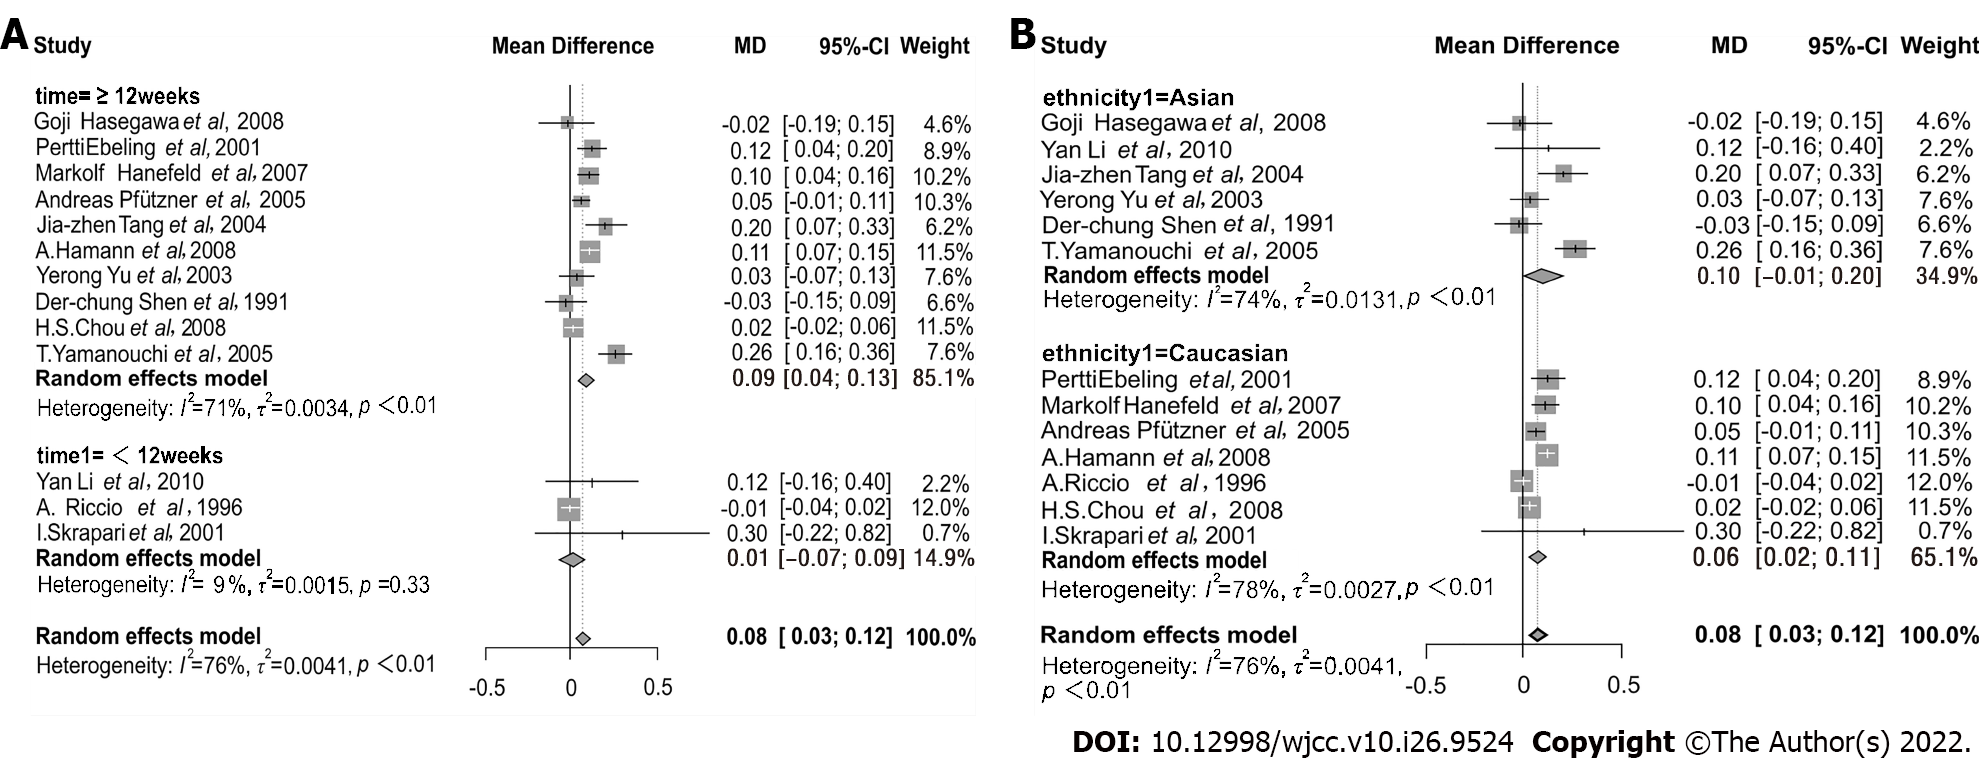
Figure 4 Subgroup analysis.
A: Subgroup analysis assessing the effects of sulfonylurea therapy on free fatty acid concentration based on time duration; B: Subgroup analysis assessing the effects of sulfonylurea therapy on free fatty acid concentration based on ethnicity. CI: Confidence interval; MD: Mean difference.
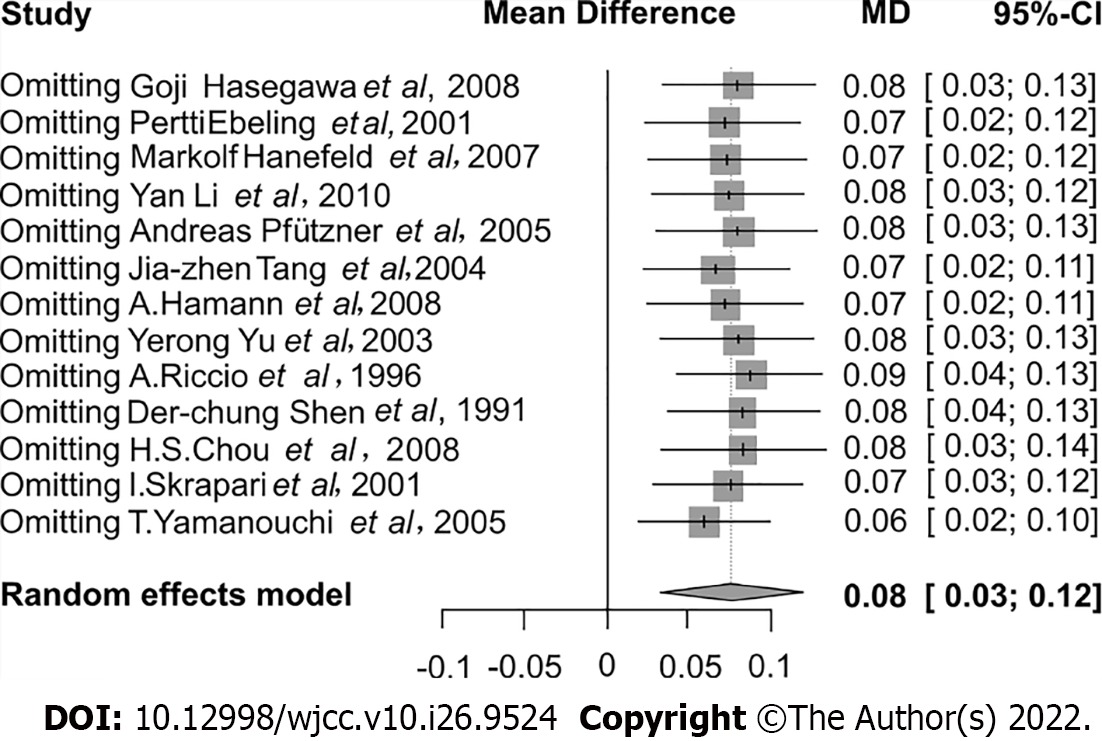
Figure 5 Sensitivity analysis among included studies, reporting the effects of sulfonylurea treatment on free fatty acid concentration.
CI: Confidence interval; MD: Mean difference.
- Citation: Yu M, Feng XY, Yao S, Wang C, Yang P. Certain sulfonylurea drugs increase serum free fatty acid in diabetic patients: A systematic review and meta-analysis. World J Clin Cases 2022; 10(26): 9524-9535
- URL: https://www.wjgnet.com/2307-8960/full/v10/i26/9524.htm
- DOI: https://dx.doi.org/10.12998/wjcc.v10.i26.9524


