Copyright
©The Author(s) 2022.
World J Clin Cases. Sep 16, 2022; 10(26): 9484-9492
Published online Sep 16, 2022. doi: 10.12998/wjcc.v10.i26.9484
Published online Sep 16, 2022. doi: 10.12998/wjcc.v10.i26.9484
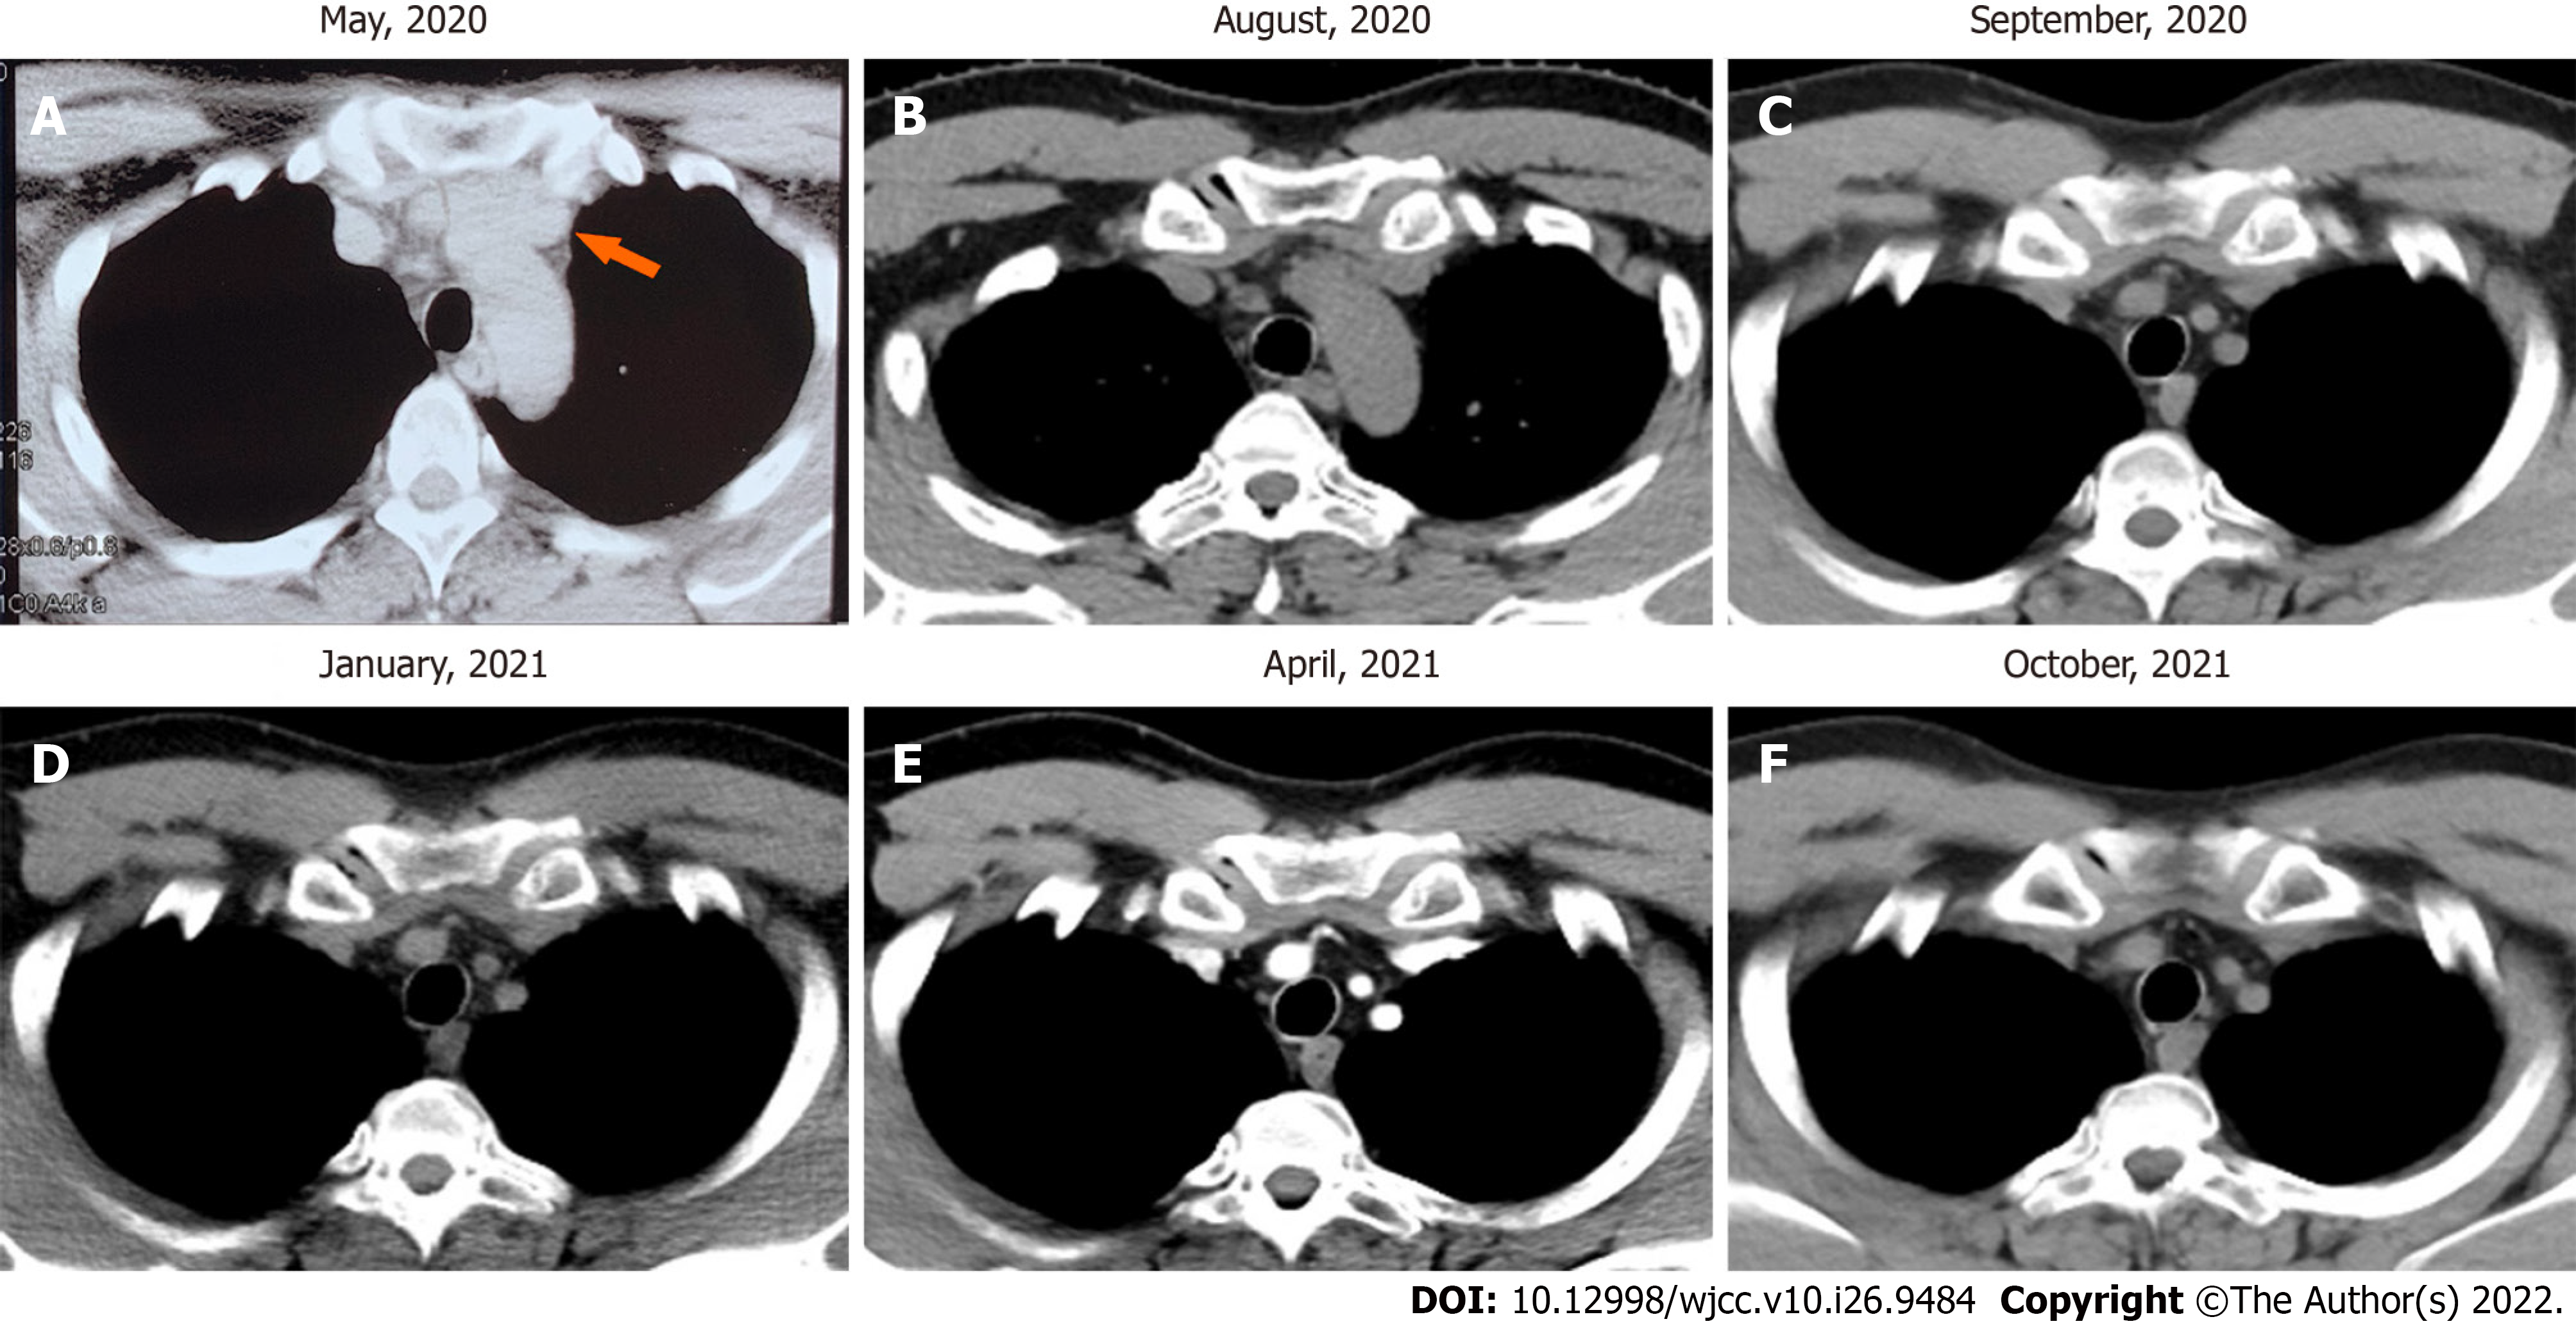
Figure 1 Preoperative chest computed tomography scan (tumor site was indicated by orange arrow) and postoperative computed tomography scan over time.
A: Computed tomography (CT) scan image shows thymus mass before surgery; B-F: CT scan images show anterior mediastina region after surgery.
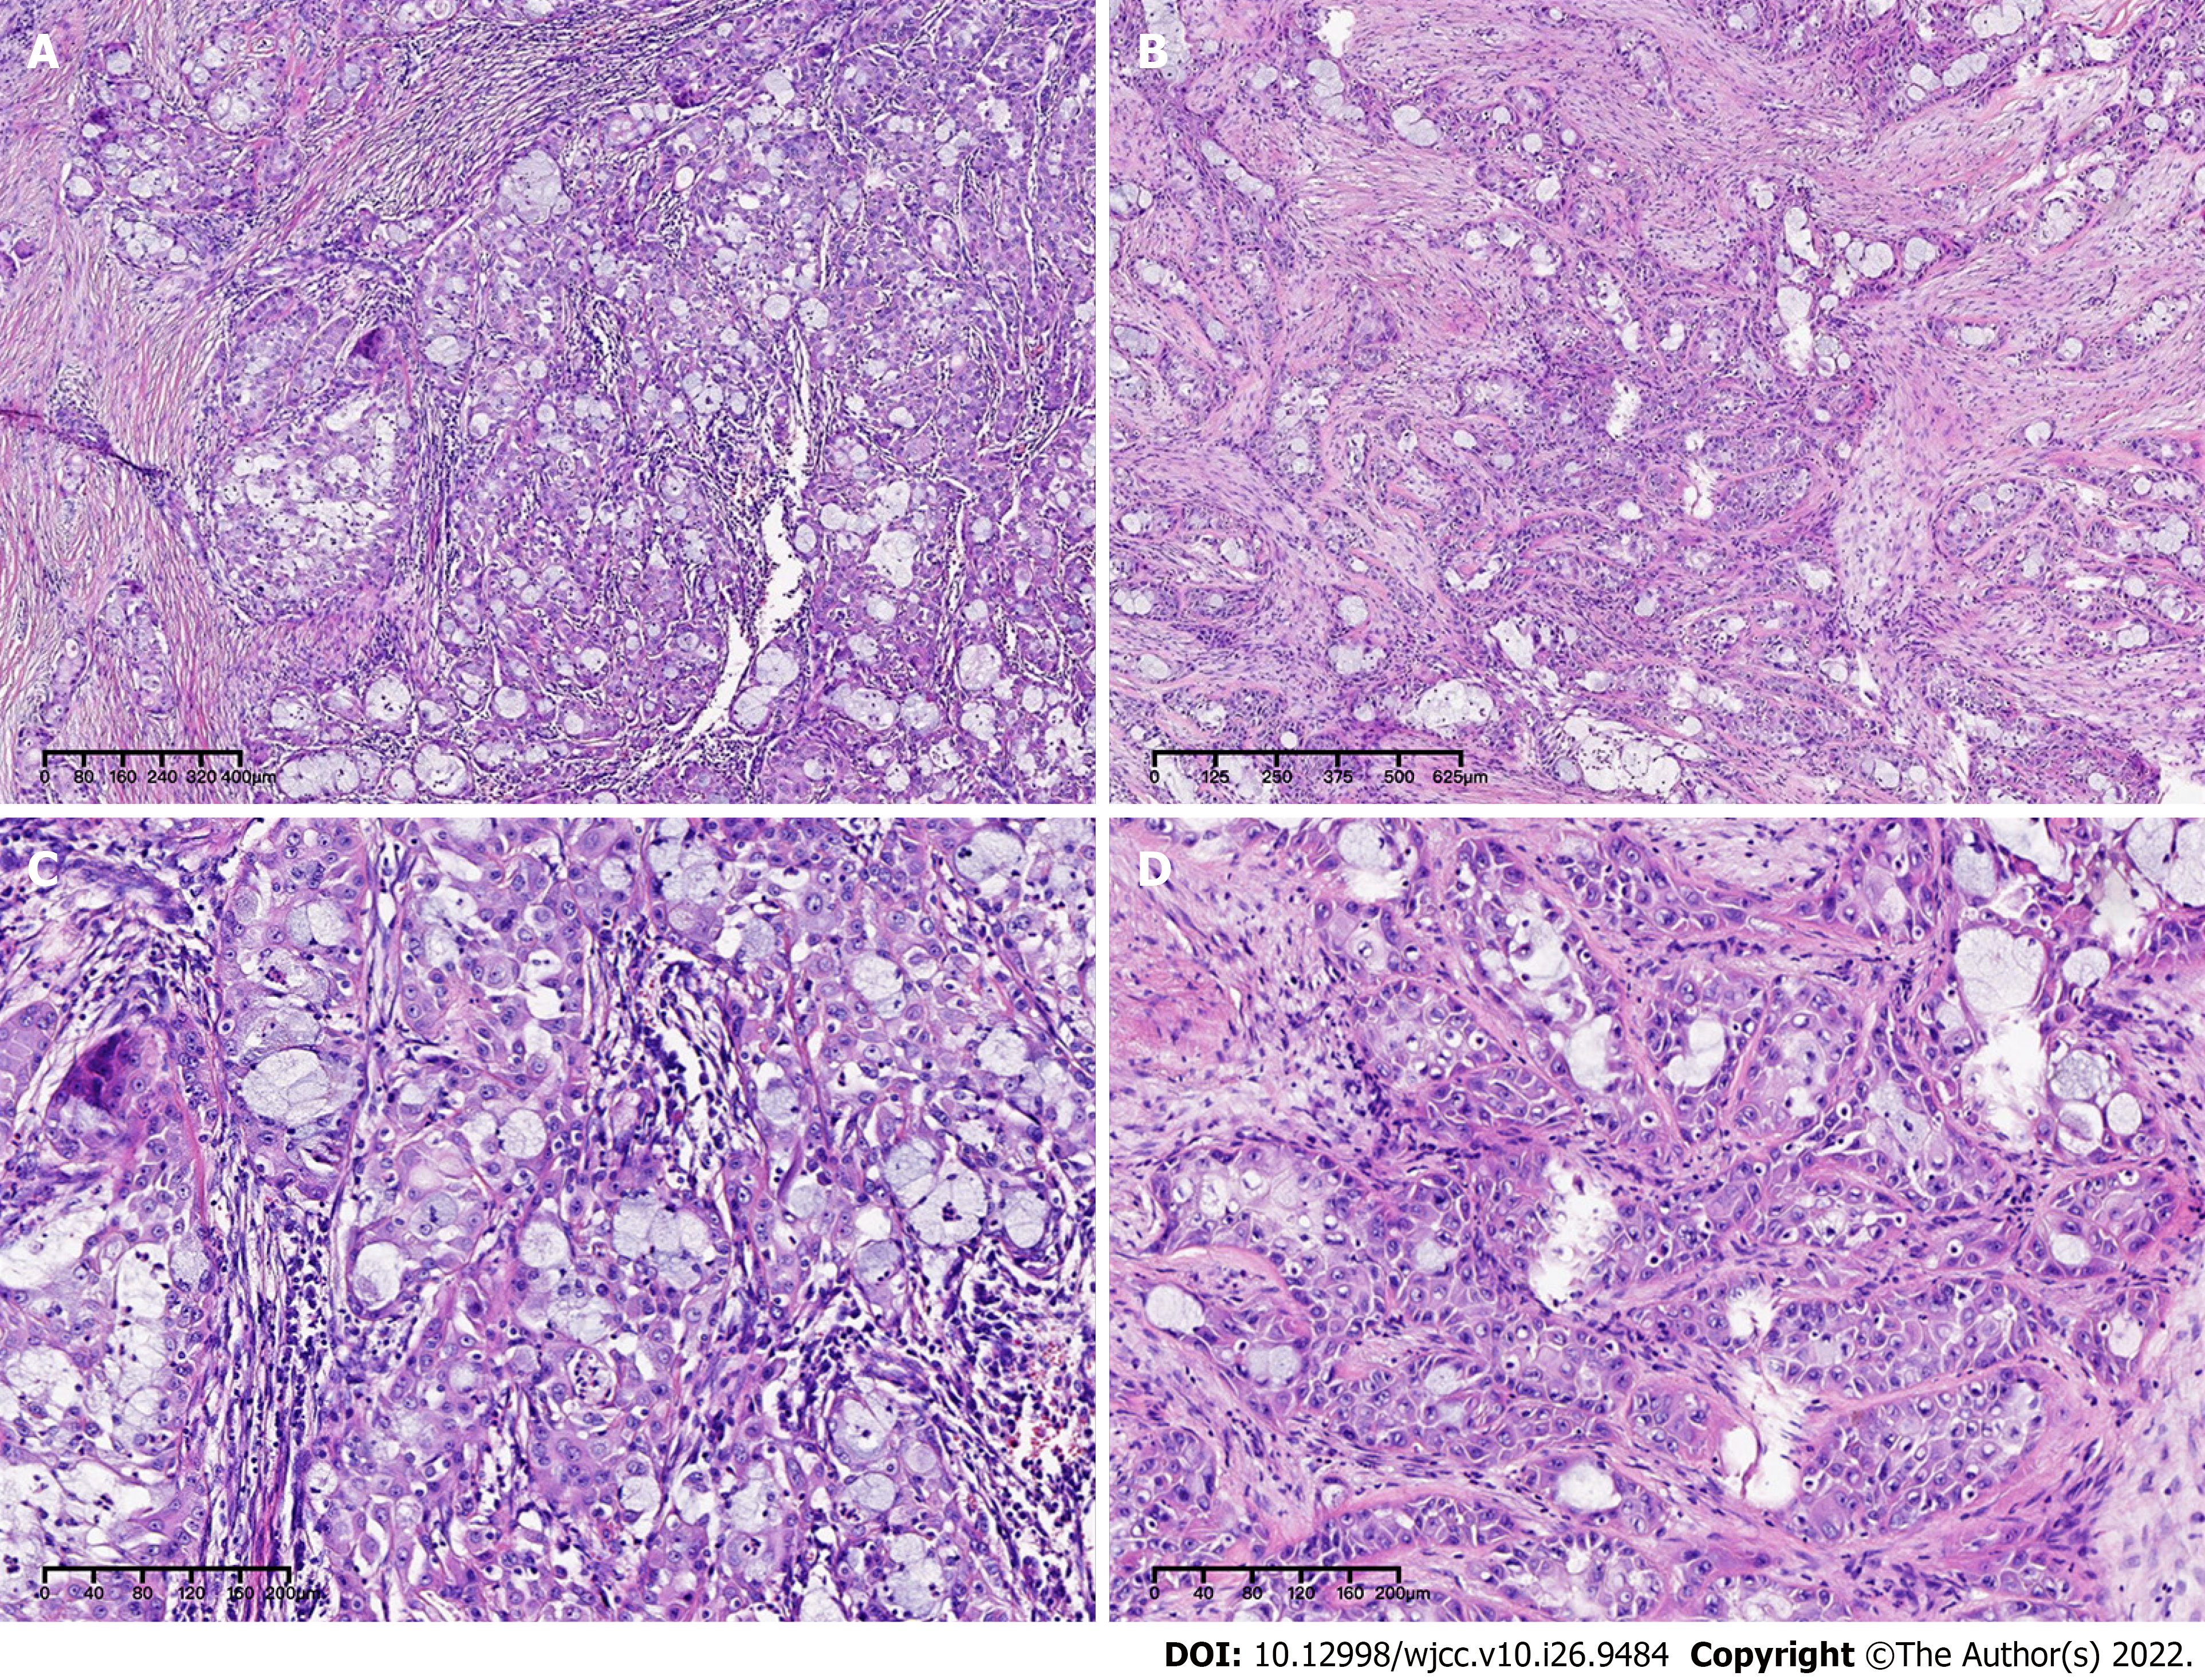
Figure 2 Postoperative HE stained histopathological images at 4 × magnification in the first row and 10 × magnification in the second row.
A and C: Mass HE stained microstructure at 4 × magnification; B and D: Mass HE stained microstructure at 10 × magnification.
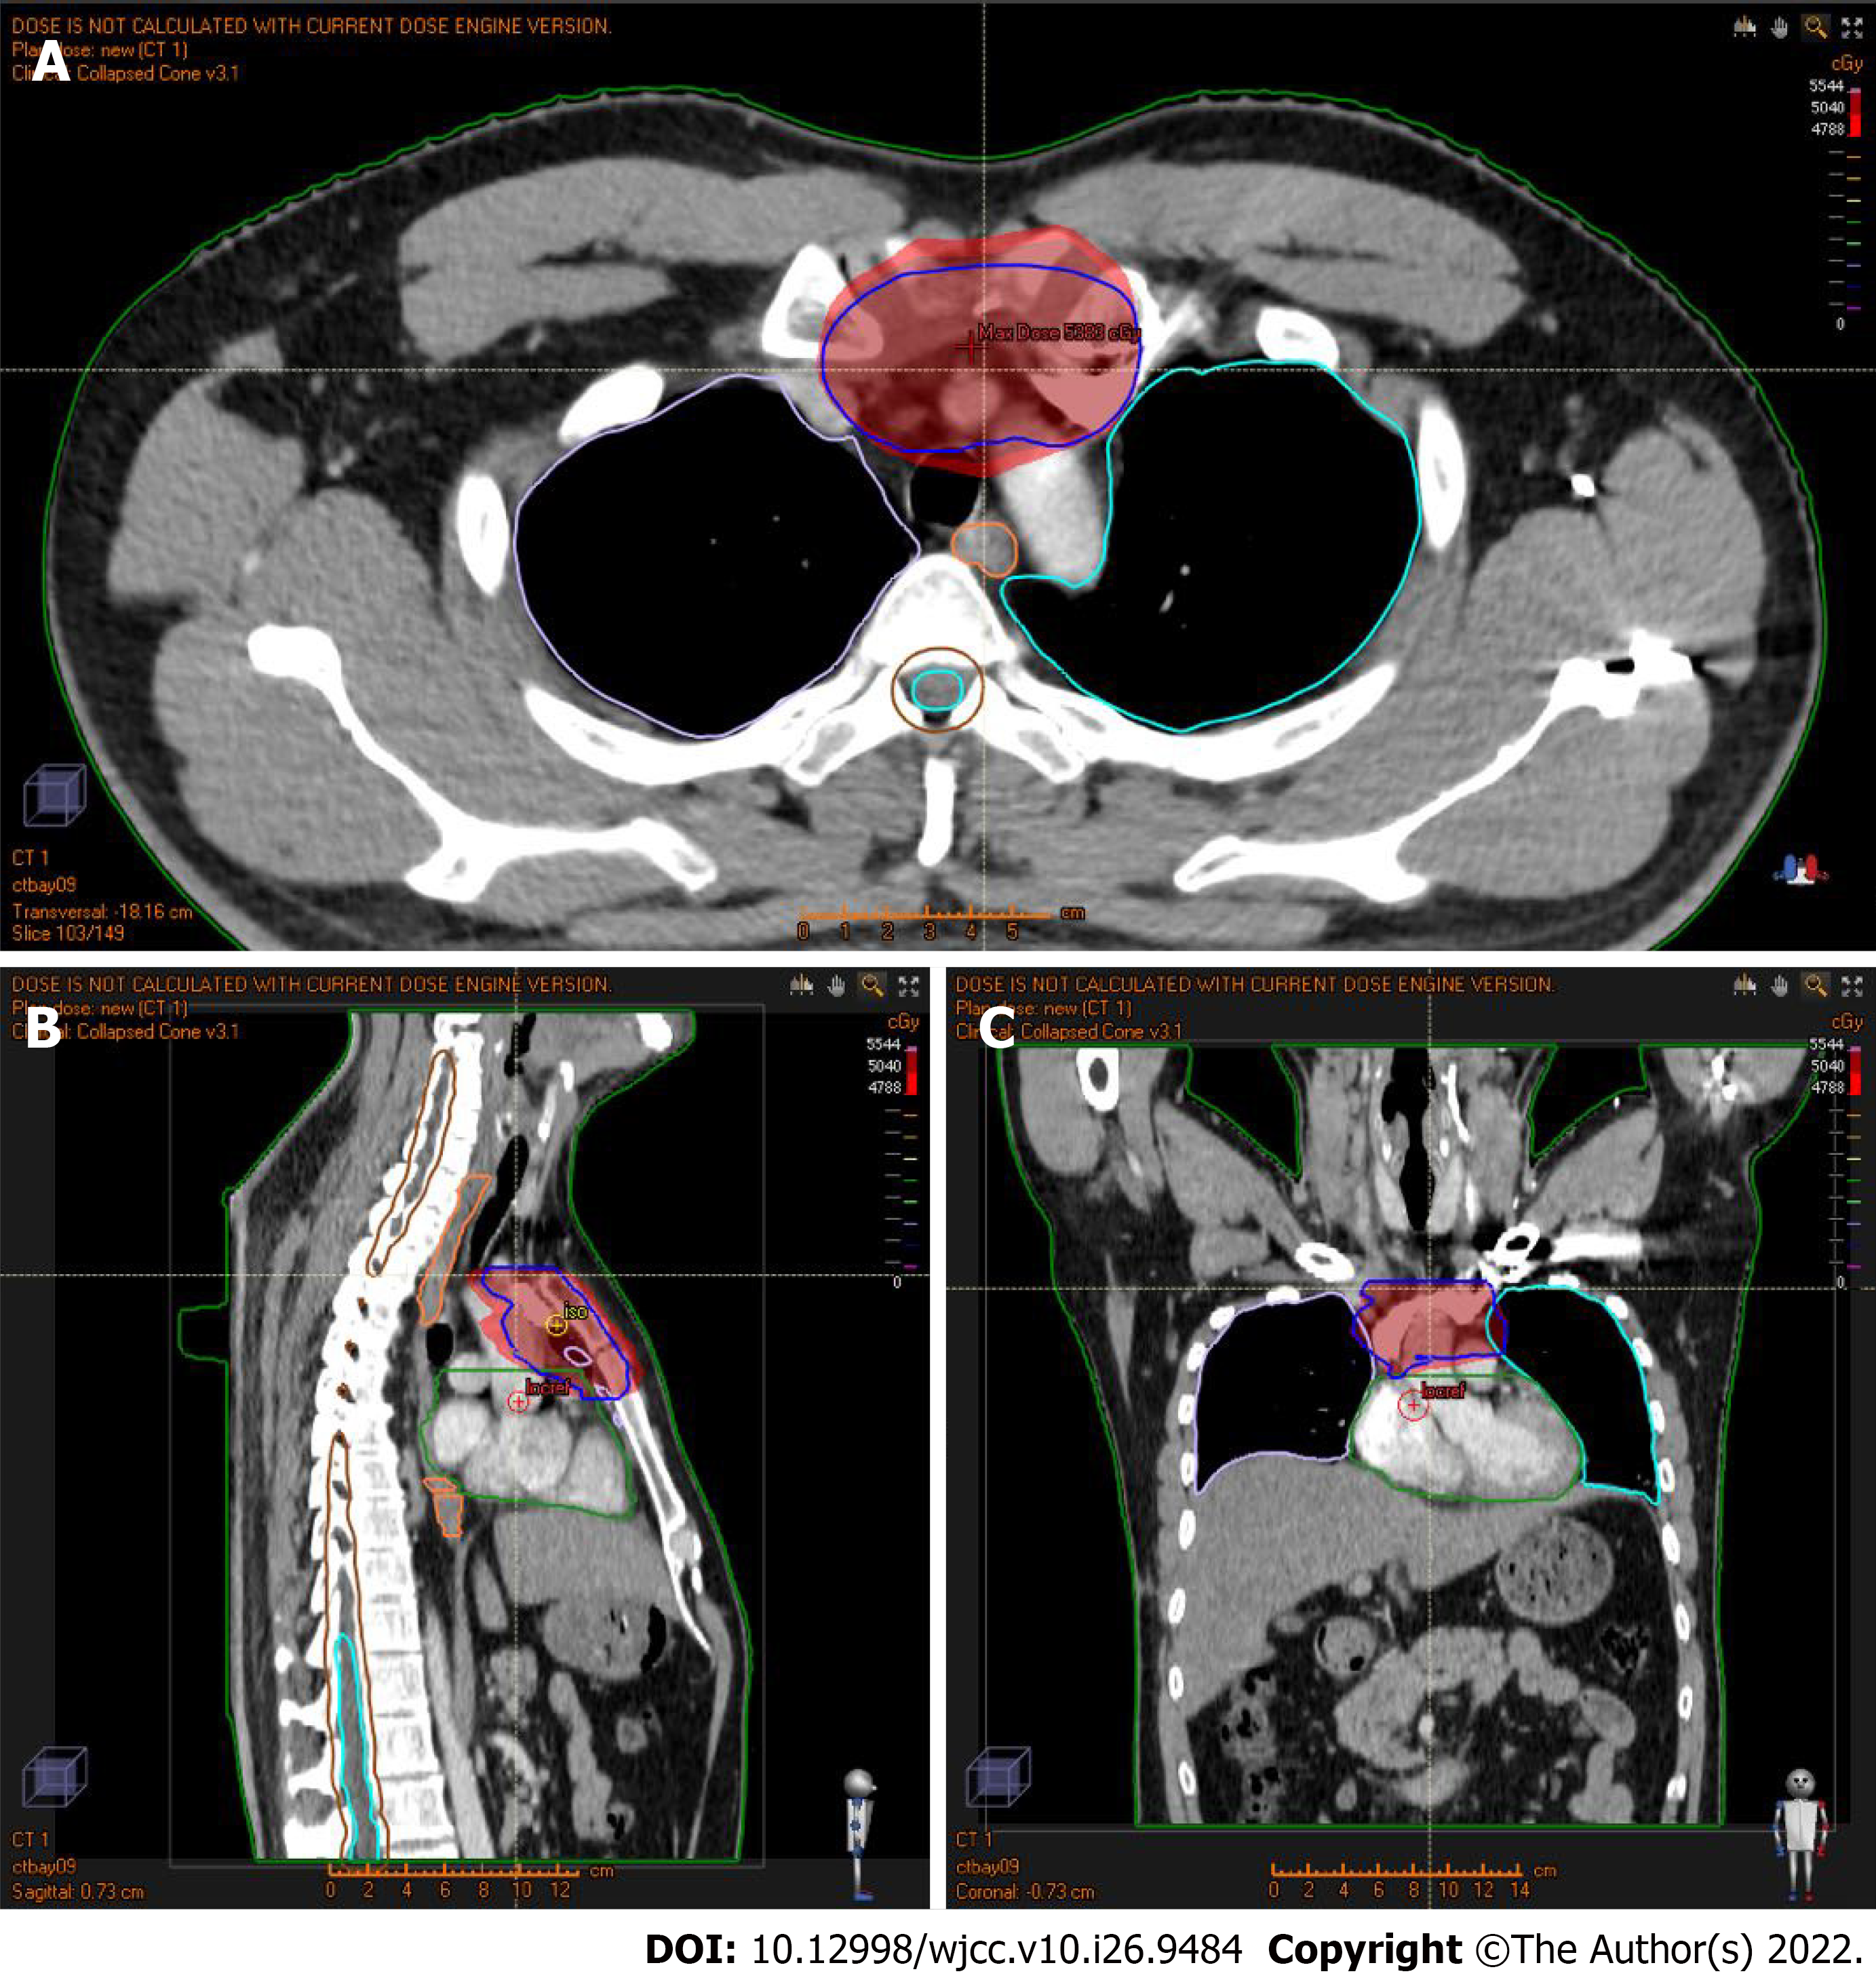
Figure 3 A three-dimensional dose distribution map of the patient's local intensity-modulated radiotherapy (the blue line represents the delineated target area, the dark red area was the dose range of 50.
4 Gy, and the bright red area was the dose range of 47.88 Gy). A: Radiation dose distribution in the transverse position; B: Radiation dose distribution in the sagittal position; and C: Radiation dose distribution in the coronal position.
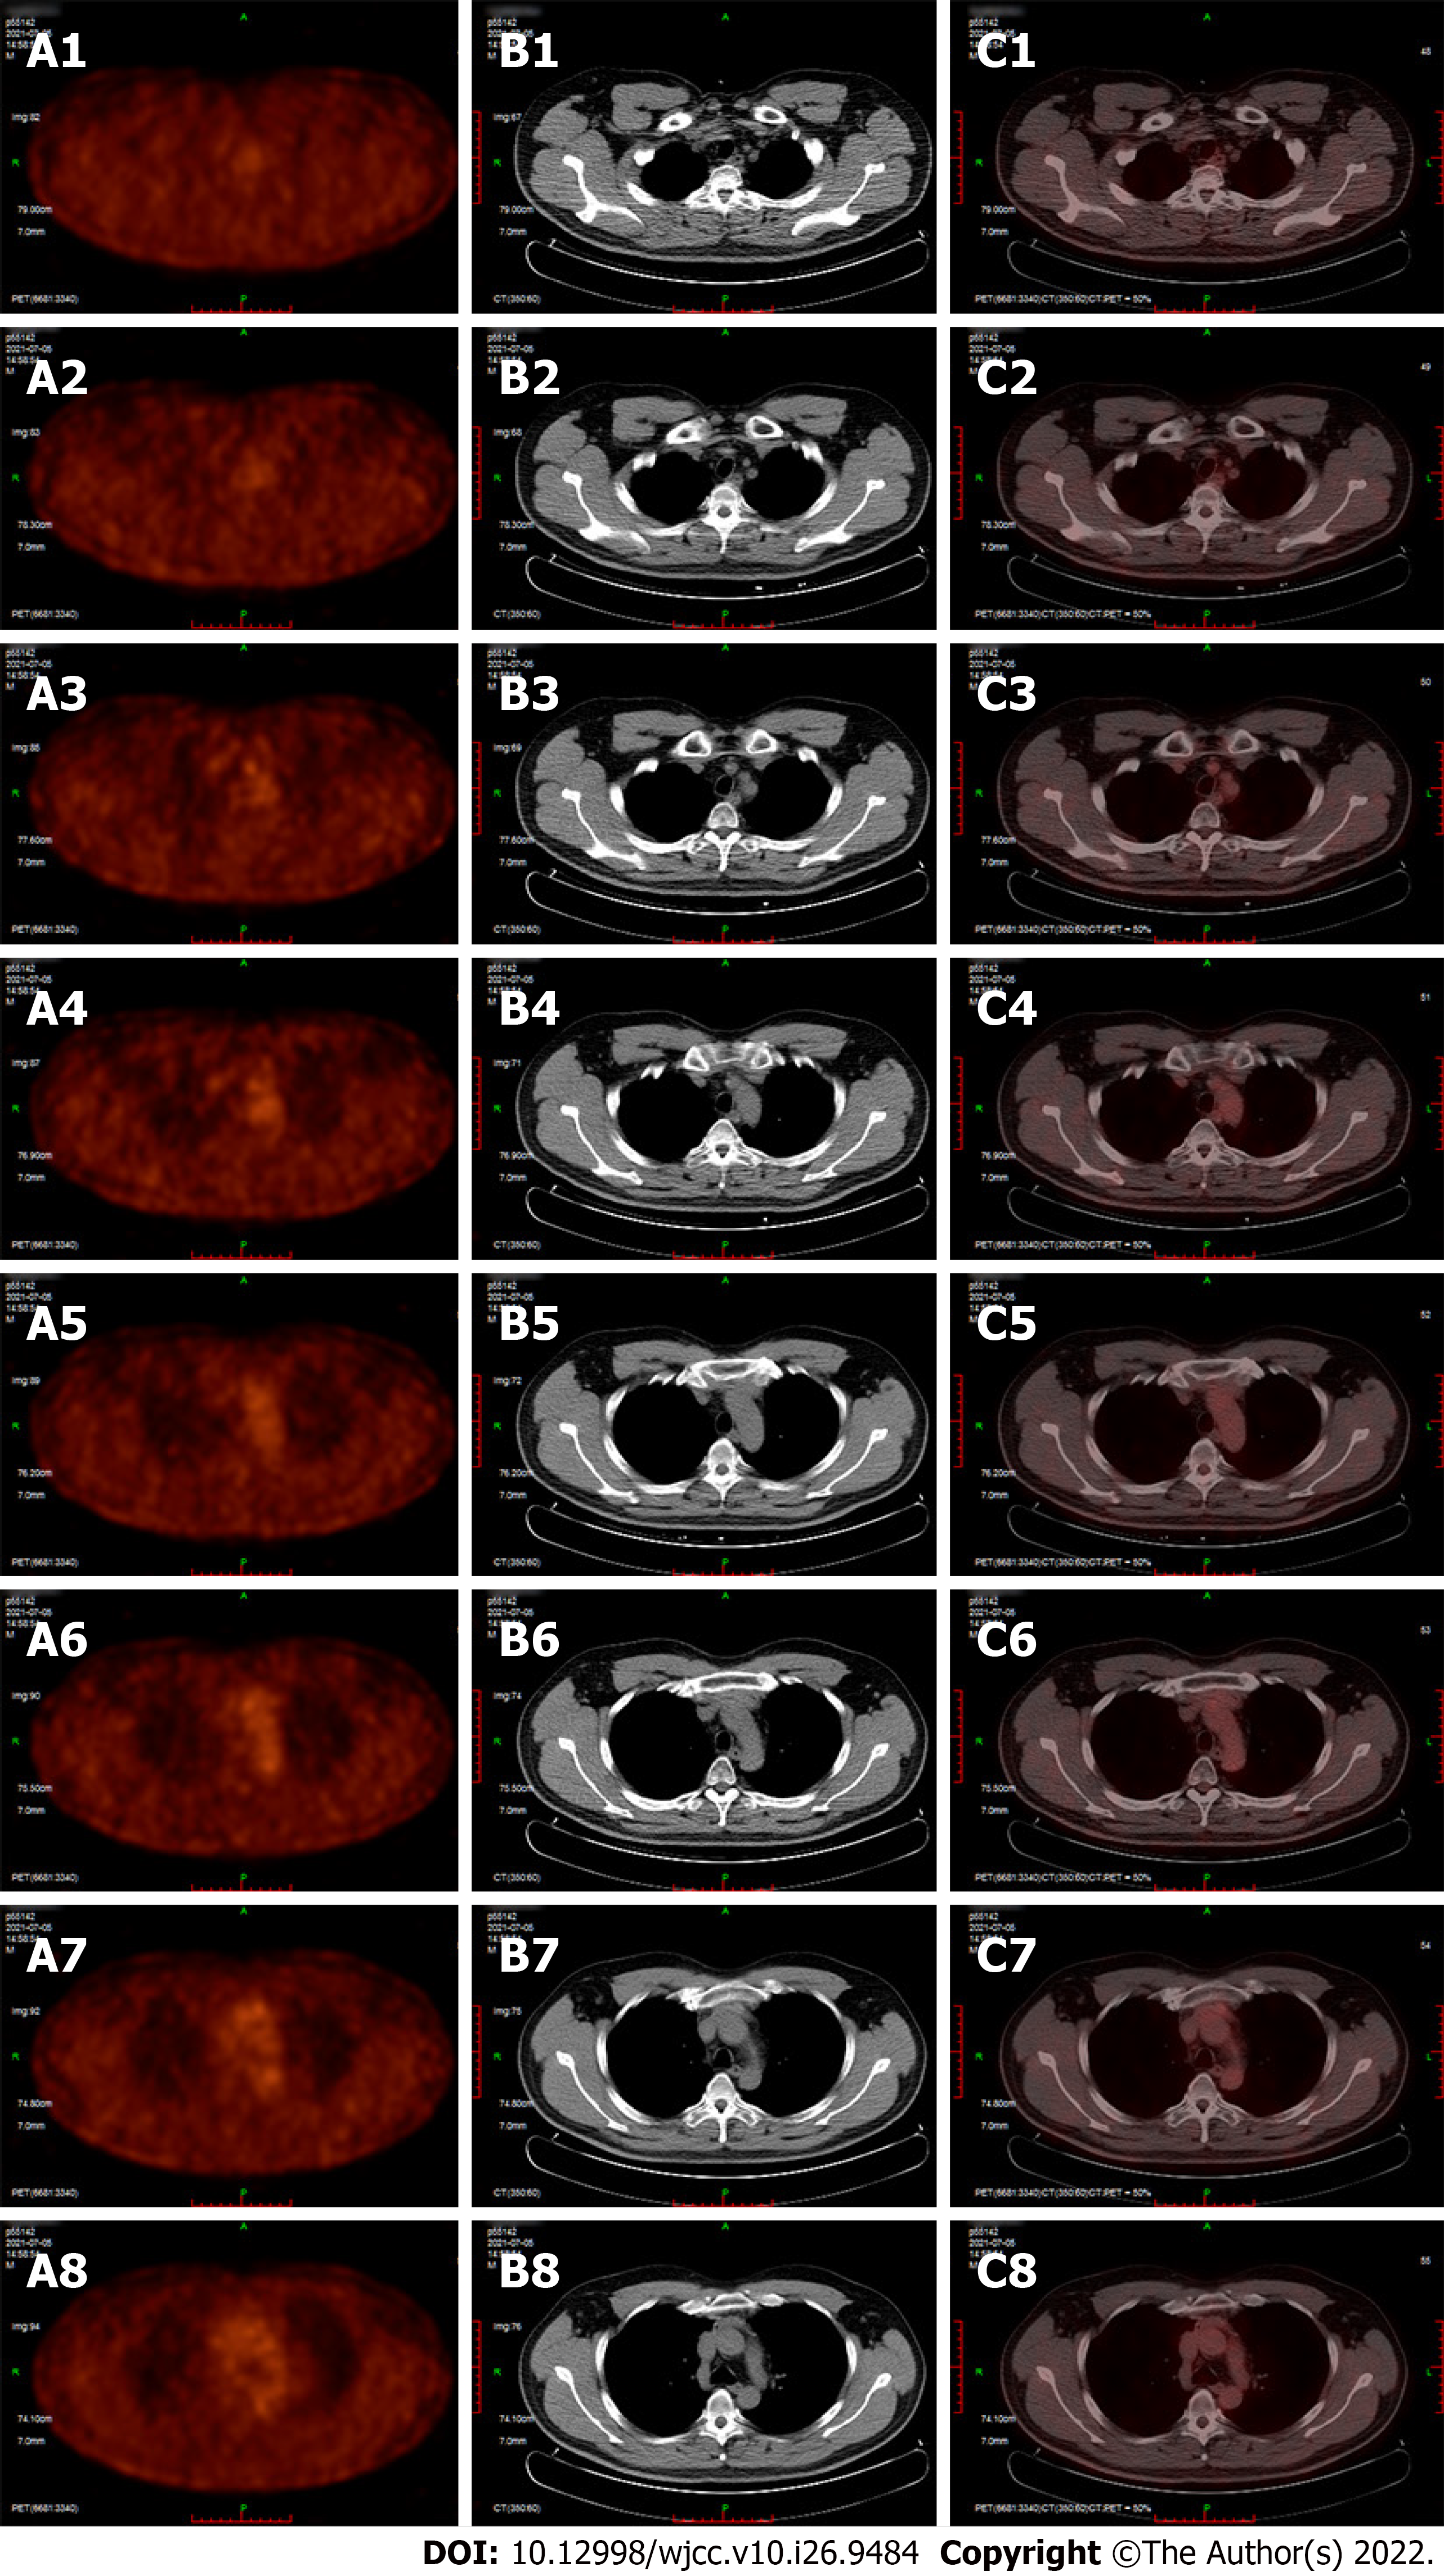
Figure 4 A positron emission tomography-computed tomography image of the patient's chest 12 mo after surgery.
A1-A8: The glucose metabolism map of each layer of the anterior mediastinum; B1-B8: The ordinary computed tomography image of each layer of the anterior mediastinum; C1-C8: Displayed as the picture after the combination of group A pictures and group B pictures.
- Citation: Deng R, Li NJ, Bai LL, Nie SH, Sun XW, Wang YS. Postoperative radiotherapy for thymus salivary gland carcinoma: A case report. World J Clin Cases 2022; 10(26): 9484-9492
- URL: https://www.wjgnet.com/2307-8960/full/v10/i26/9484.htm
- DOI: https://dx.doi.org/10.12998/wjcc.v10.i26.9484


