Copyright
©The Author(s) 2022.
World J Clin Cases. Sep 16, 2022; 10(26): 9470-9477
Published online Sep 16, 2022. doi: 10.12998/wjcc.v10.i26.9470
Published online Sep 16, 2022. doi: 10.12998/wjcc.v10.i26.9470
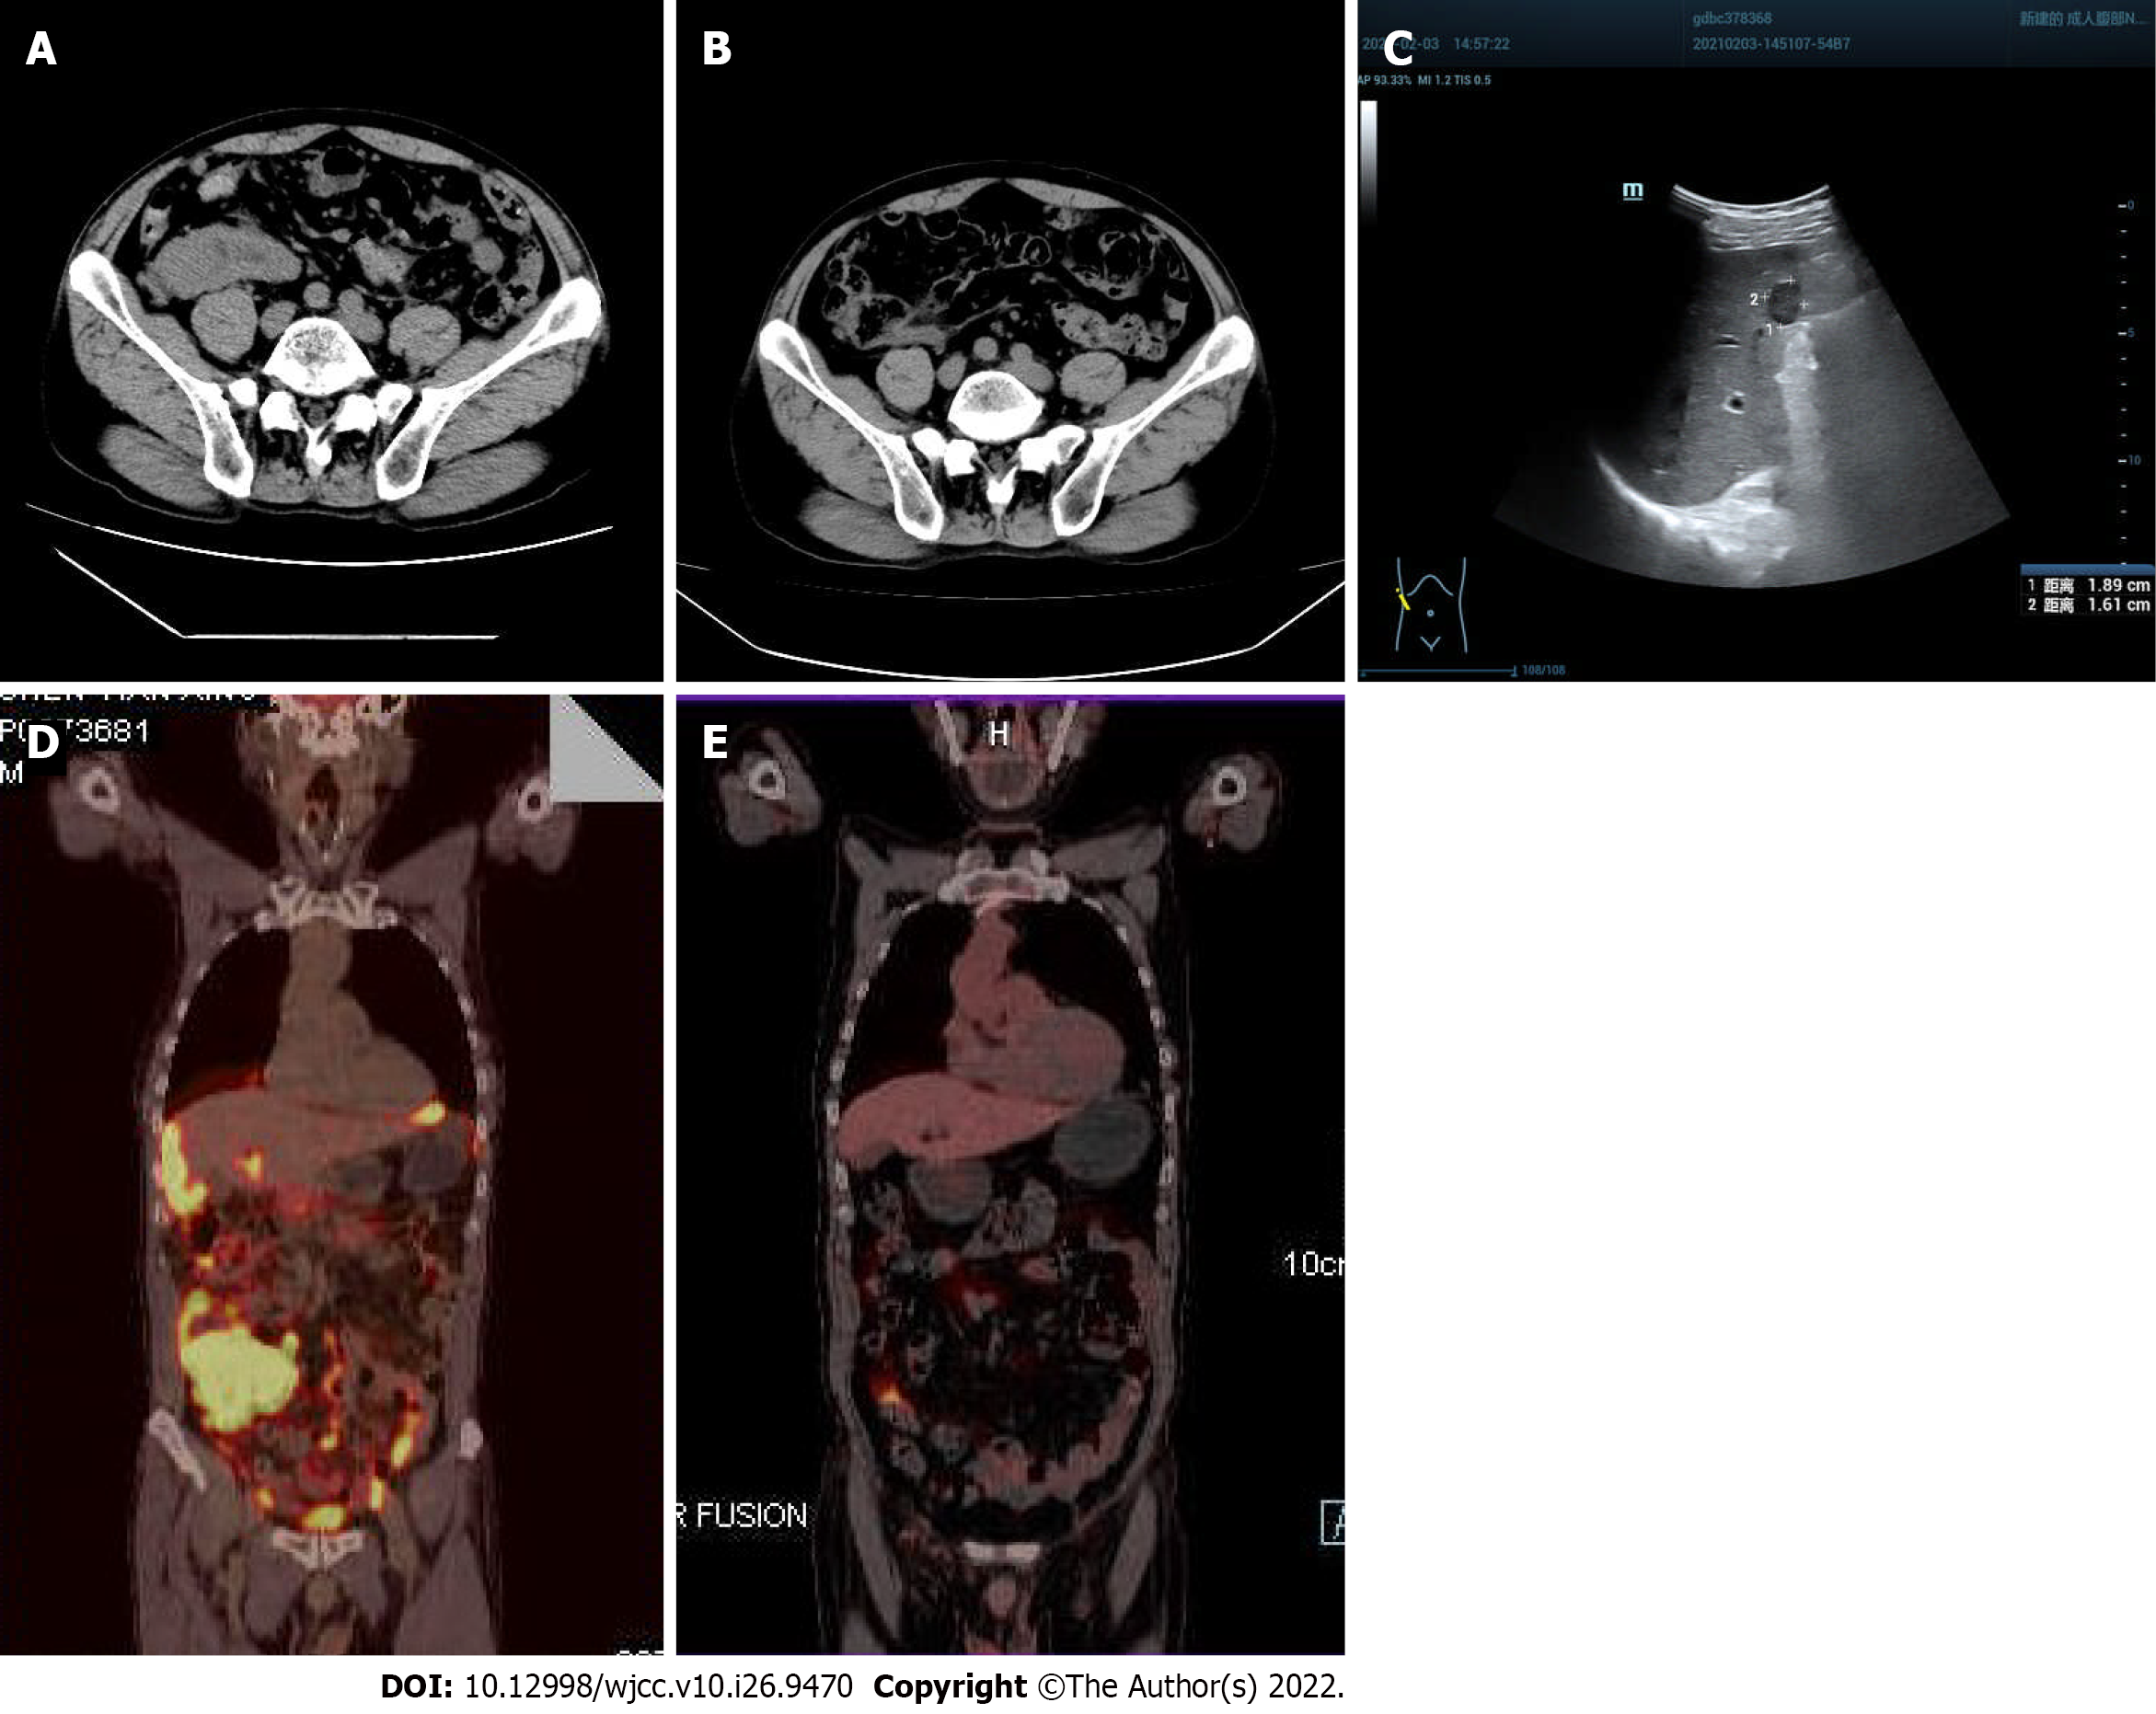
Figure 1 Imaging findings.
A: On January 29, 2021, computed tomography (CT) showed multiple space-occupying lesions in the ileocecal bowel, peritoneum and omentum, and the boundary with the right psoas major muscle was unclear (red arrow); B: After 3 courses of chemotherapy, CT showed that the multiple space- occupying lesions in the ileocecal bowel, peritoneum and omentum had significantly shrunk, and the boundary with the right psoas major muscle was obvious (red arrow); C: On February 3, 2021, B-ultrasound showed a solid hypoechoic mass 1.89 cm × 1.61 cm in size with a clear boundary in the lower segment of the right anterior lobe (red arrow); D: On March 12, 2021, positron emission tomography (PET)-CT showed a soft tissue mass shadow in the liver and right lower abdomen, surrounding the ileocecal junction, with a maximum standardized uptake value of 30.3. Radioactive uptake in the hepatic capsule margin, abdominal and pelvic mesangium and omentum was significantly increased; E: On September 24, 2021, after 6 courses of chemotherapy, PET-CT showed that there was no obvious mass or increased fluorodeoxyglucose metabolism in the abdominal and pelvic peritoneal mesangium, and no obvious increased radioactive uptake in the liver (white arrow).
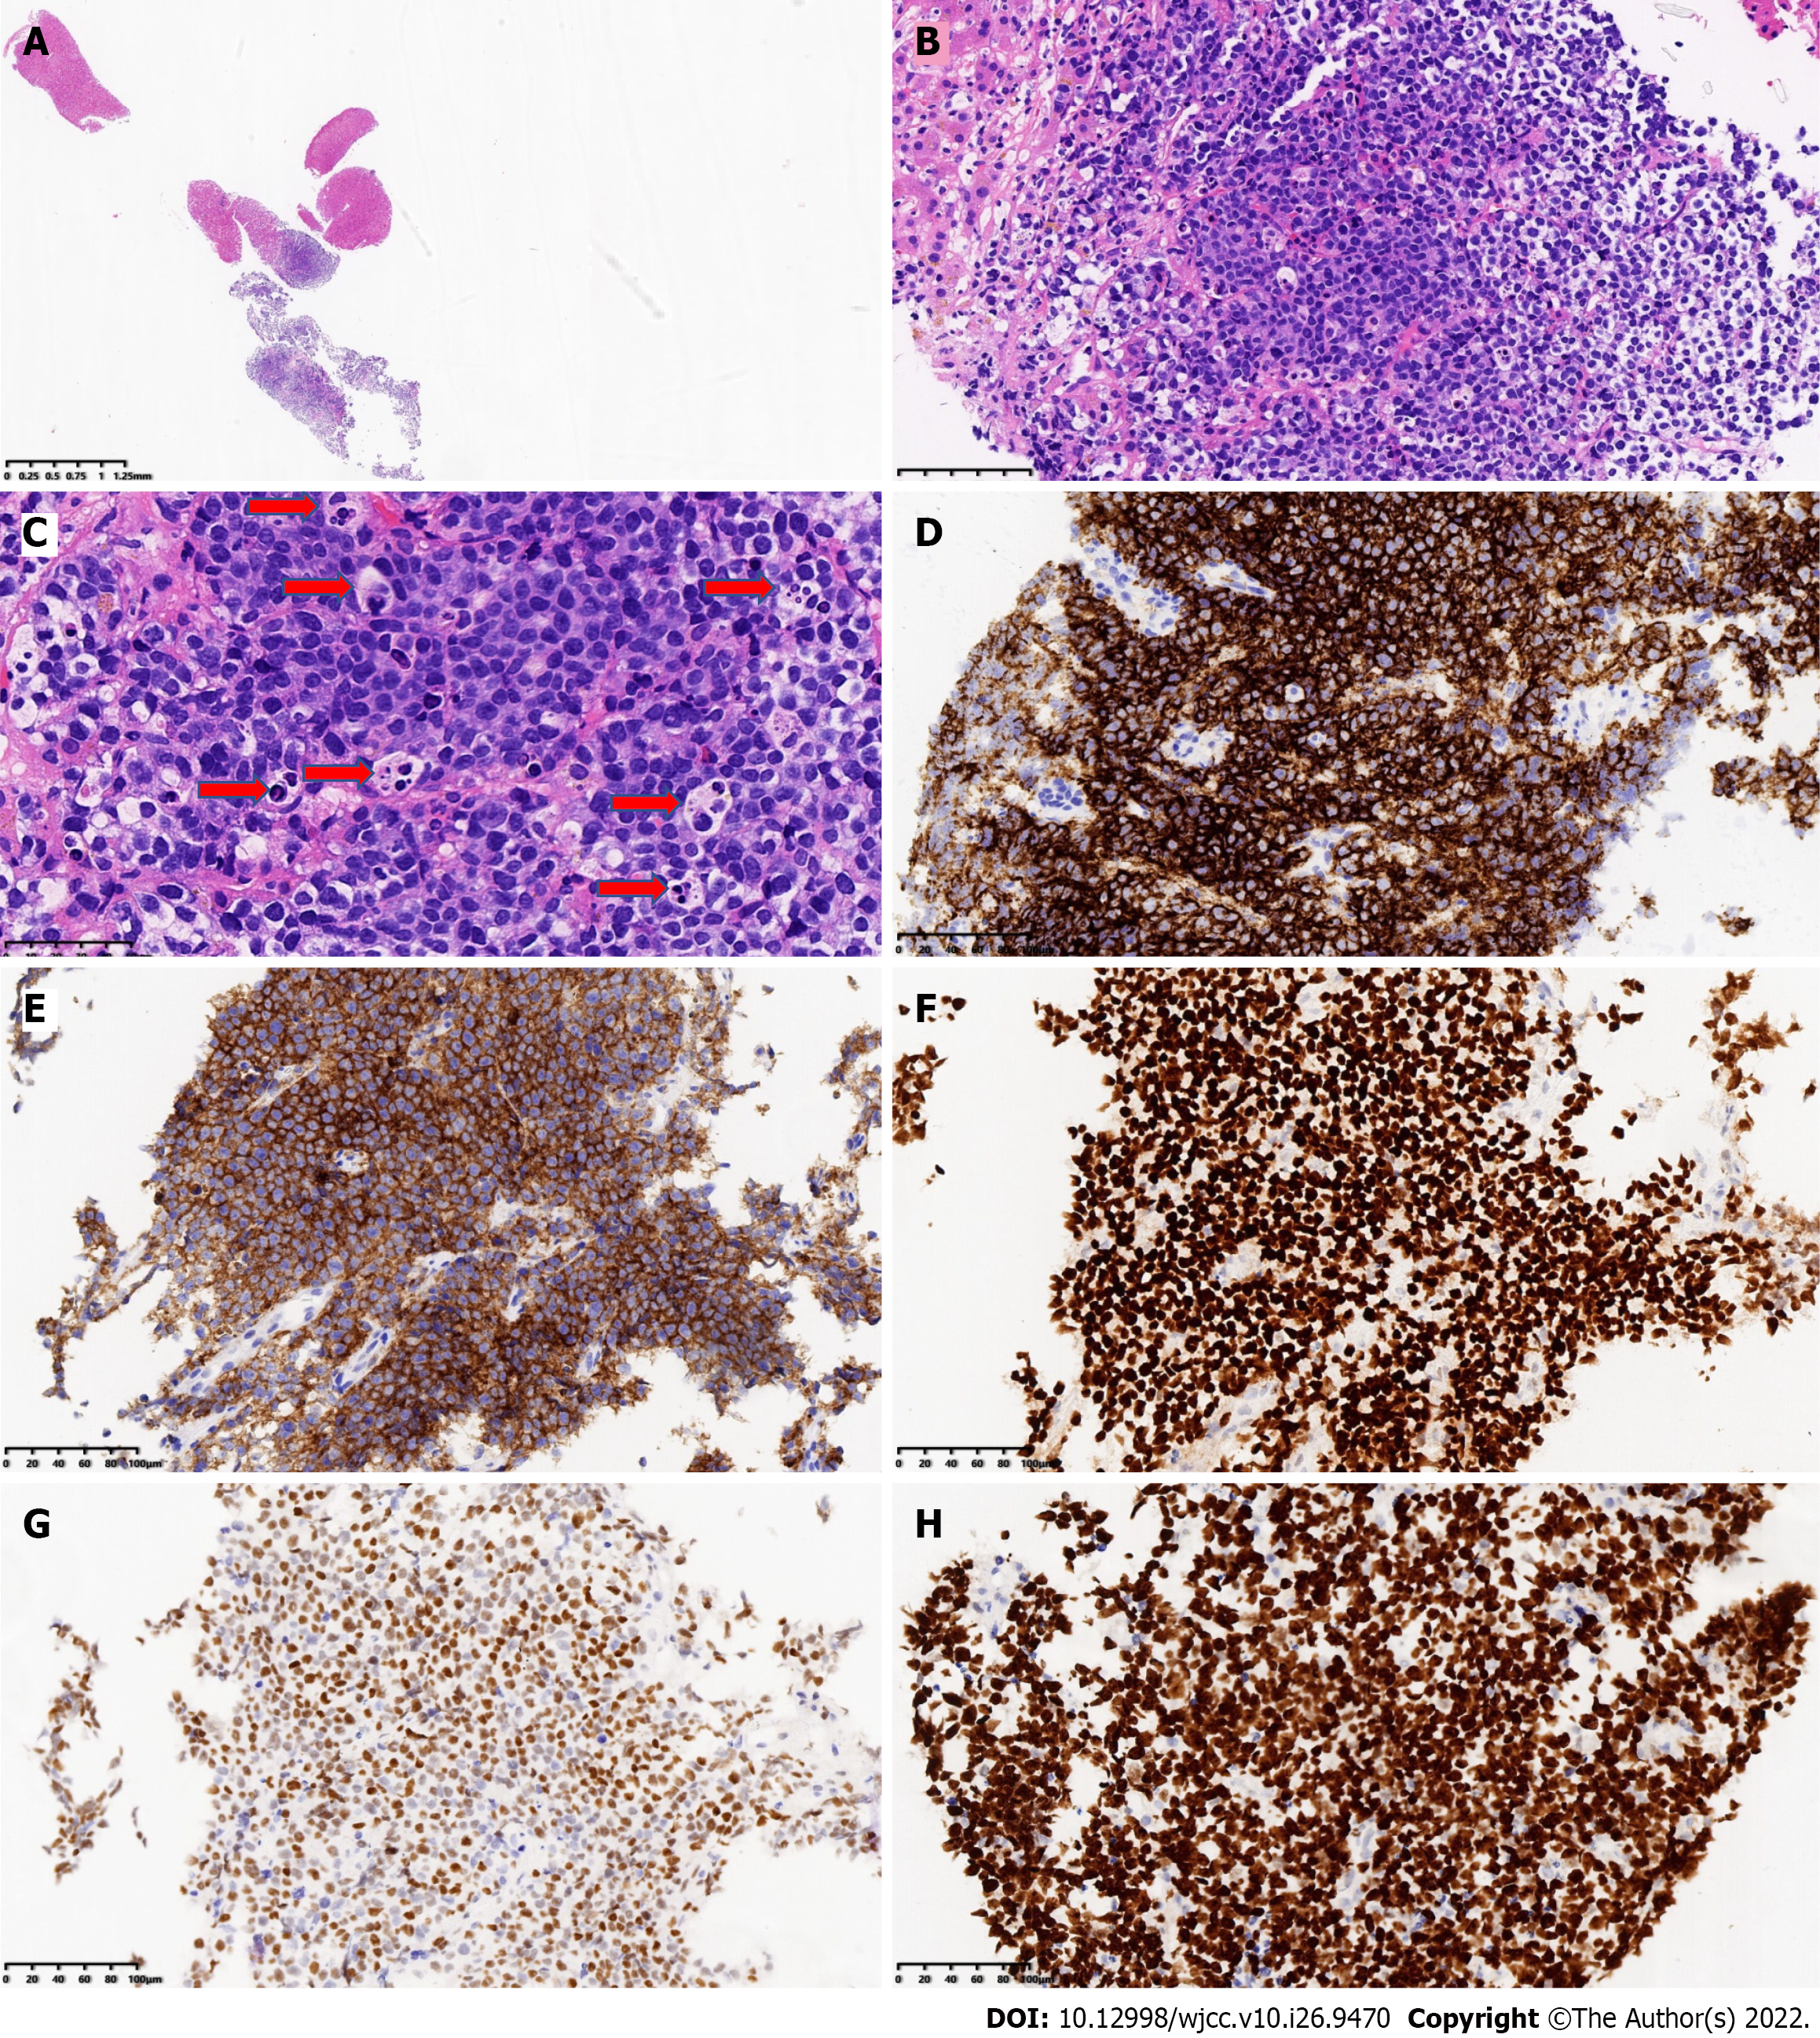
Figure 2 Pathological findings.
A: Fine needle biopsy of the liver showed liver tissue and tumor tissue (low magnification of HE staining); B: The tumor cells are medium-large, consistent in shape, with a starry sky pattern, liver tissue found in the left and upper right corners (HE staining 200 × magnification); C: Tumor cells have little cytoplasm, with basophilic, fine granular nuclear staining; tissue cells phagocytize apoptotic debris and nuclear fragments; it can be seen that there is multiple apoptotic debris (six) with coarse particles (red arrow) (HE staining 400 × magnification); D: CD20 Labeling of tumor cells was diffuse and strongly positive (Envision method 200 × magnification); E: CD10 labeling of tumor cells was diffuse and strongly positive (Envision method 200 × magnification); F: BCL6 Labeling of tumor cells was diffuse and strongly positive (Envision method 200 × magnification); G: Tumor cells were positive for MYC labeling (70%) (Envision method 200 × magnification); H: Ki-67 proliferation index of tumor cells > 95% (Envision method 200 × magnification).
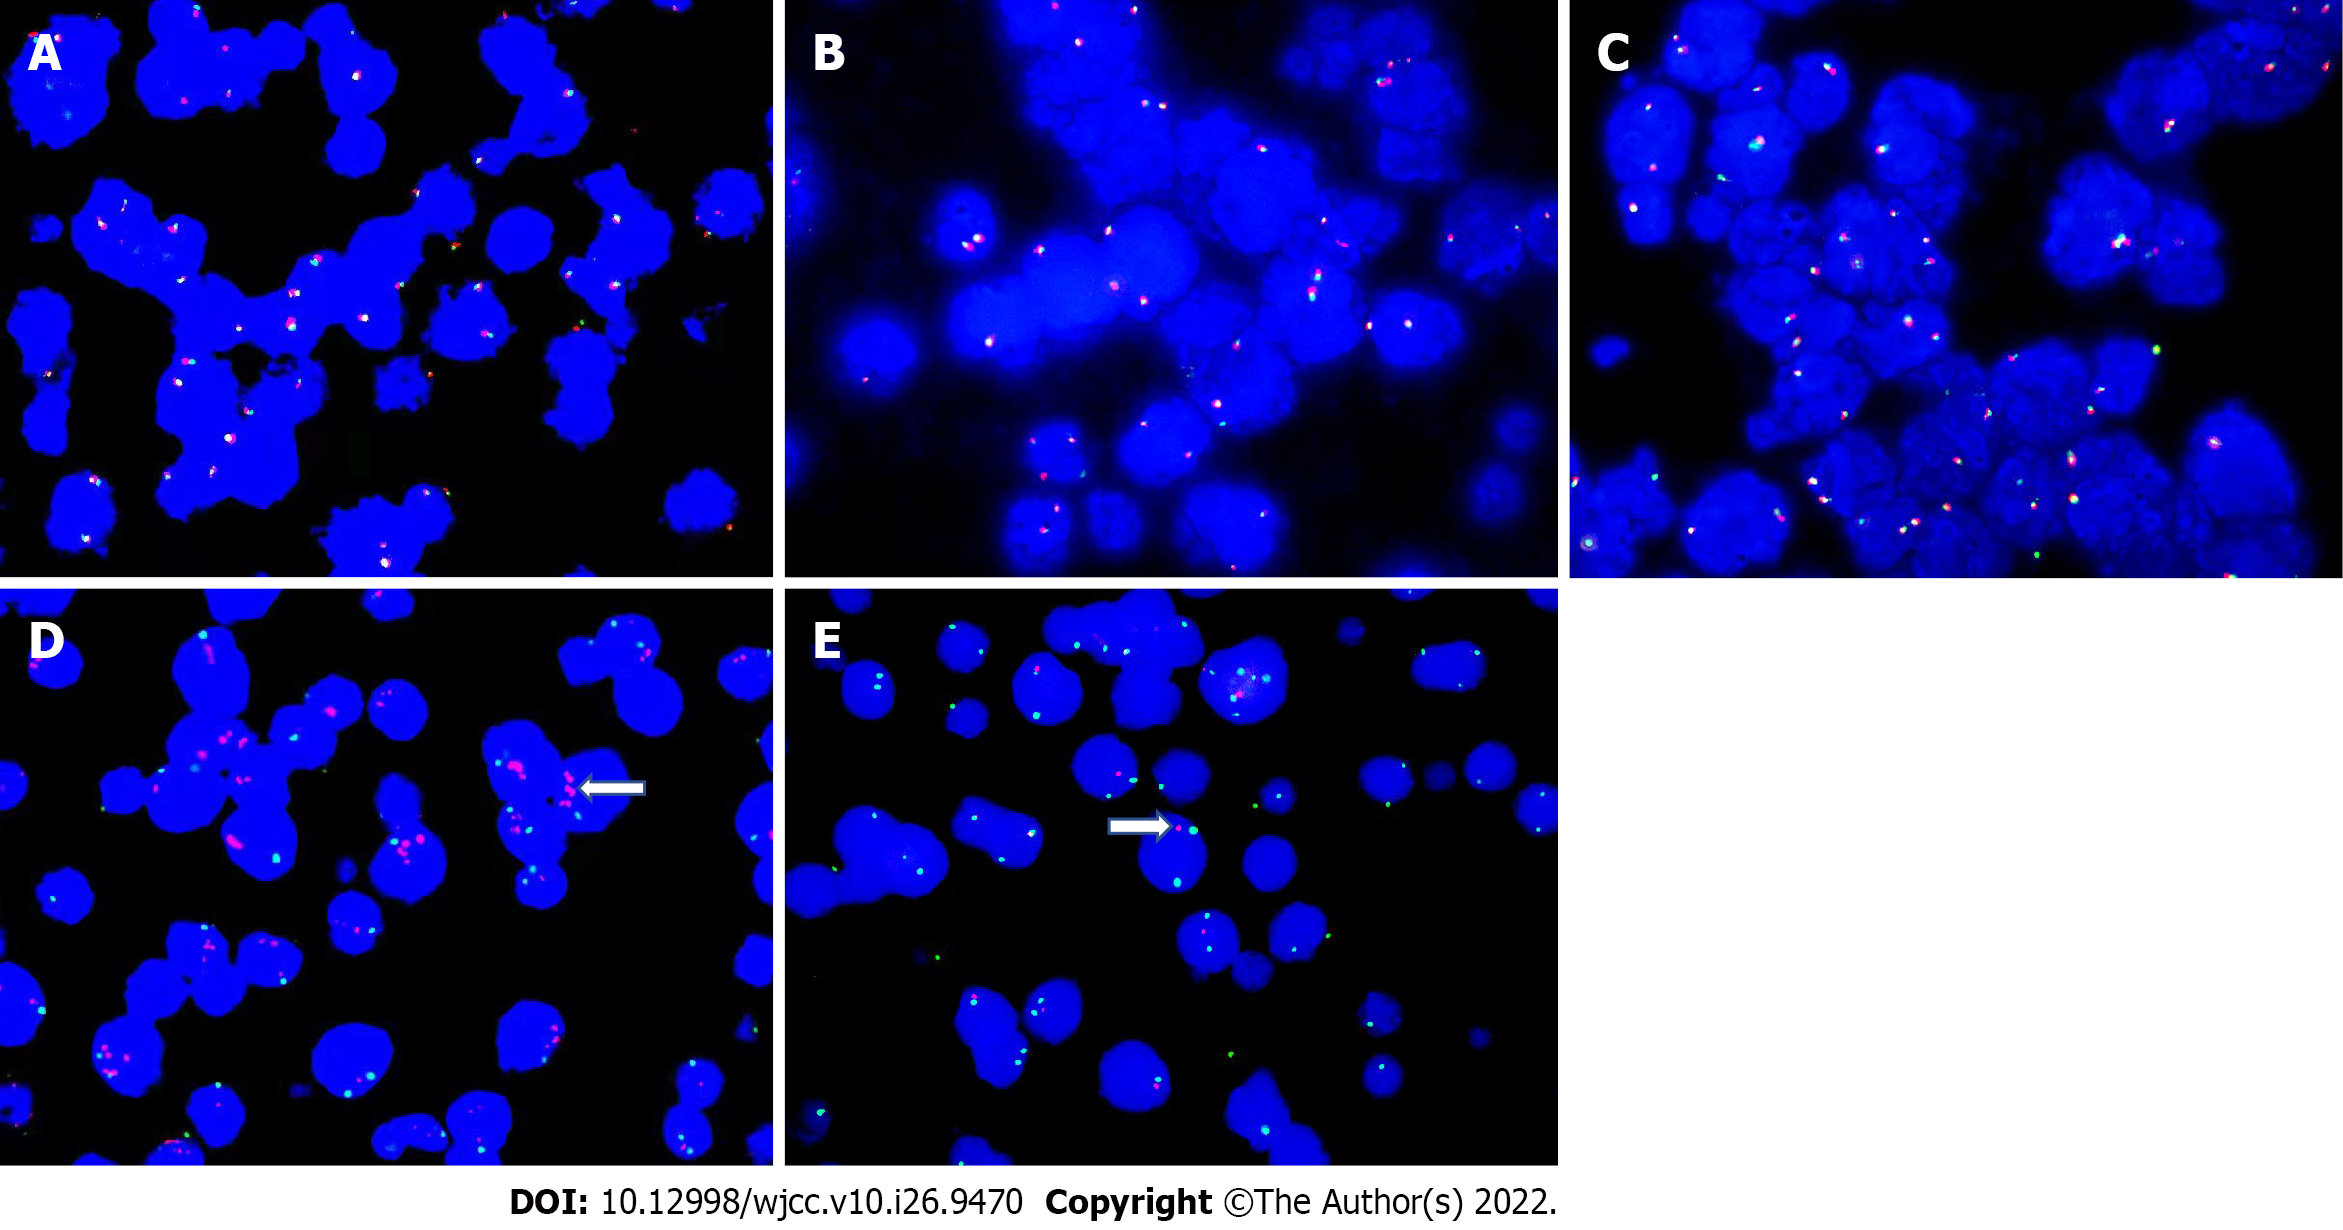
Figure 3 Fluorescence in situ hybridization detection on gene and chromosomes.
A-C: Fluorescence in situ hybridization (FISH) detection on MYC gene (A), BCL2 gene (B), and BCL6 gene (C), all were negative; D: 11q23. 3 was positive, red represents 11q23. 3, and green represents CSP11. 11q23. 3. was amplified (white arrow); E: 11q24. 3 was positive, red represents 11q24. 3 and green represents CSP11. 11q24. 3 was reduced or missing (white arrow).
- Citation: Yang HJ, Wang ZM. Burkitt-like lymphoma with 11q aberration confirmed by needle biopsy of the liver: A case report. World J Clin Cases 2022; 10(26): 9470-9477
- URL: https://www.wjgnet.com/2307-8960/full/v10/i26/9470.htm
- DOI: https://dx.doi.org/10.12998/wjcc.v10.i26.9470


