Copyright
©The Author(s) 2022.
World J Clin Cases. Sep 16, 2022; 10(26): 9285-9302
Published online Sep 16, 2022. doi: 10.12998/wjcc.v10.i26.9285
Published online Sep 16, 2022. doi: 10.12998/wjcc.v10.i26.9285
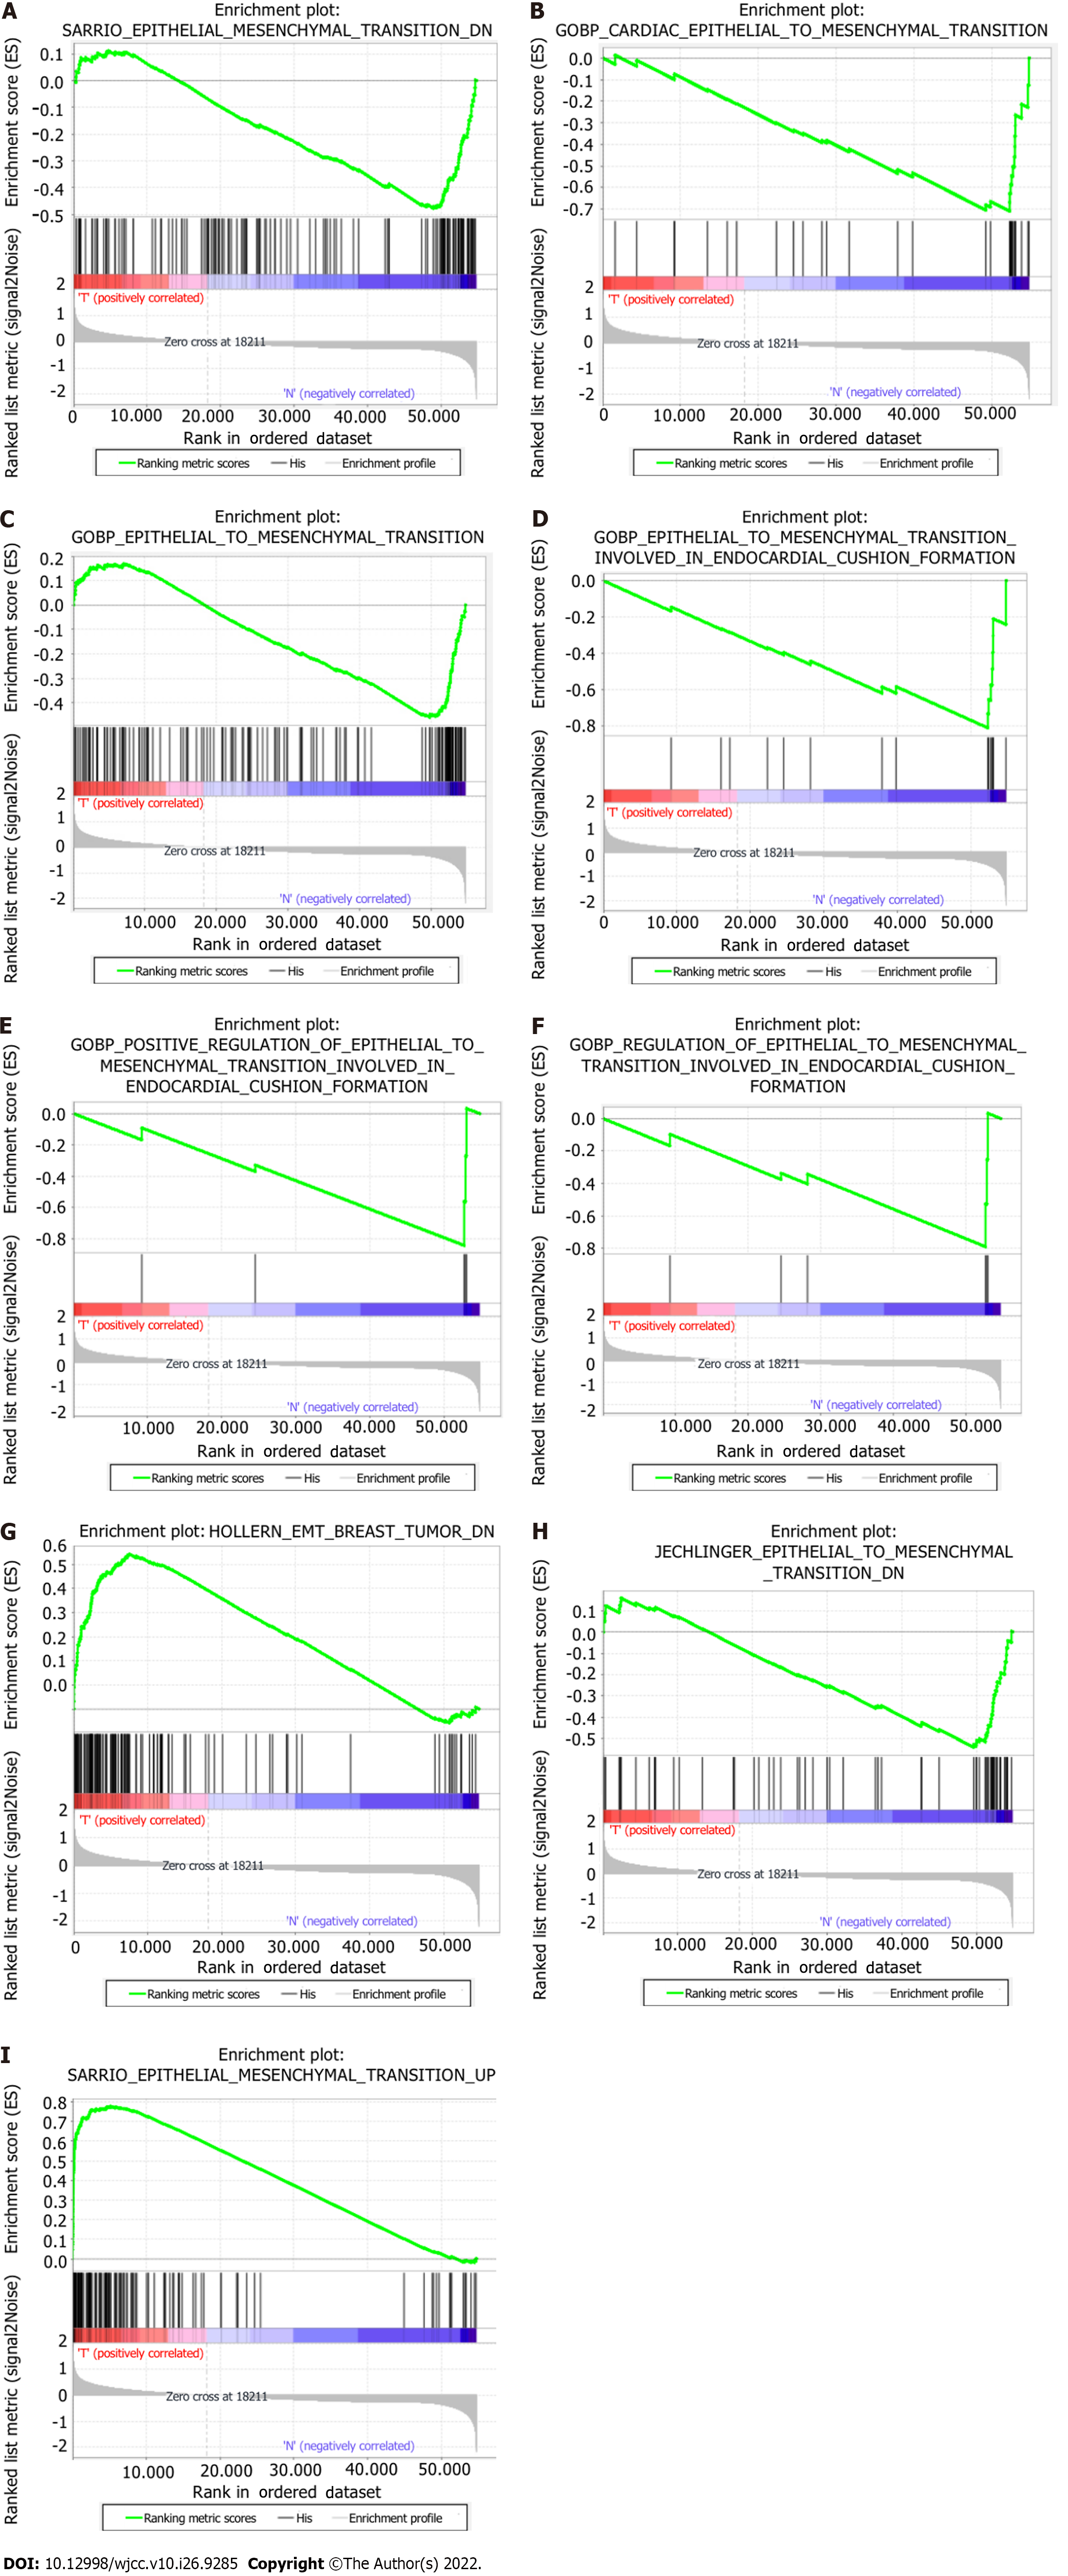
Figure 1 Enrichment plots of the gene set enrichment analysis results of 9 gene sets.
GSEA: Gene set enrichment analysis.
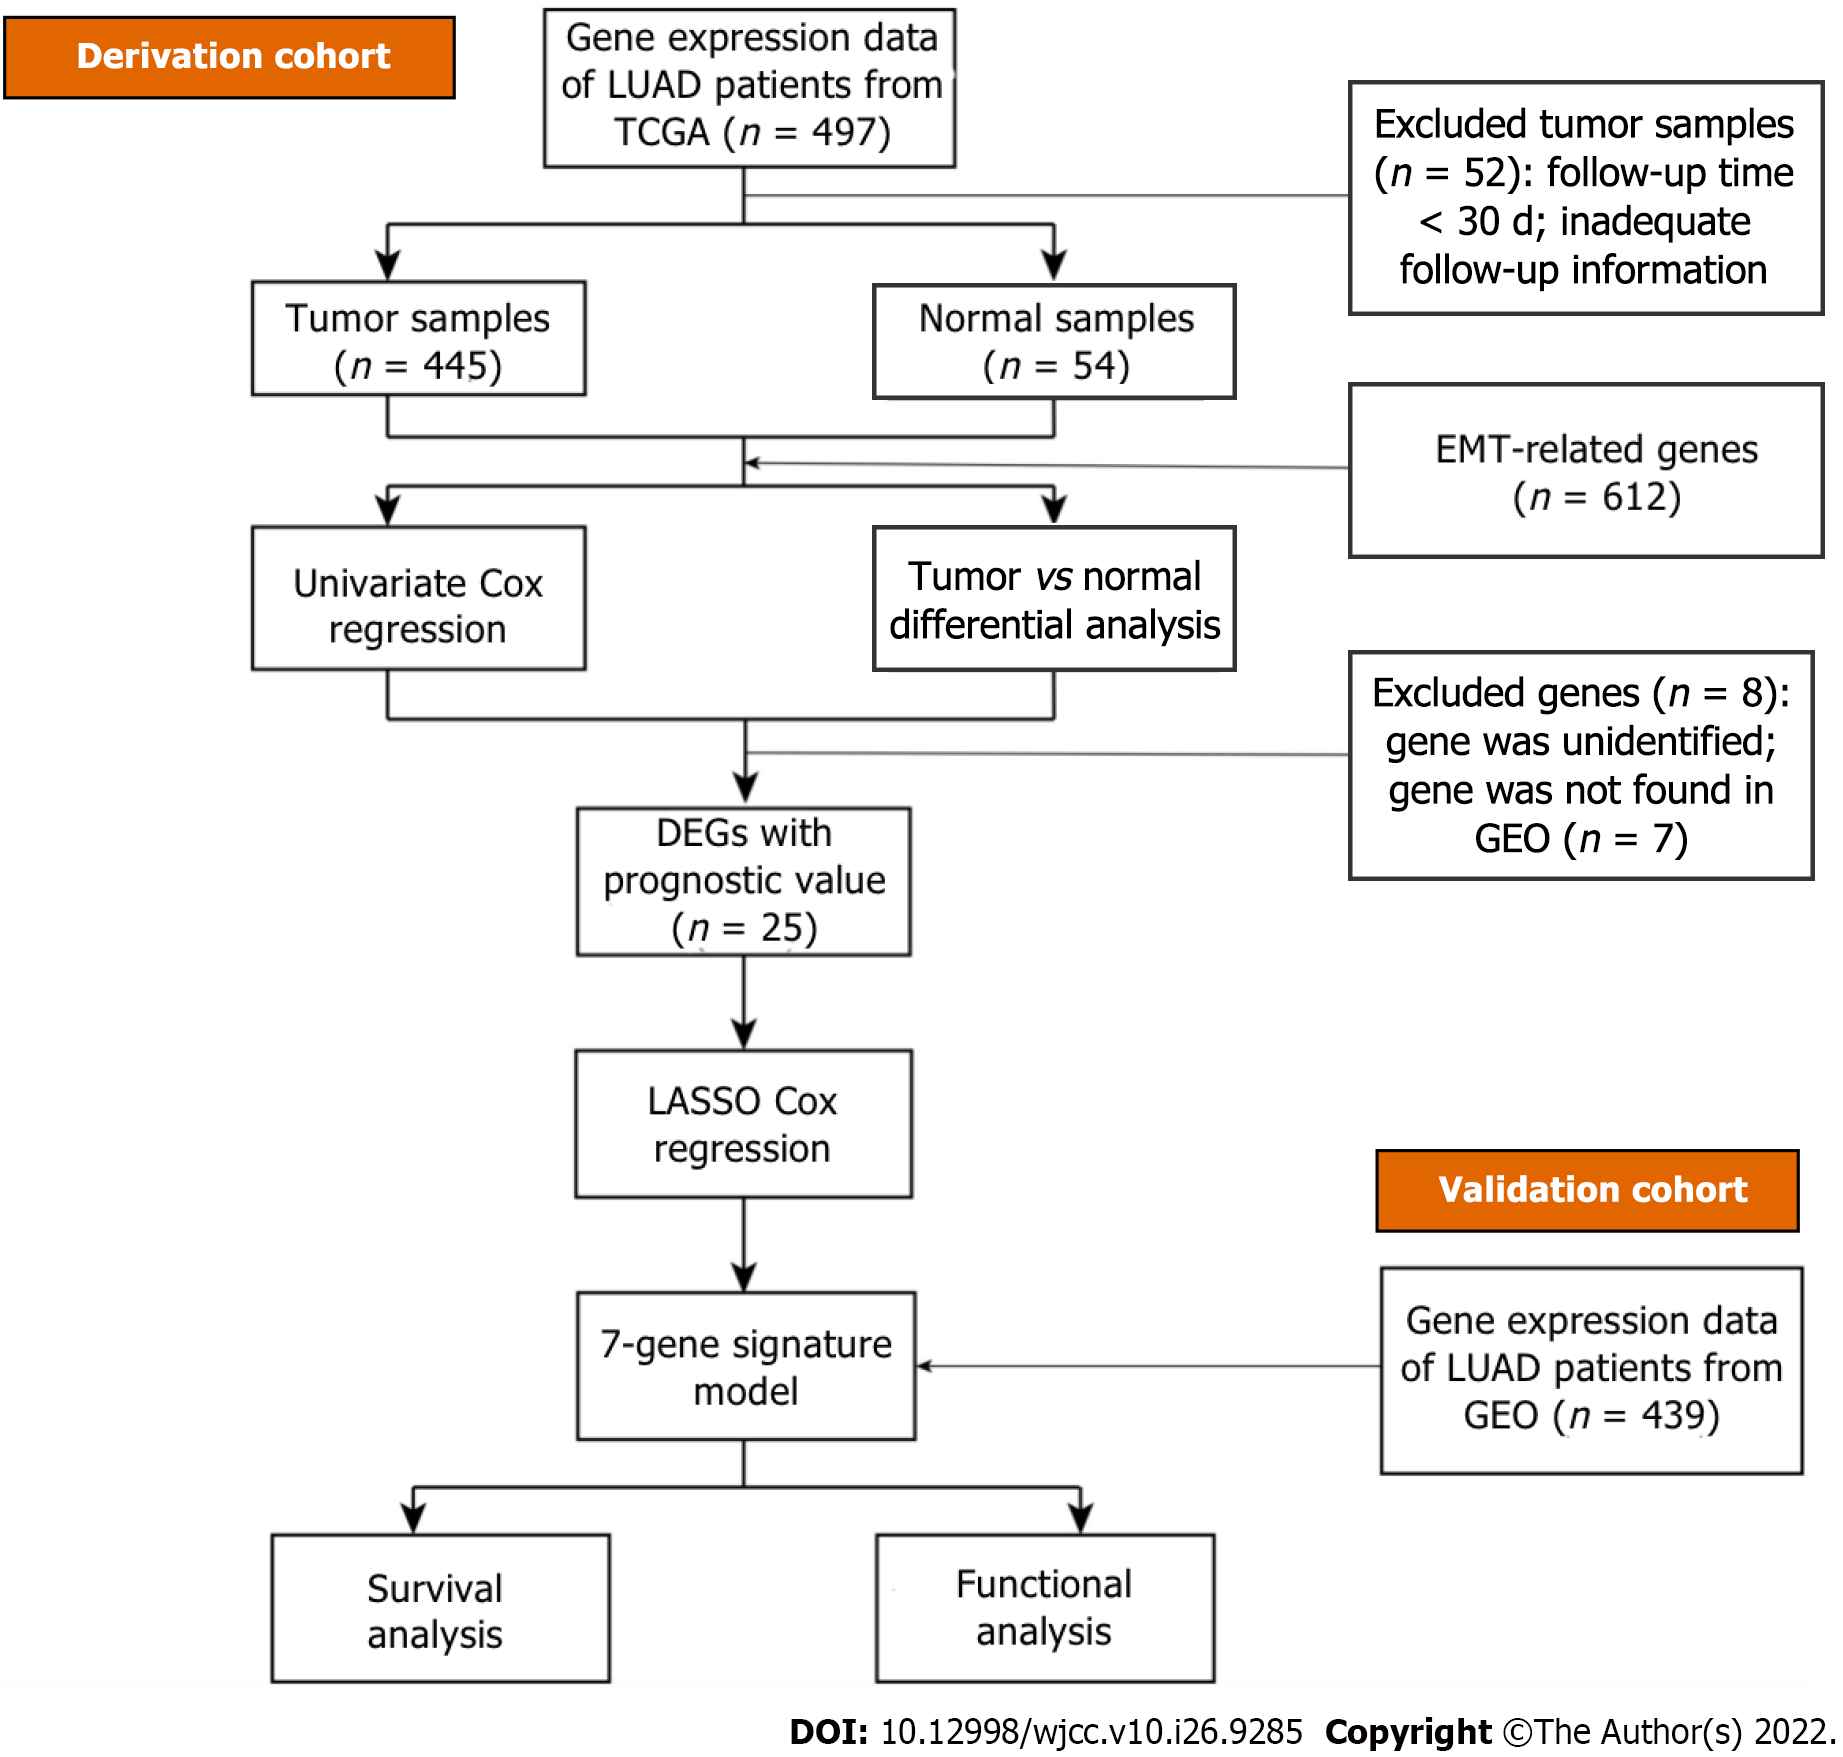
Figure 2 A flow chart of the study.
TCGA: The Cancer Genome Atlas; LUAD: Lung adenocarcinoma; DEGs: Differentially expressed genes; EMT: Epithelial-mesenchymal transition; GEO: Gene Expression Omnibus.
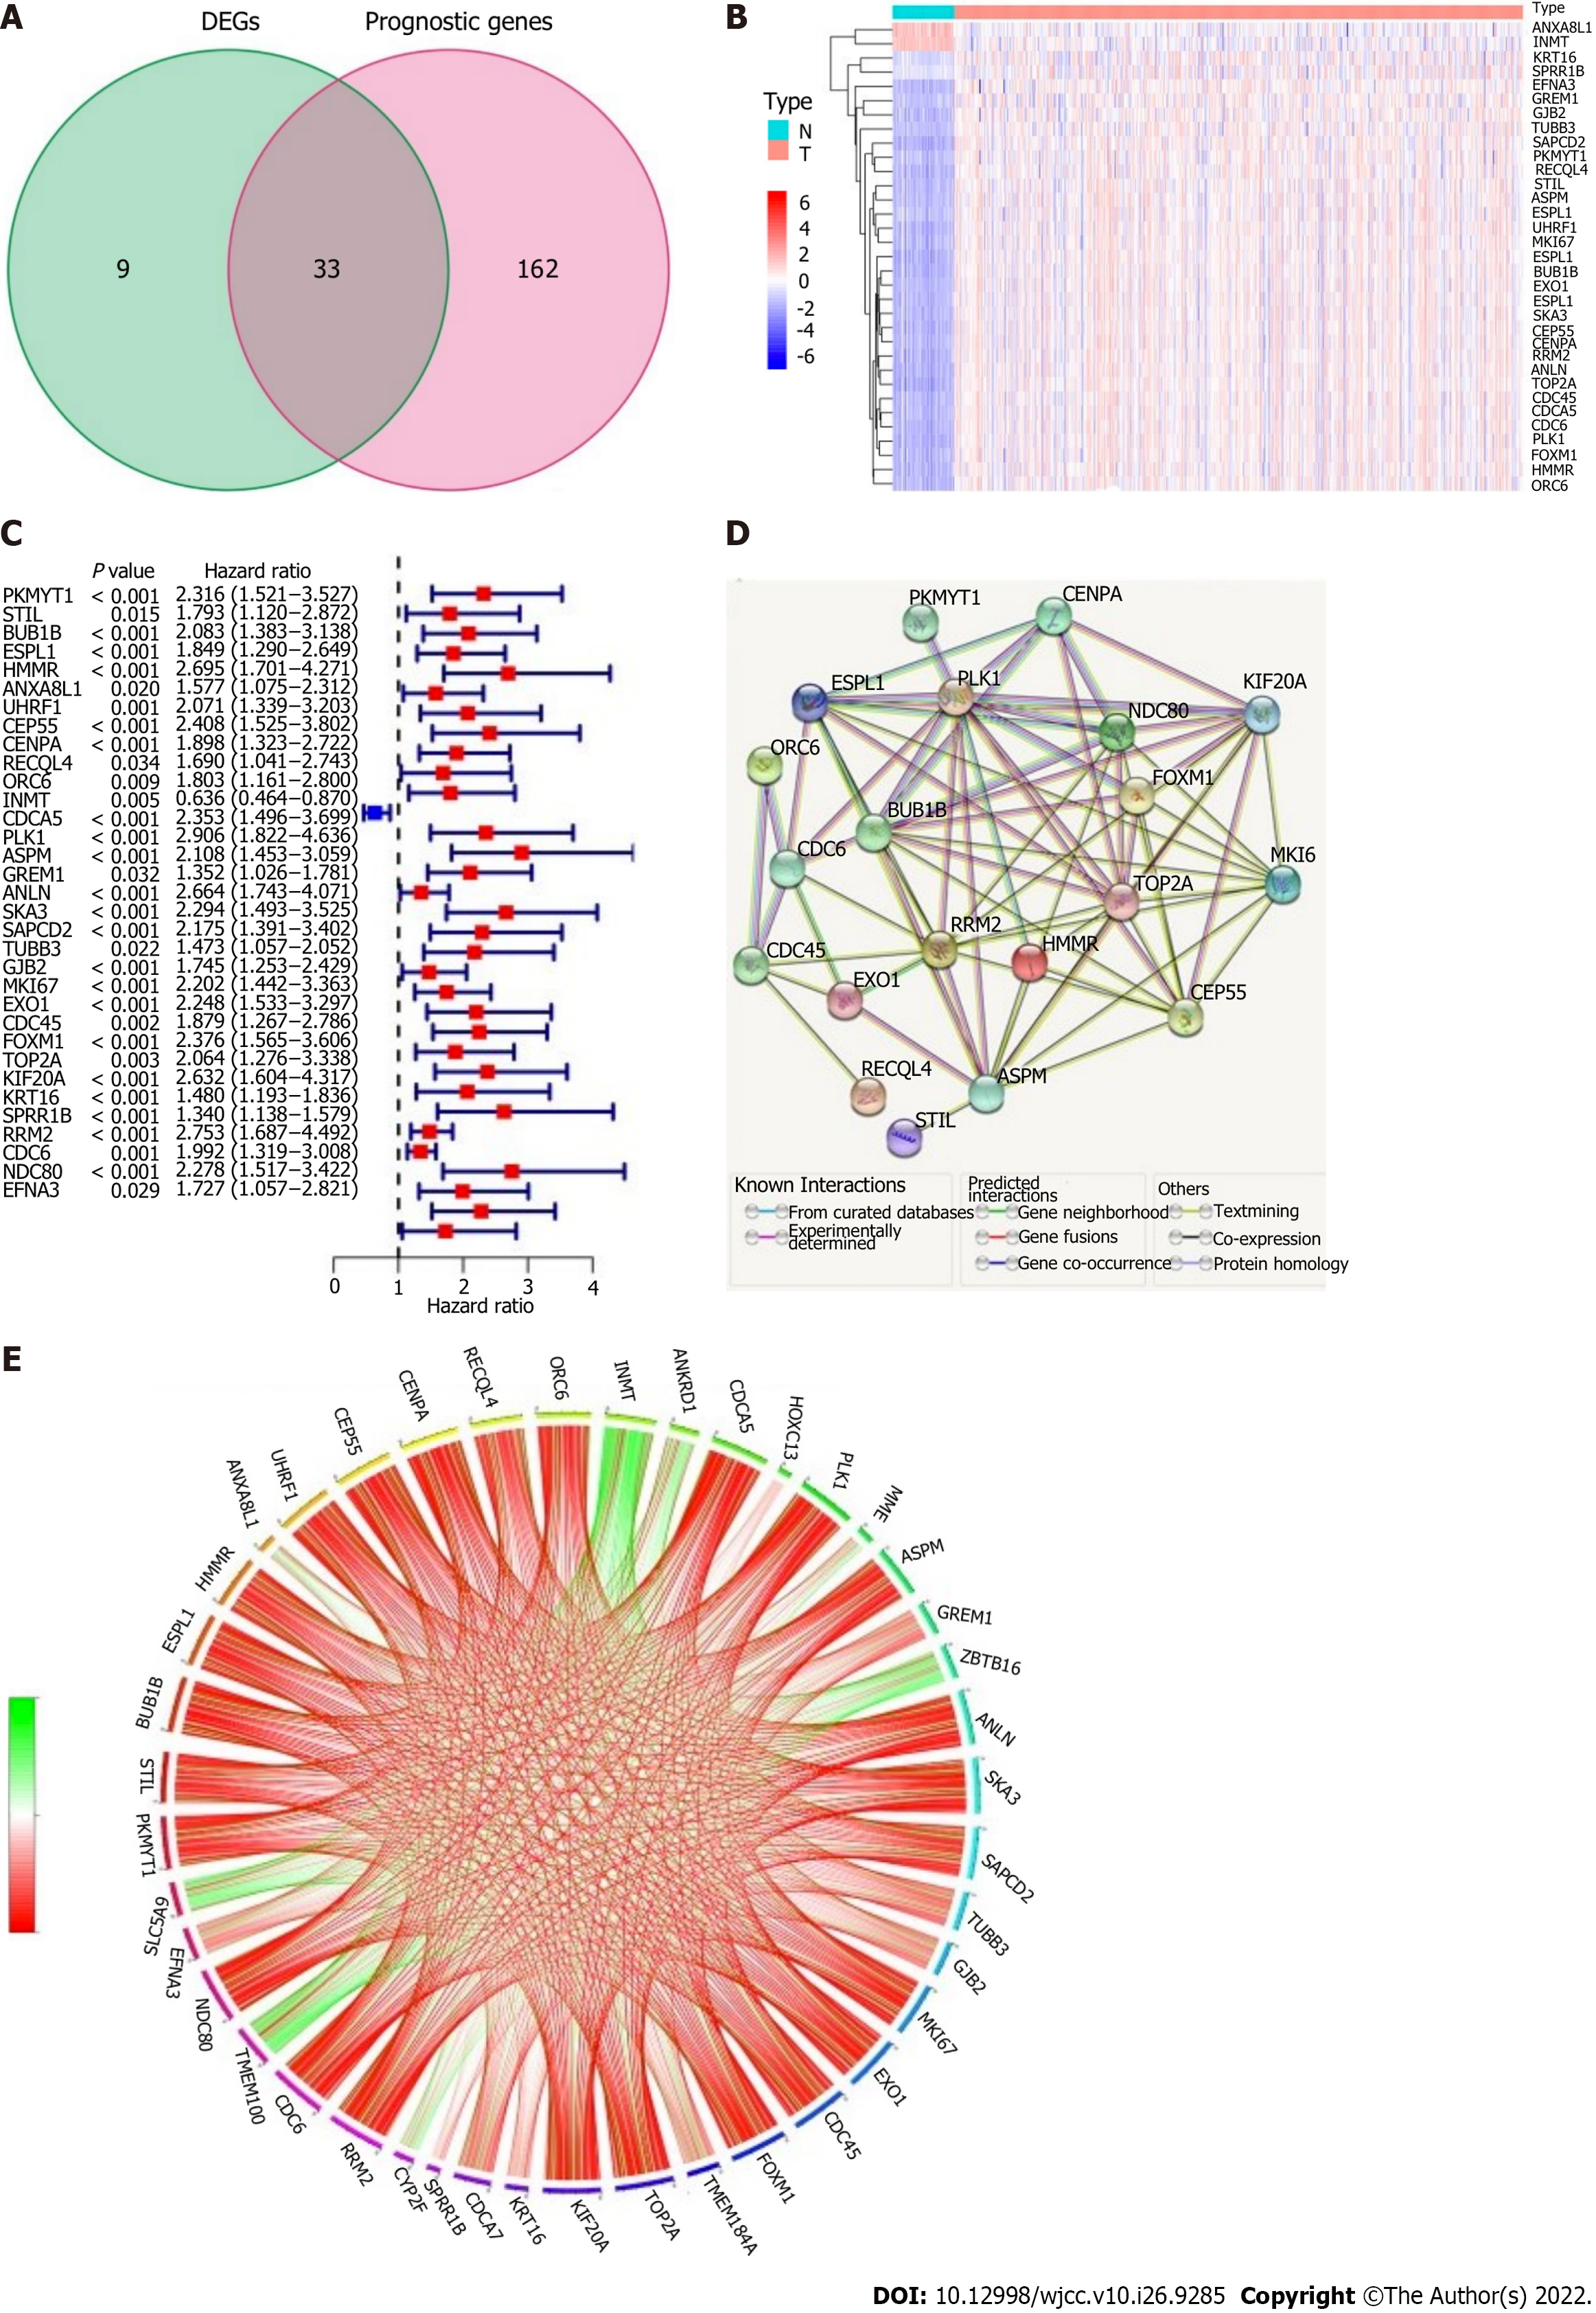
Figure 3 Identification of the potential epithelial-mesenchymal transition-associated genes in the derivation cohort.
A: Venn diagram to classify differentially expressed genes between tumor and adjacent normal tissue that were related to overall survival (OS); B: Thirty-one of the 33 overlapping genes were upregulated in cancer tissue; C: Forest plots presenting the outcomes of univariate Cox regression analysis between gene expression and OS; D: Protein-protein interaction network downloaded from the STRING database showing the interactions among the potential genes; E: The correlation network of the potential genes: correlation coefficients are shown with different colors; the number of lines indicates the correlation strength.
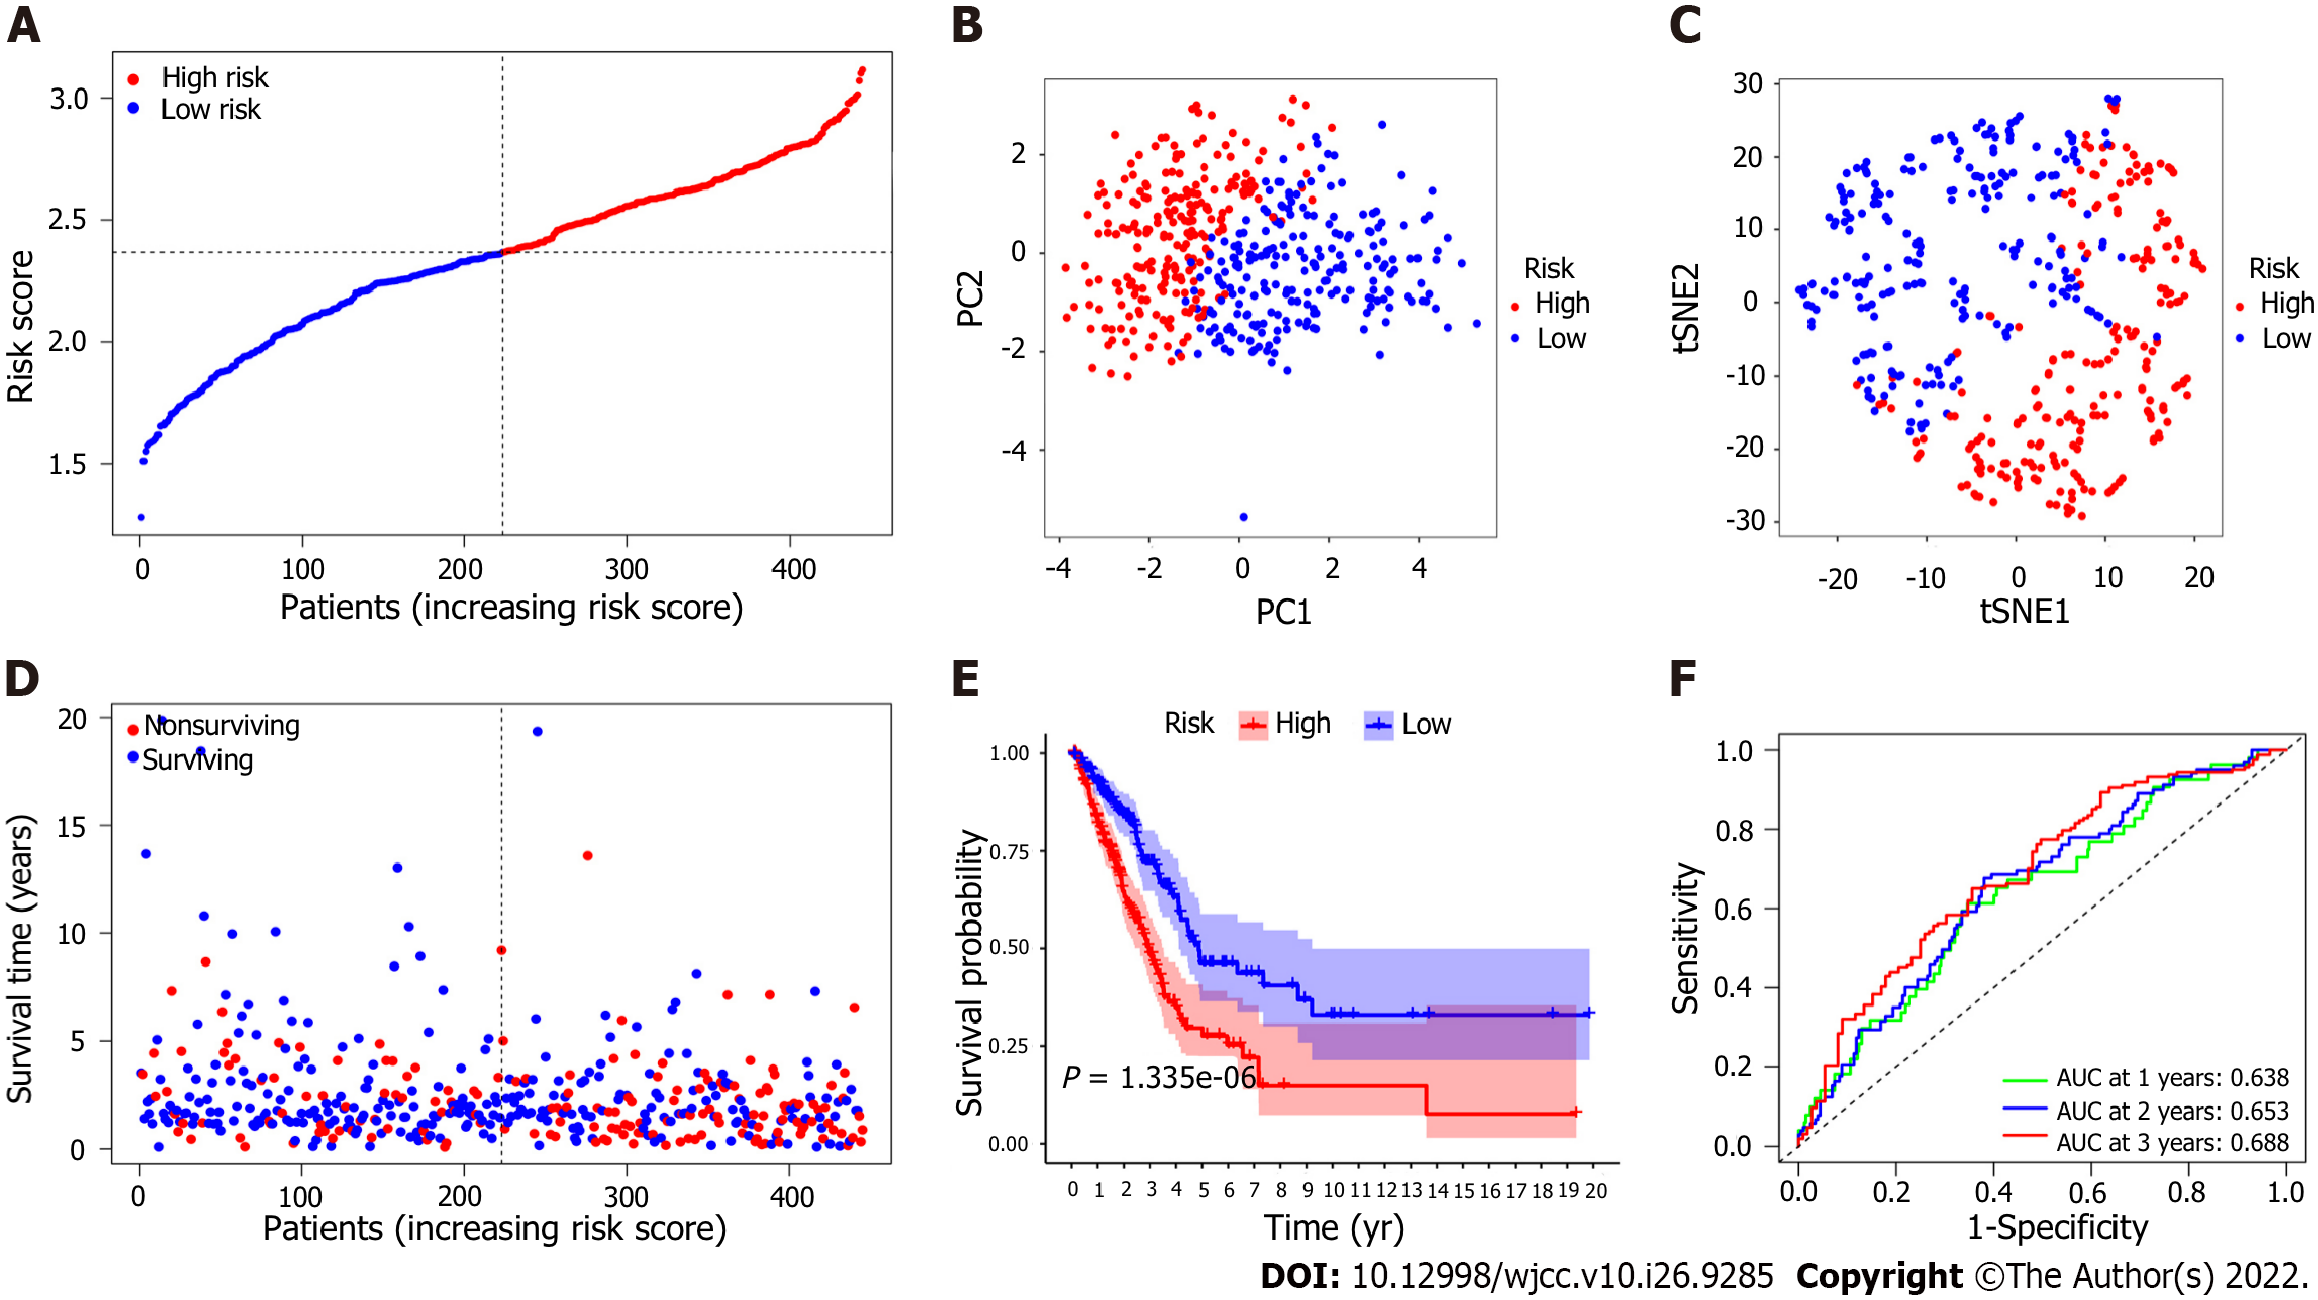
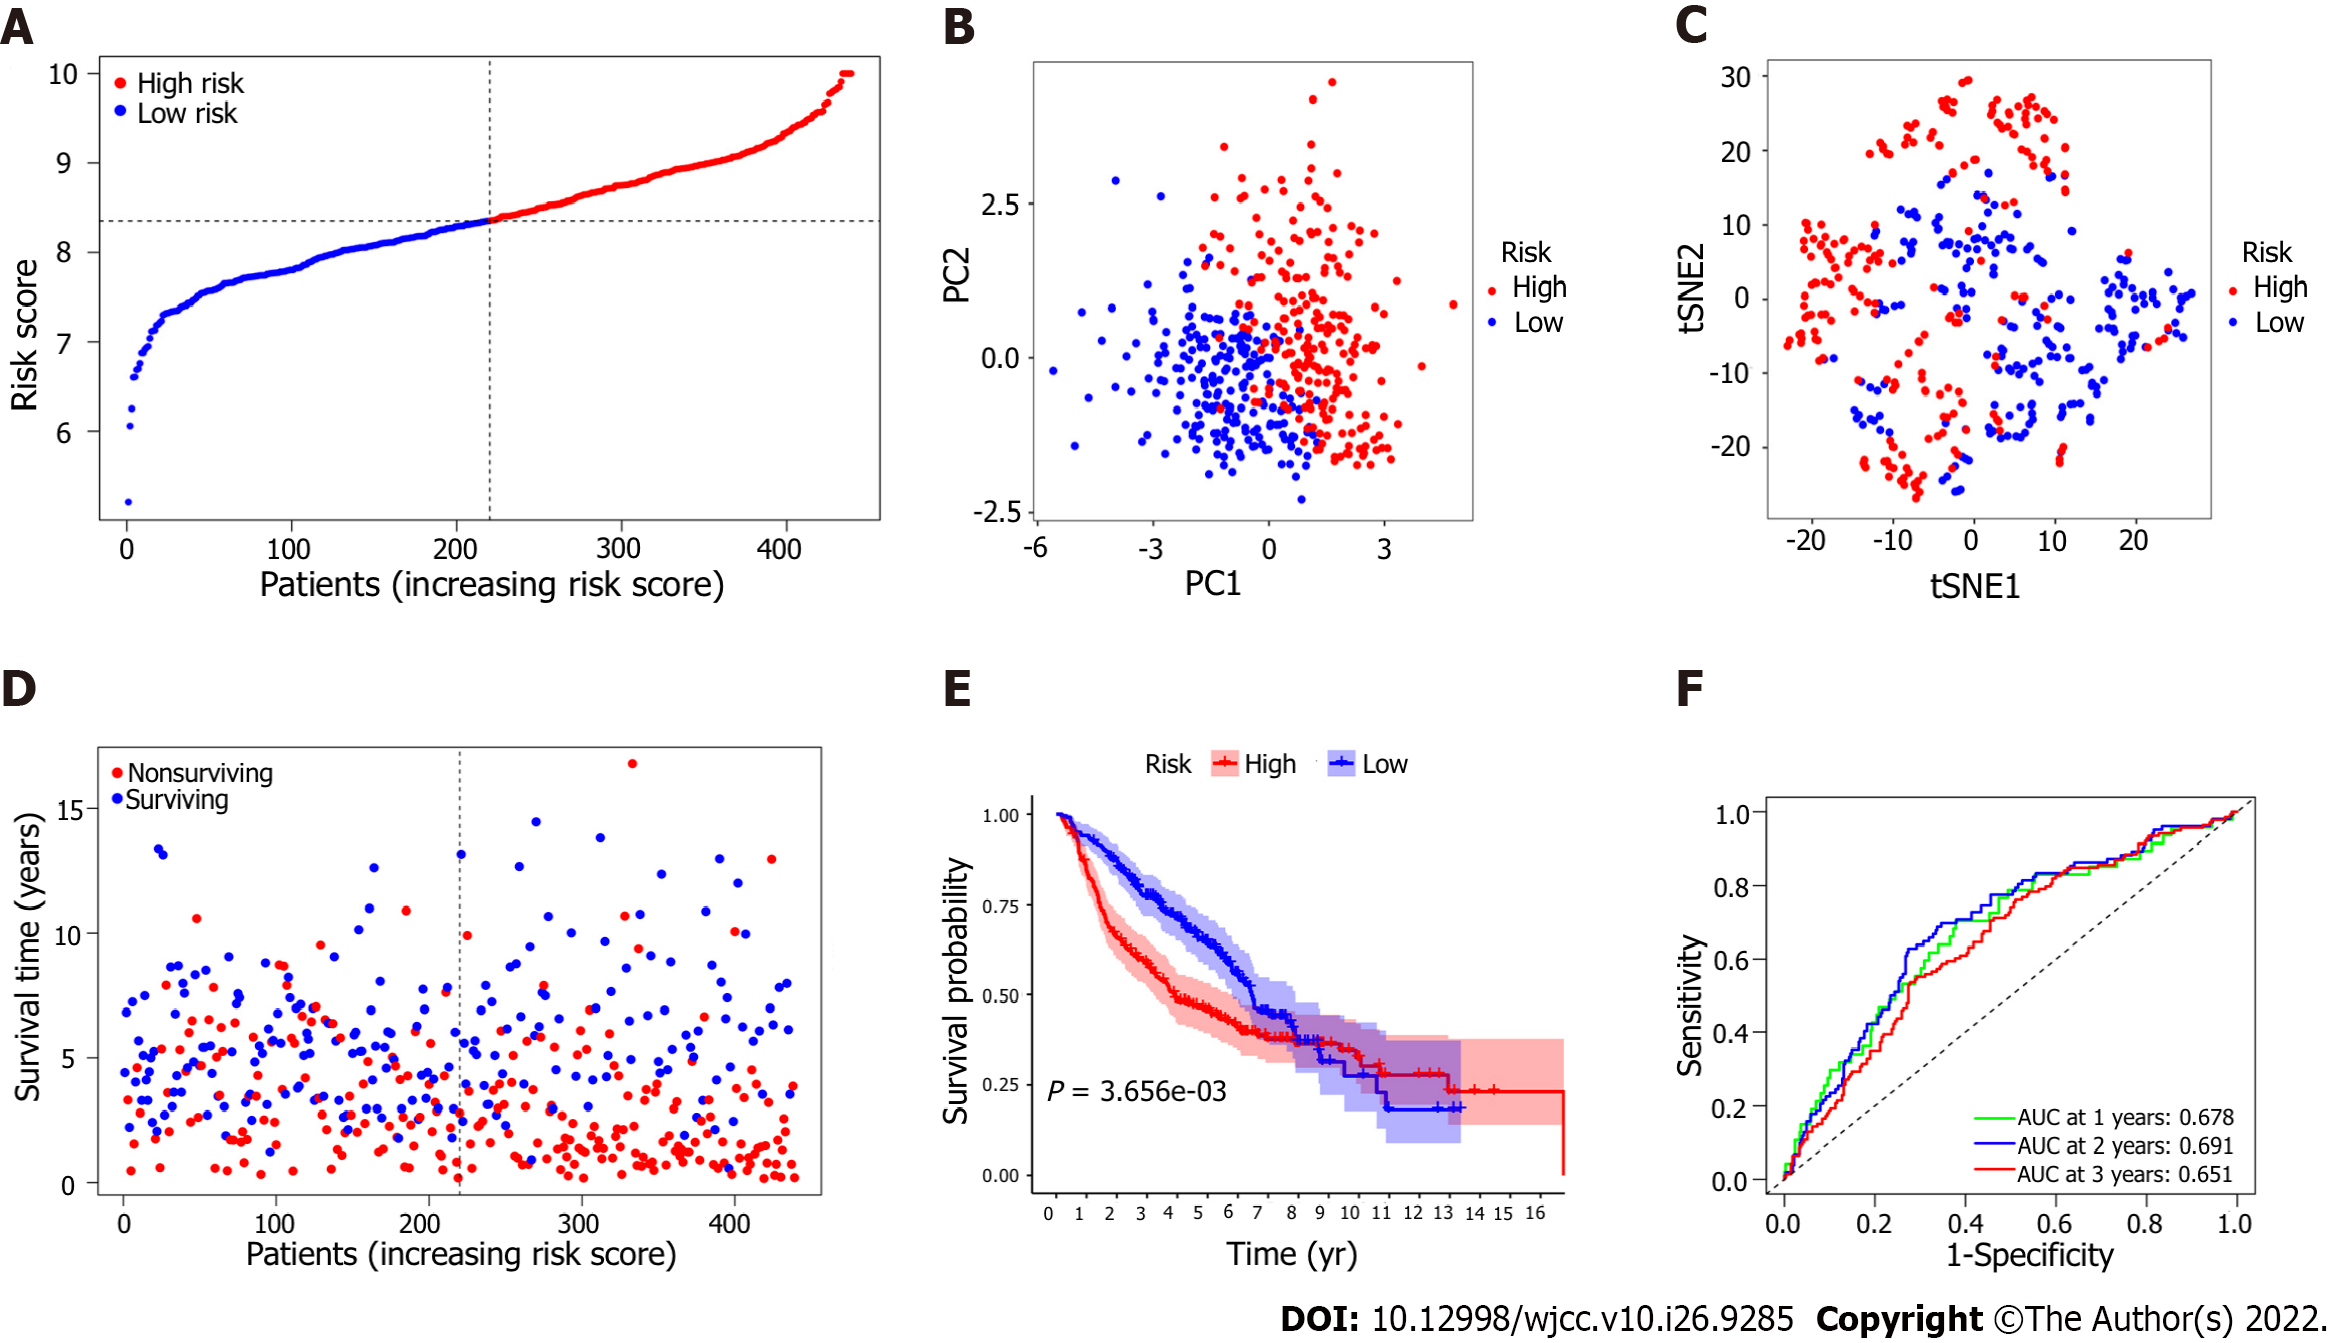
Figure 4 Prognostic analysis of the 7 epithelial-mesenchymal transition-associated gene signature model in the derivation cohort.
A: The median value and distribution of the risk scores. B: The results of principal component analysis (PCA) indicated that patients with lung adenocarcinoma (LUAD) were significantly distributed in two regions according to the risk score; C: The results of t-distributed stochastic neighbor embedding (t-SNE) analysis suggested that LUAD patients clustered in two different regions; D: The distributions of the overall survival (OS) status; the results showed that patients with a higher risk score had shorter survival times than those with lower risk scores; E: Kaplan-Meier analysis of OS for patients in the high-risk group and the low-risk group in the derivation cohort. F: The area under the curve (AUC) of the time-dependent receiver operator characteristic curve (ROC) verified the predictive performance of the prognostic risk score in the derivation cohort.
Figure 5 Validation of the 7 epithelial-mesenchymal transition-associated gene signature model in the validation cohort.
A: The median value and distribution of the risk scores in the validation cohort; B: Principal component analysis (PCA) plot; C: Results of t-distributed stochastic neighbor embedding (t-SNE) analysis; D: The distributions of overall survival (OS) status for the high-risk group and the low-risk group; E: Kaplan-Meier analysis of OS for lung adenocarcinoma (LUAD) patients in the high-risk group and the low-risk group; F: The area under the curve (AUC) of the time-dependent receiver operator characteristic curve (ROC) validated the predictive performance of the prognostic risk score in the validation cohort.
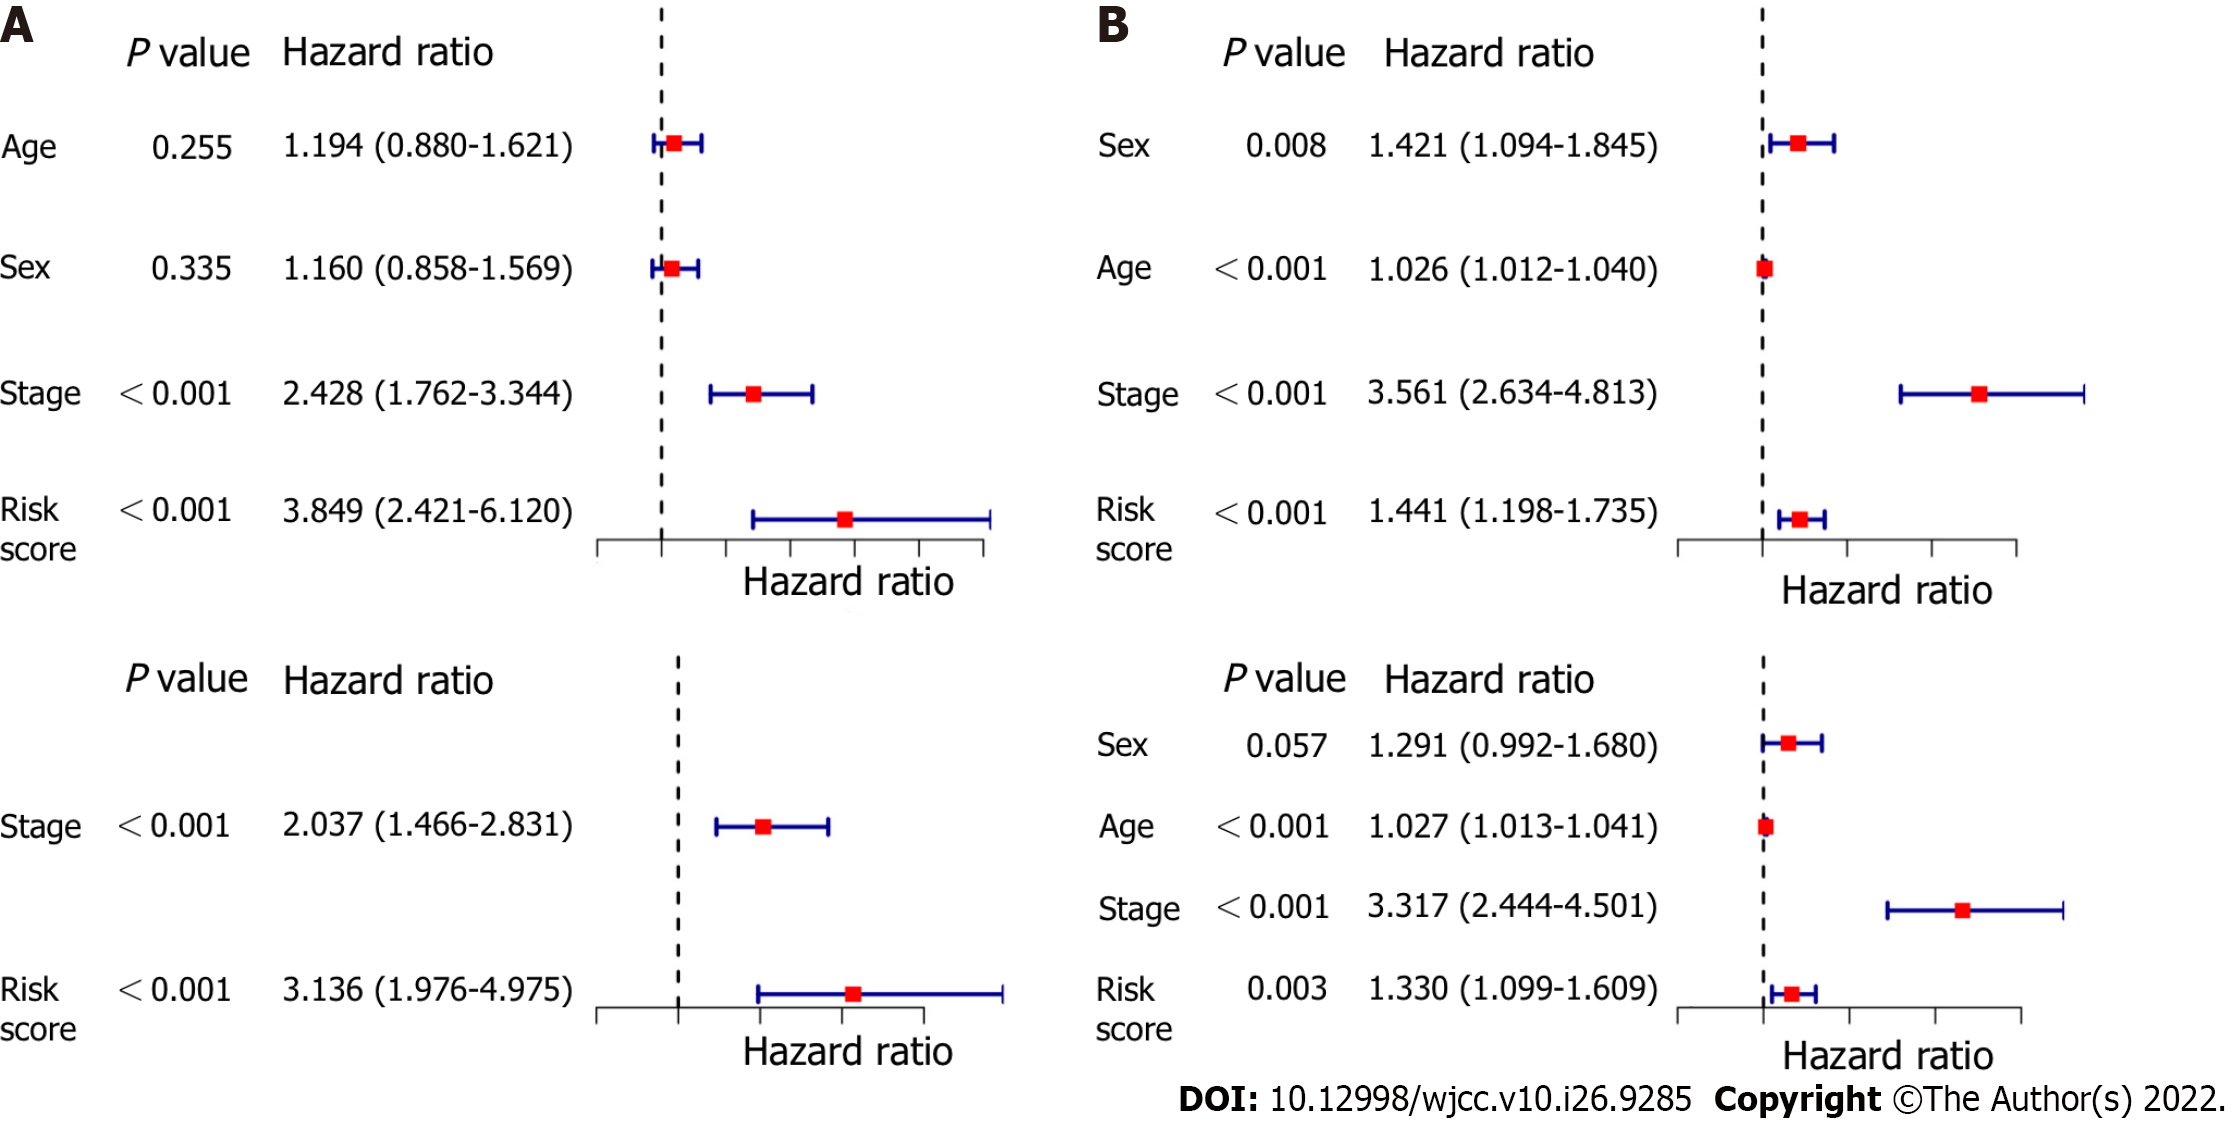
Figure 6 Results of univariate and multivariate Cox regression analyses.
A: Derivation cohort; B: Validation cohort.
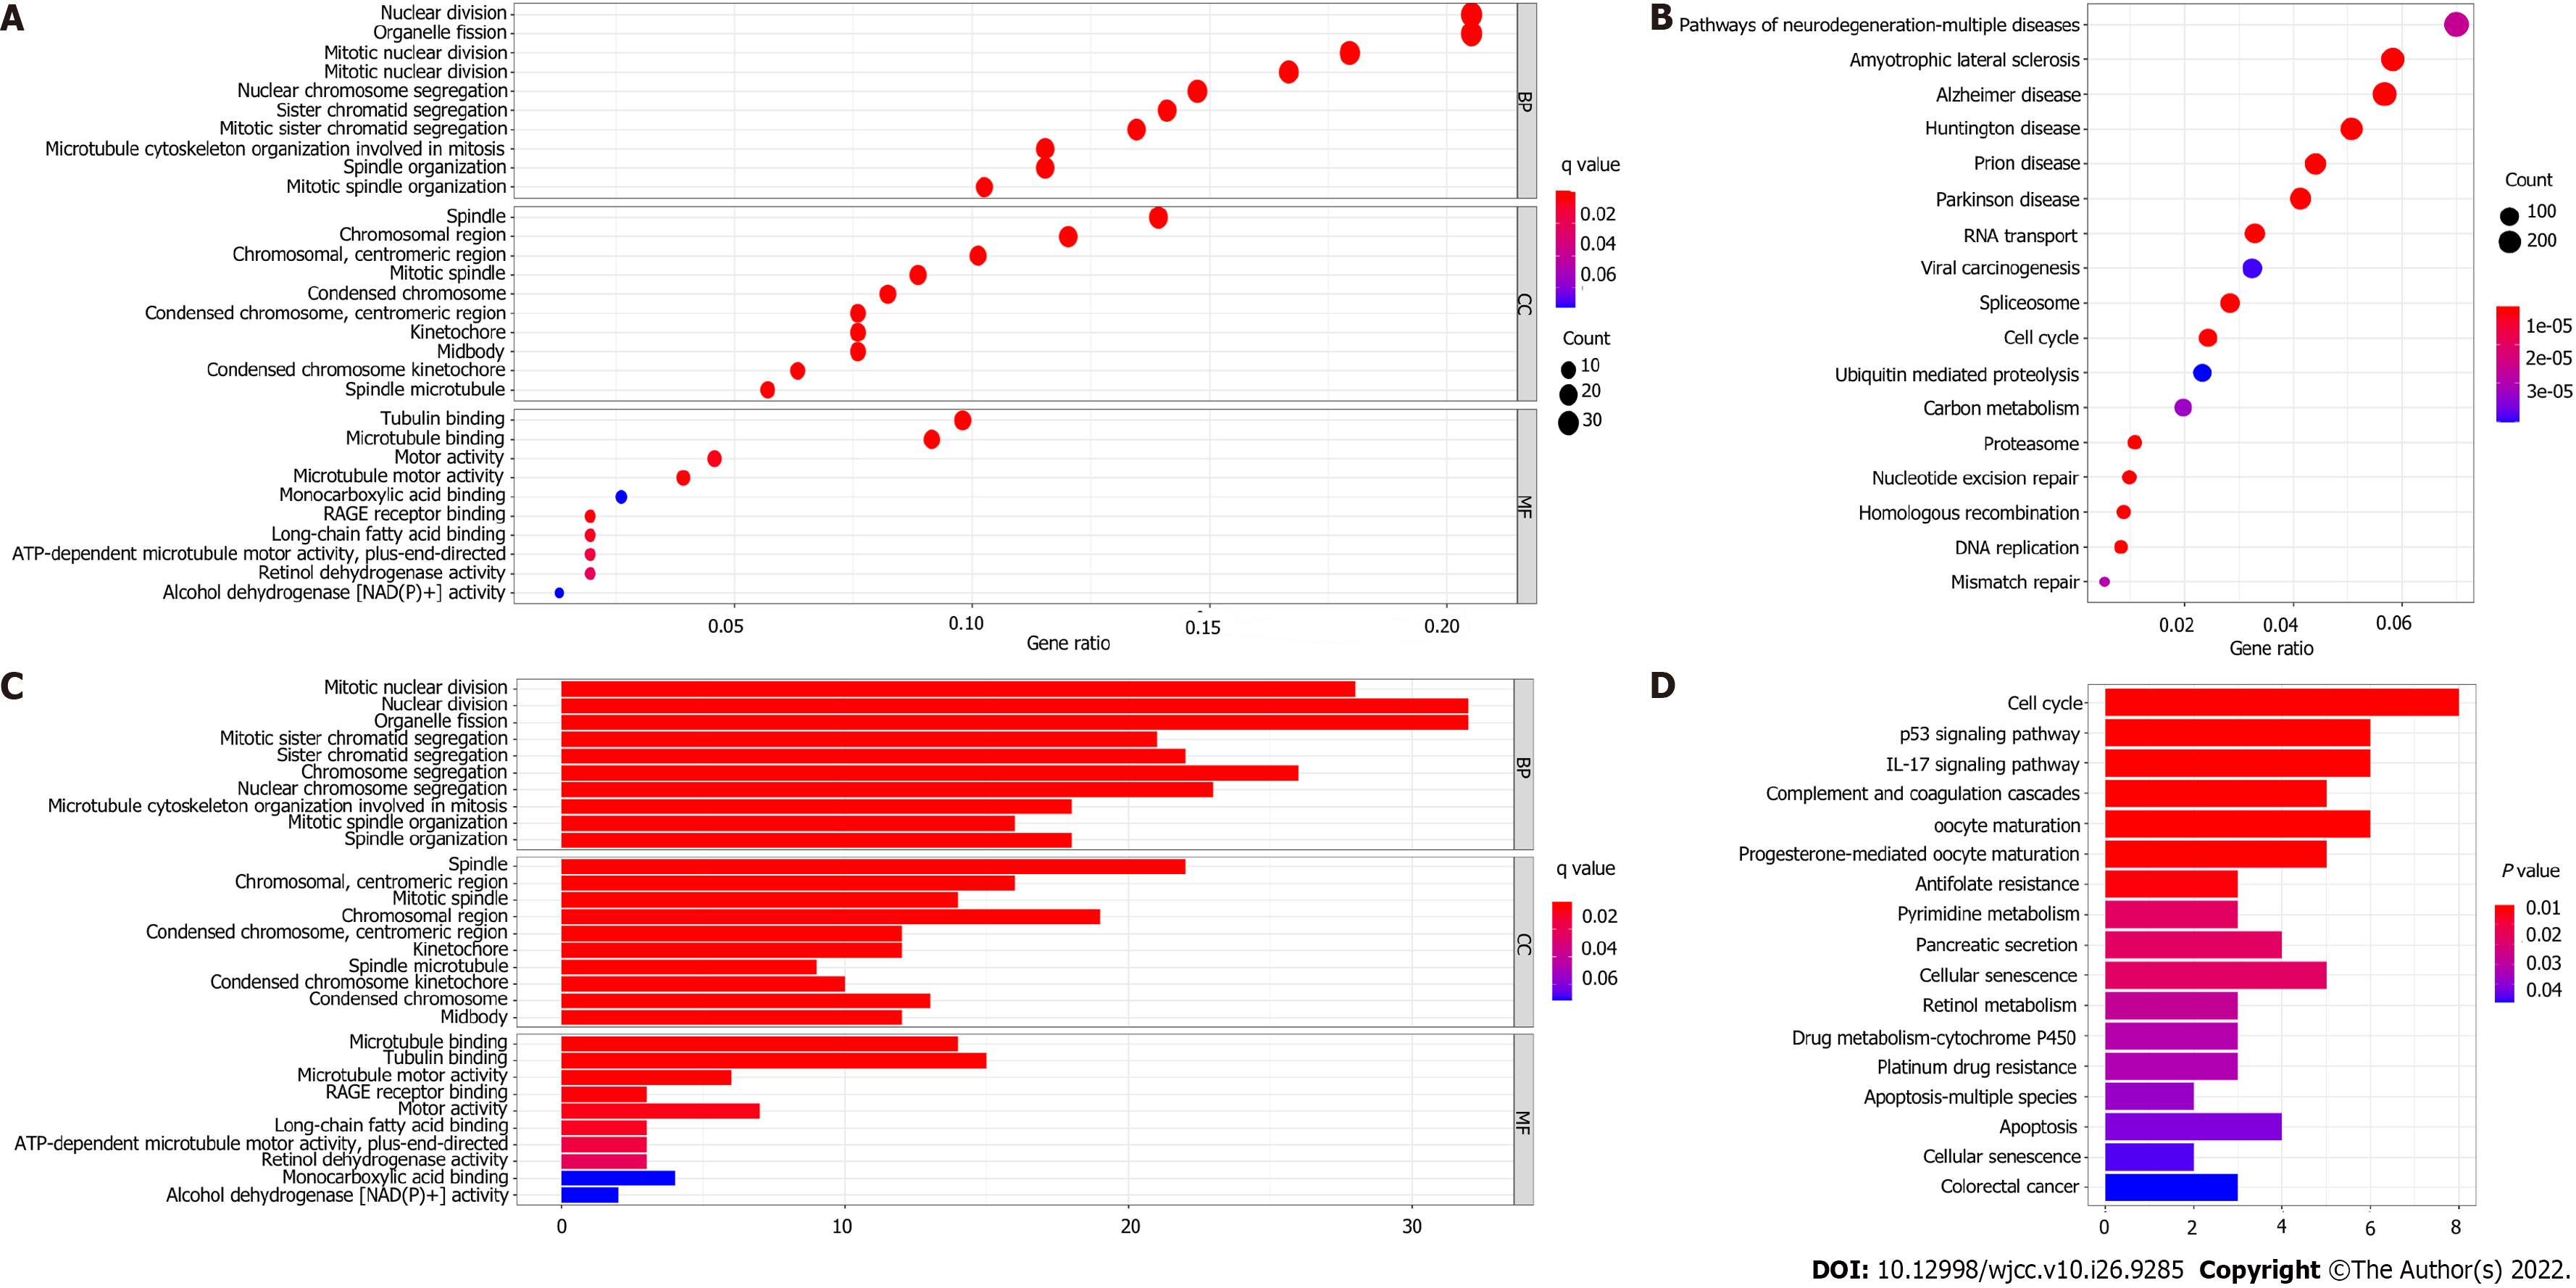
Figure 7 Representative results of Gene Ontology (GO) and Kyoto Encyclopedia of Genes and Genomes (KEGG) analysis.
A and C: Most significant or available enriched GO terms in the derivation cohort and validation cohort; C and D: KEGG pathways in the two cohorts.
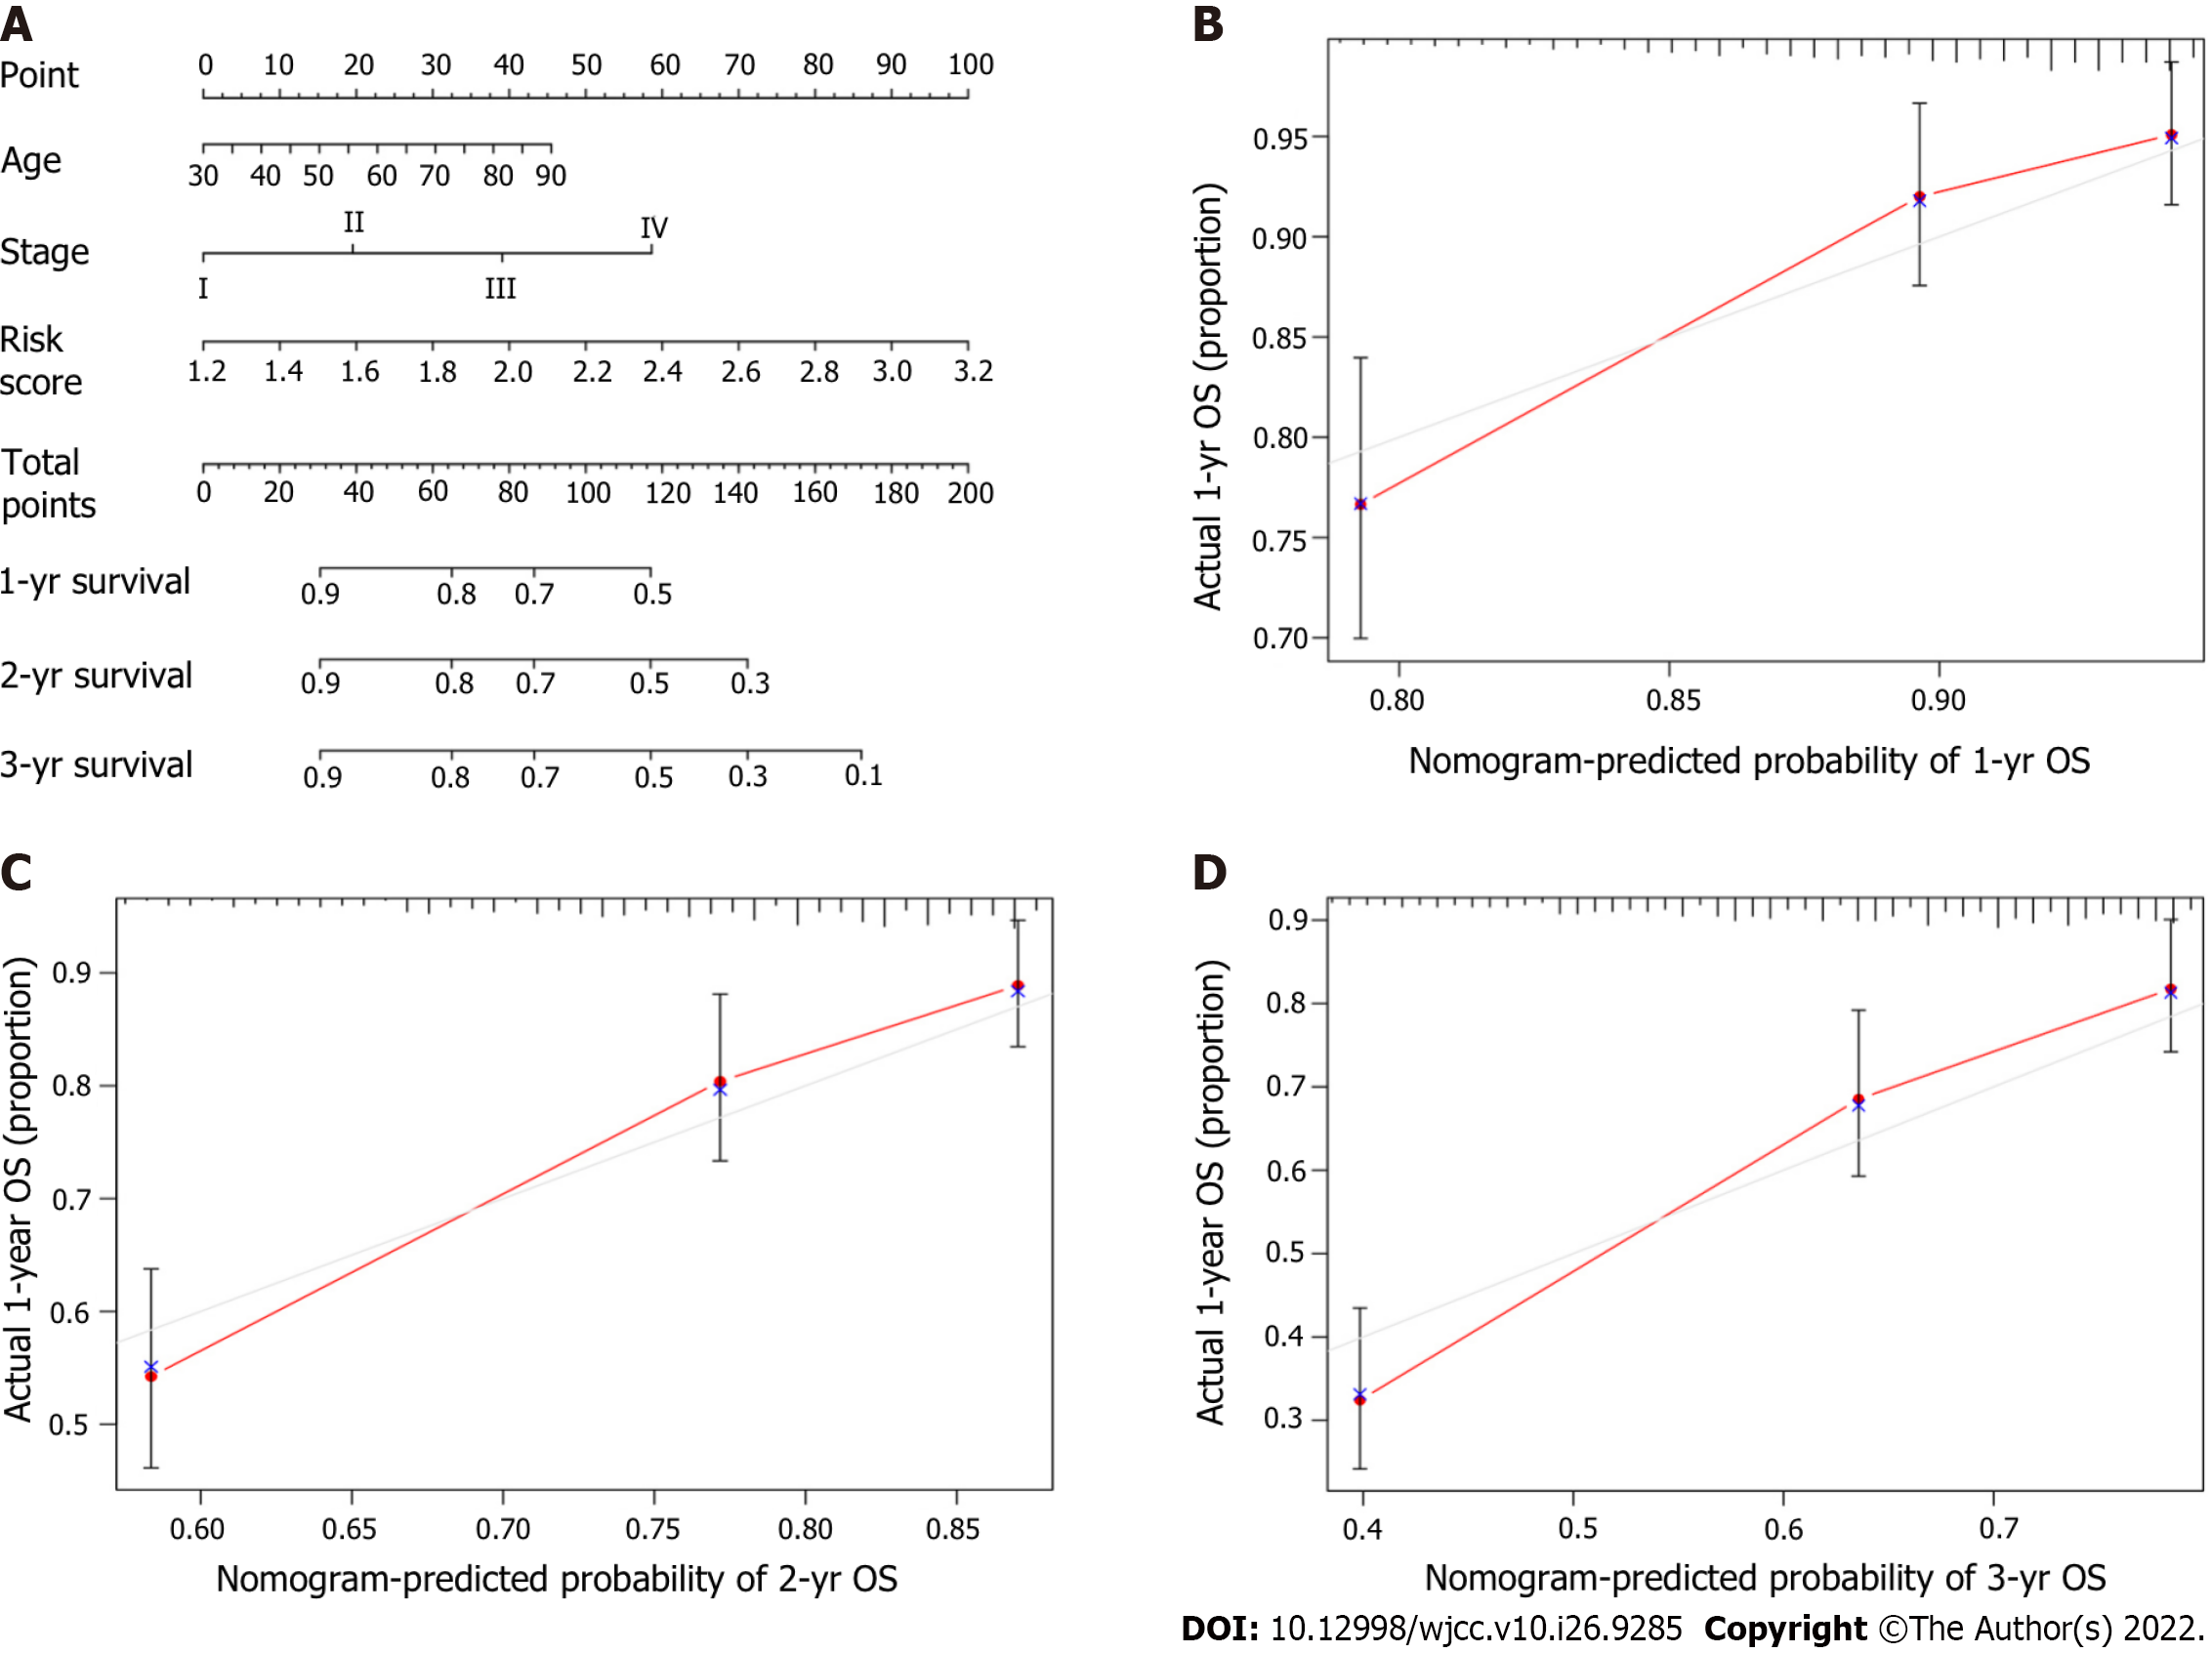
Figure 8 Development and estimation of a prognostic nomogram.
A: The nomogram predicted the one-year overall survival (OS), two-year OS, and three-year OS probabilities; B: Calibration plot of the nomogram predicting the one-year OS probability; C: Calibration plot of the nomogram predicting the two-year OS probability; D: Calibration plot of the nomogram predicting the three-year OS probability.
Figure 9 Three-dimensional structures of the ten most significant drugs.
A: 6-Thioguanosine; B: 8-Azaguanine; C: Chlorpromazine; D: GW-8510; E: Medrysone; F: Menadione; G: Meticrane; H: Morantel; I: Phenoxybenzamine; J: Resveratrol.
- Citation: Zhou DH, Du QC, Fu Z, Wang XY, Zhou L, Wang J, Hu CK, Liu S, Li JM, Ma ML, Yu H. Development and validation of an epithelial–mesenchymal transition-related gene signature for predicting prognosis. World J Clin Cases 2022; 10(26): 9285-9302
- URL: https://www.wjgnet.com/2307-8960/full/v10/i26/9285.htm
- DOI: https://dx.doi.org/10.12998/wjcc.v10.i26.9285


