Copyright
©The Author(s) 2022.
World J Clin Cases. Sep 6, 2022; 10(25): 9162-9167
Published online Sep 6, 2022. doi: 10.12998/wjcc.v10.i25.9162
Published online Sep 6, 2022. doi: 10.12998/wjcc.v10.i25.9162
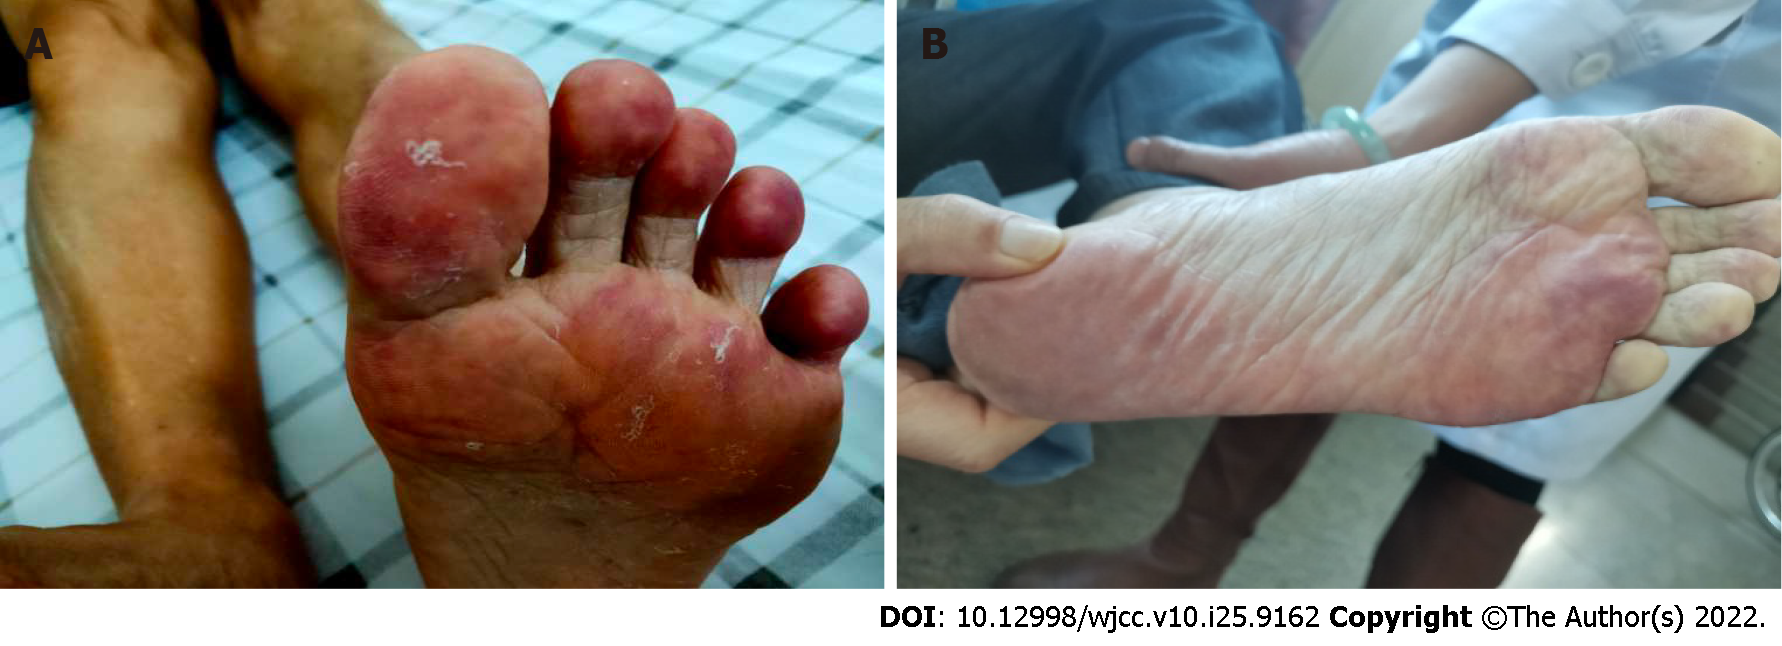
Figure 1 Blue toes on the left foot.
A: On admission; B: 8 mo after discharge.
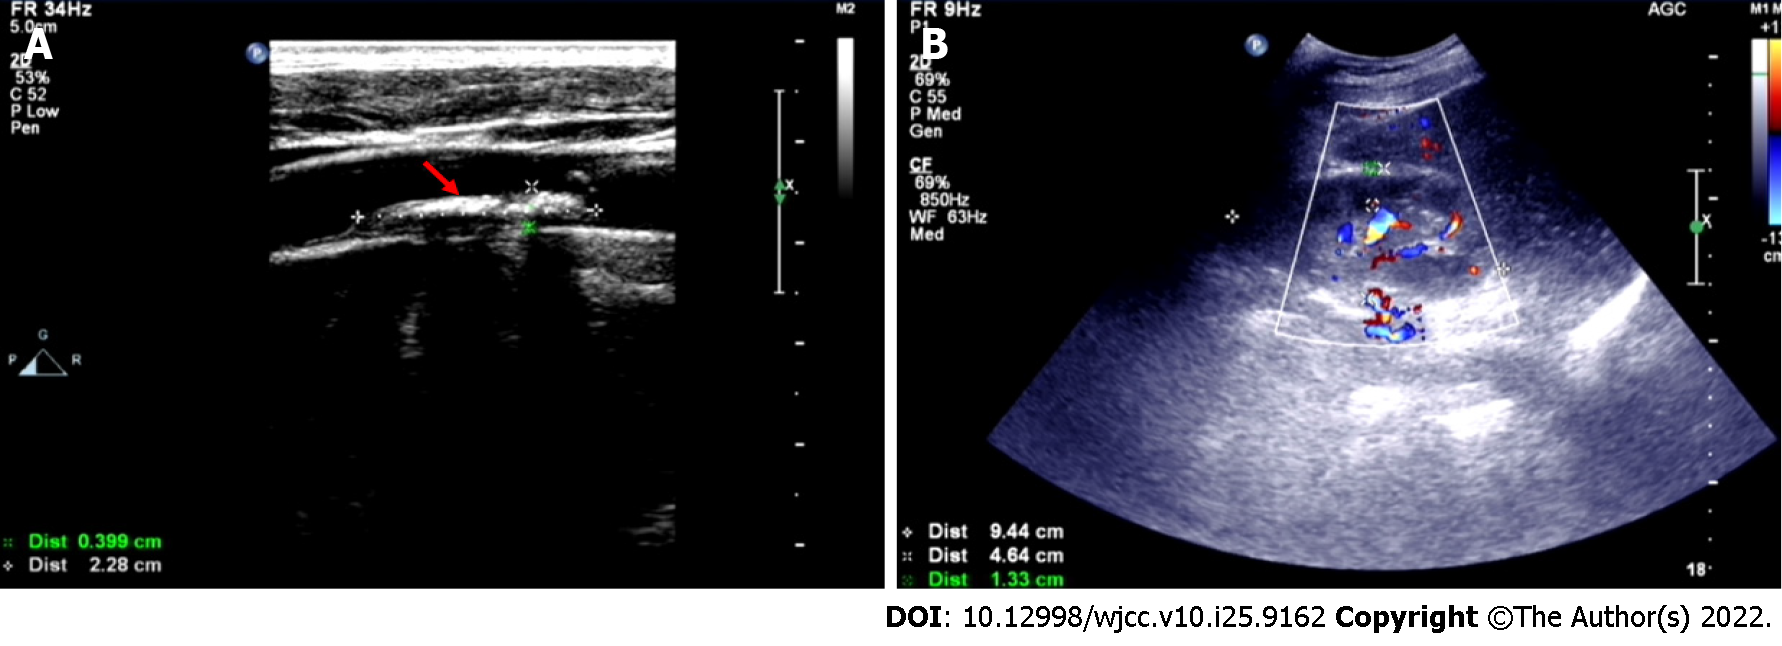
Figure 2 Doppler ultrasonography.
A: The red arrow shows carotid plaque formation; B: Kidney parenchymal thickness was approximately 13.3 mm.
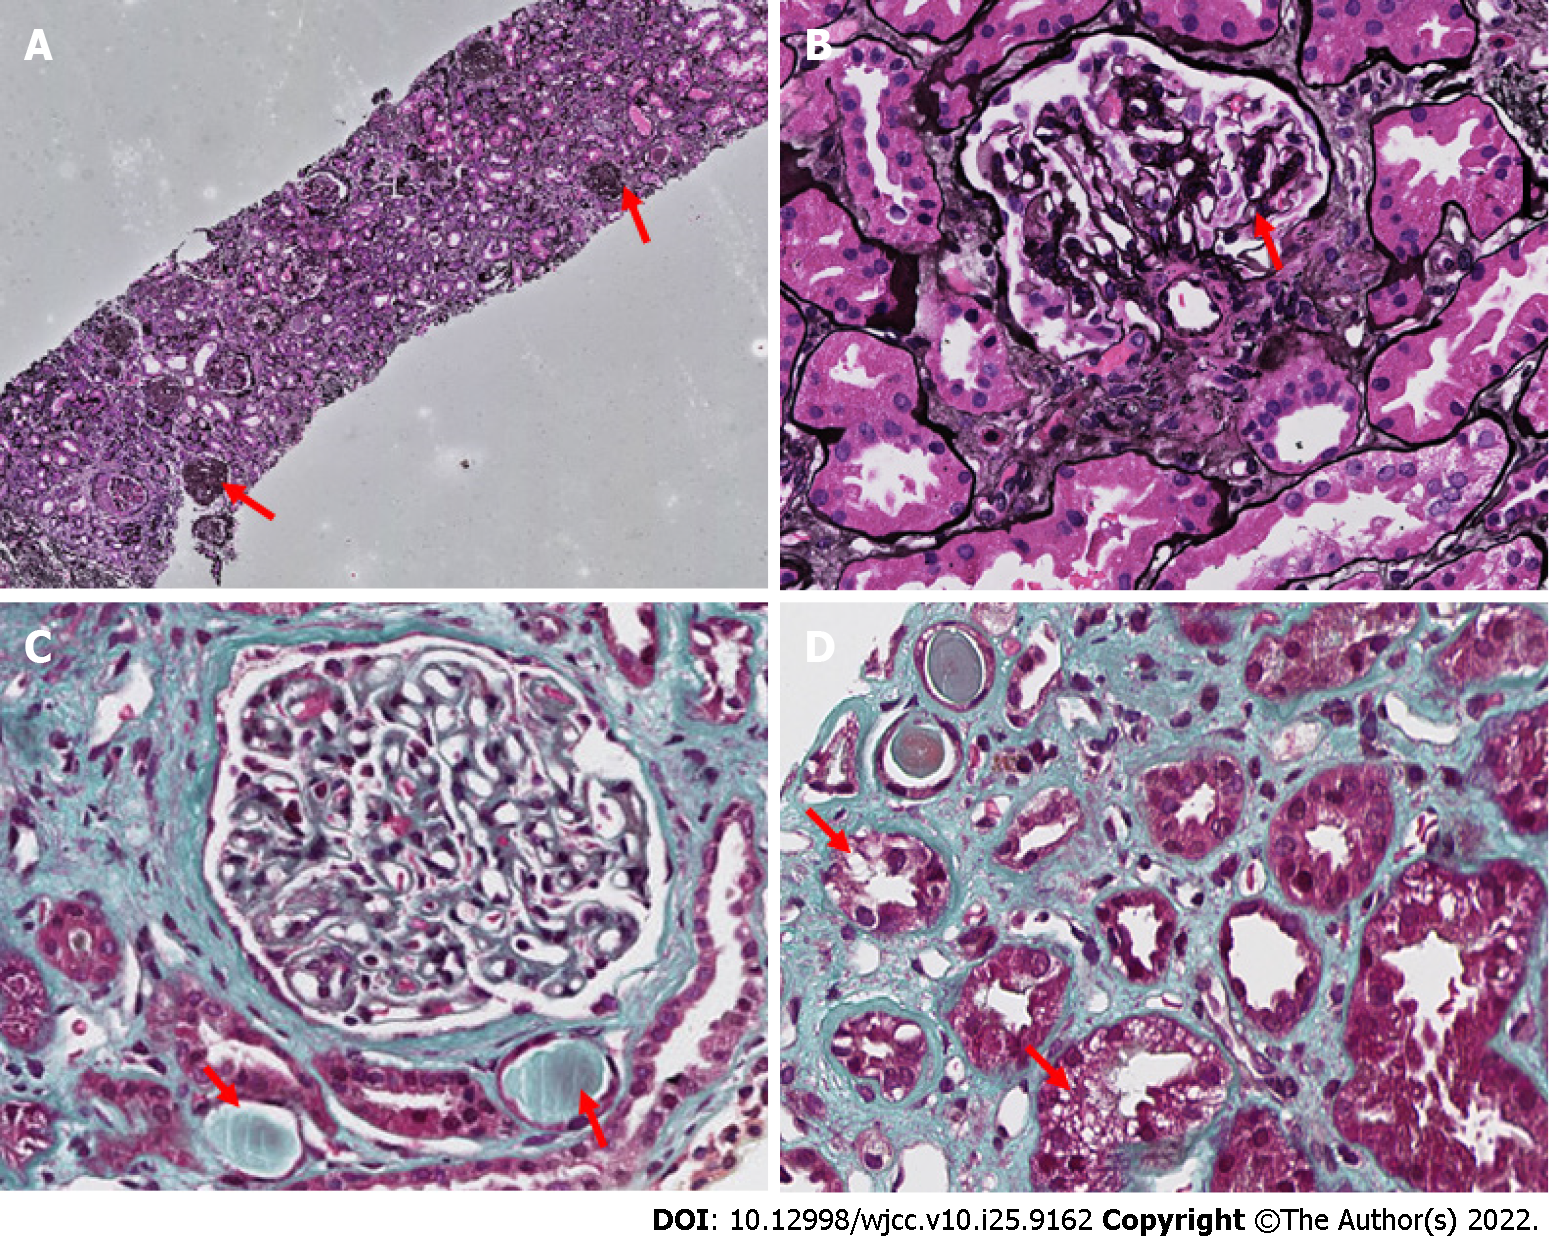
Figure 3 Renal biopsy.
A: Red arrow: Glomerulus ischemic globular sclerosis (x 100); B: Red arrow: Glomerulus ischemic globular sclerosis (x 400); C: Red arrow: Cholesterol embolism filling the arteries (x 400); D: Red arrow: Epithelial cell cavitation and granular degeneration (x 400).
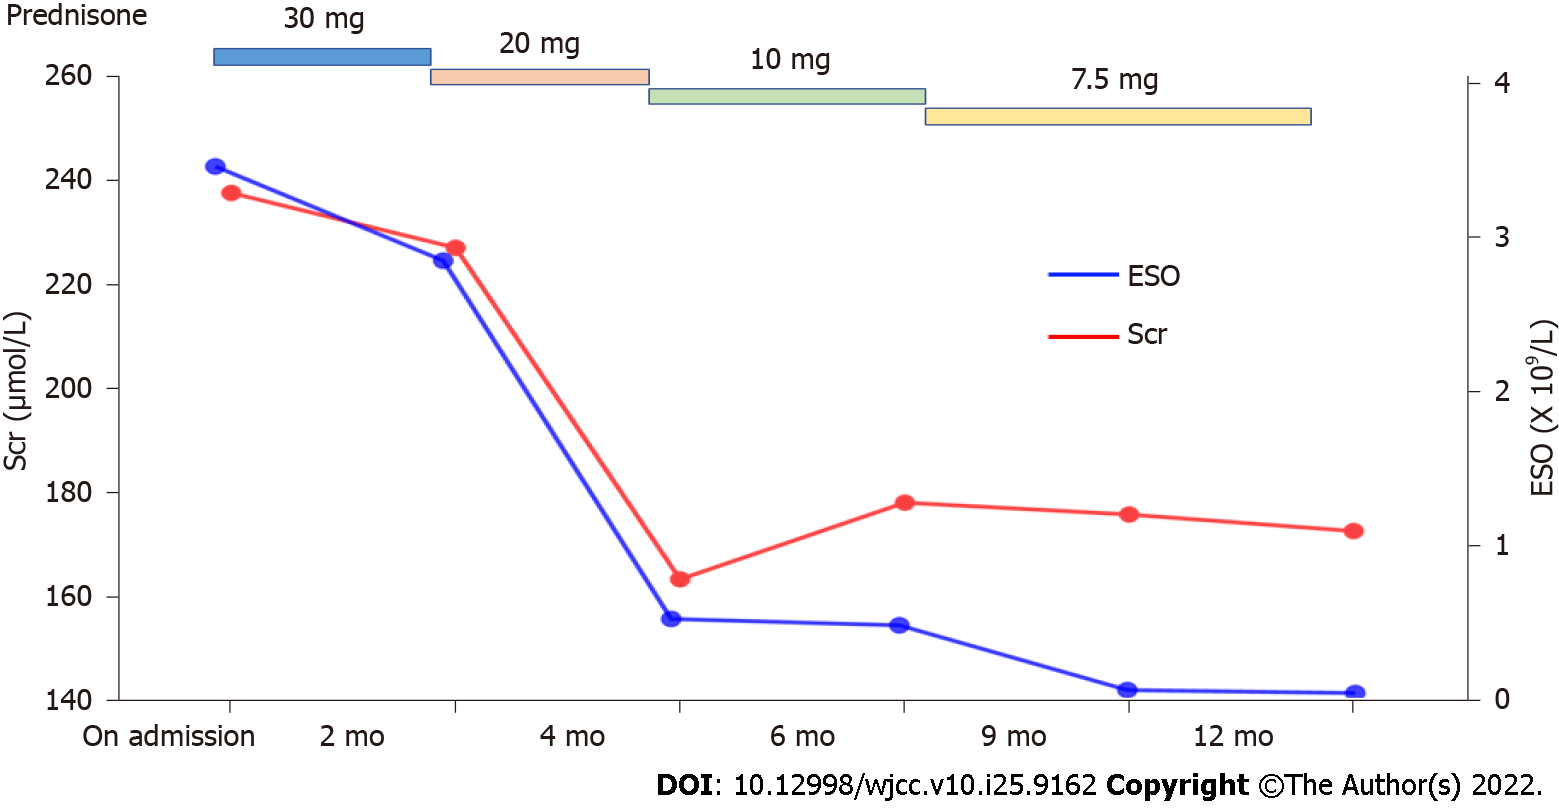
Figure 4 Follow-up period over 12 mo.
The reduced regimen of prednisone and the level of serum creatine and eosinophil count are shown. Scr: Serum creatine; ESO: Eosinophil count.
- Citation: Cheng DJ, Li L, Zheng XY, Tang SF. Idiopathic cholesterol crystal embolism with atheroembolic renal disease and blue toes syndrome: A case report. World J Clin Cases 2022; 10(25): 9162-9167
- URL: https://www.wjgnet.com/2307-8960/full/v10/i25/9162.htm
- DOI: https://dx.doi.org/10.12998/wjcc.v10.i25.9162


