Copyright
©The Author(s) 2022.
World J Clin Cases. Aug 16, 2022; 10(23): 8375-8383
Published online Aug 16, 2022. doi: 10.12998/wjcc.v10.i23.8375
Published online Aug 16, 2022. doi: 10.12998/wjcc.v10.i23.8375
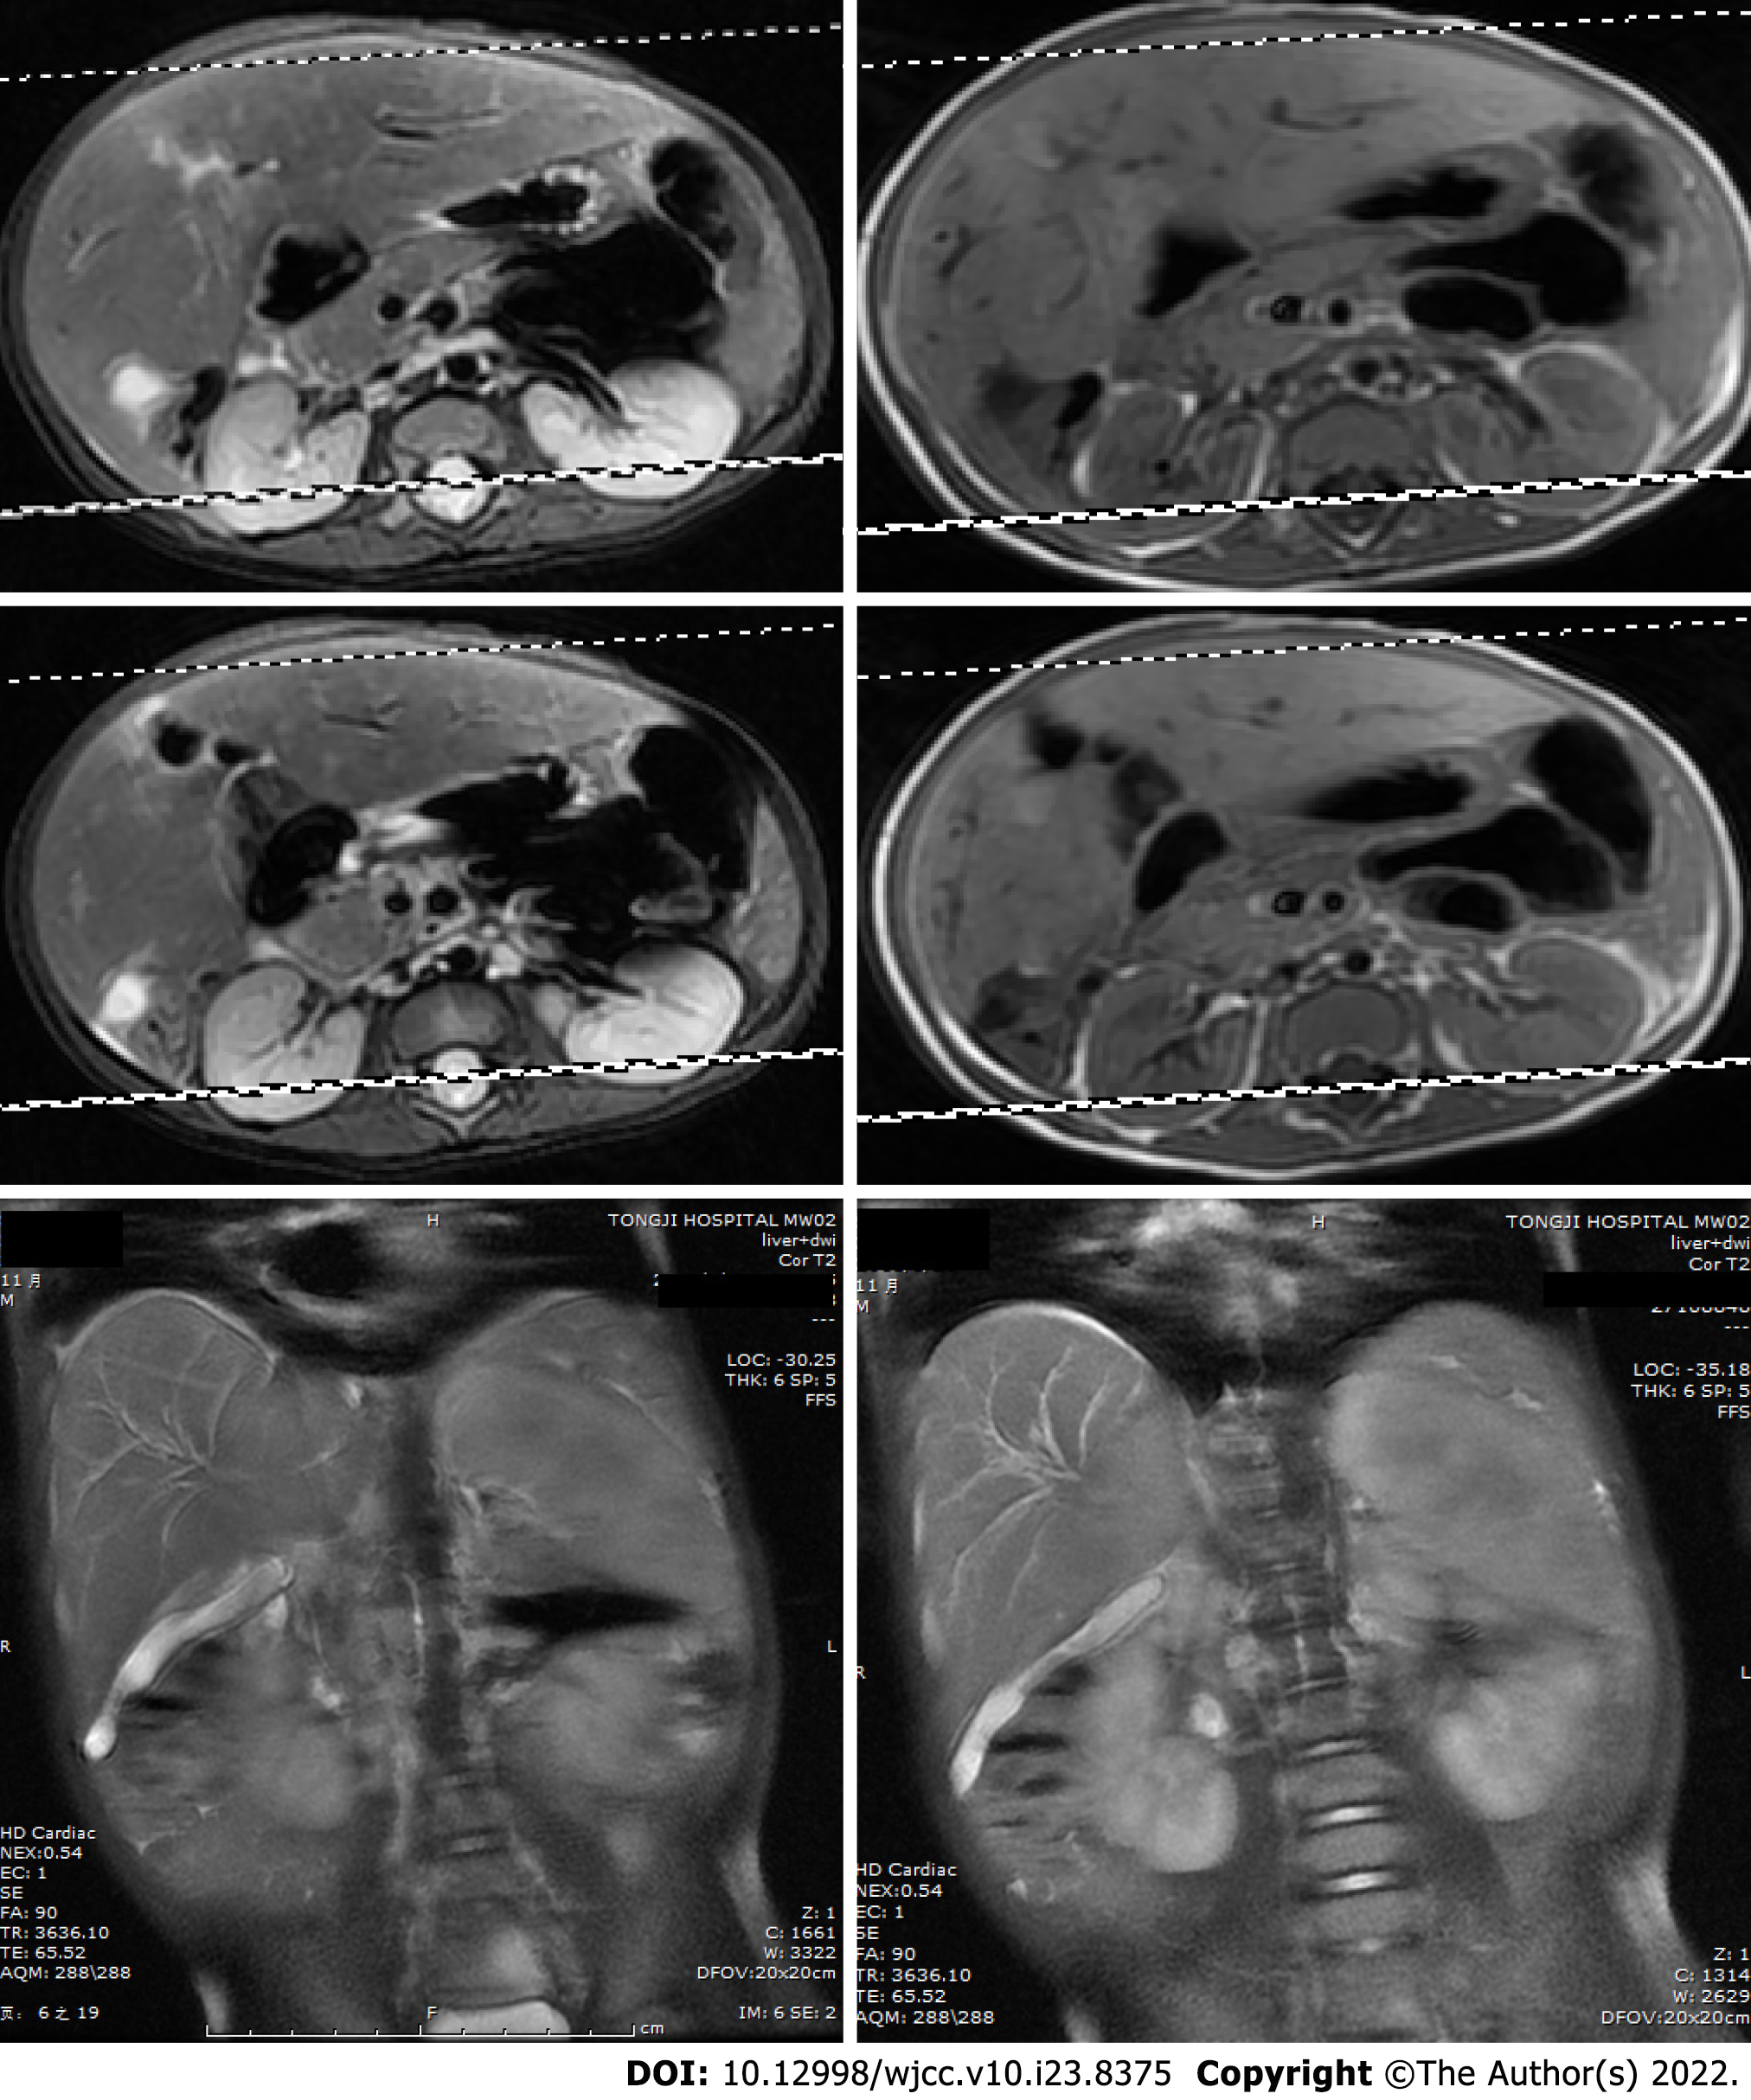
Figure 1 Diffusion-weighted magnetic resonance imaging of the abdomen.
Diffusion-weighted magnetic resonance imaging (DWI-MRI) showed that the patient’s intrahepatic bile ducts were dilated, and that the number of blood vessels of the porta hepatis were increased. The gallbladder could not be clearly seen. Short T1 and long T2 signals were found between the liver and the right kidney, which were displayed as hyperintense on the DWI.
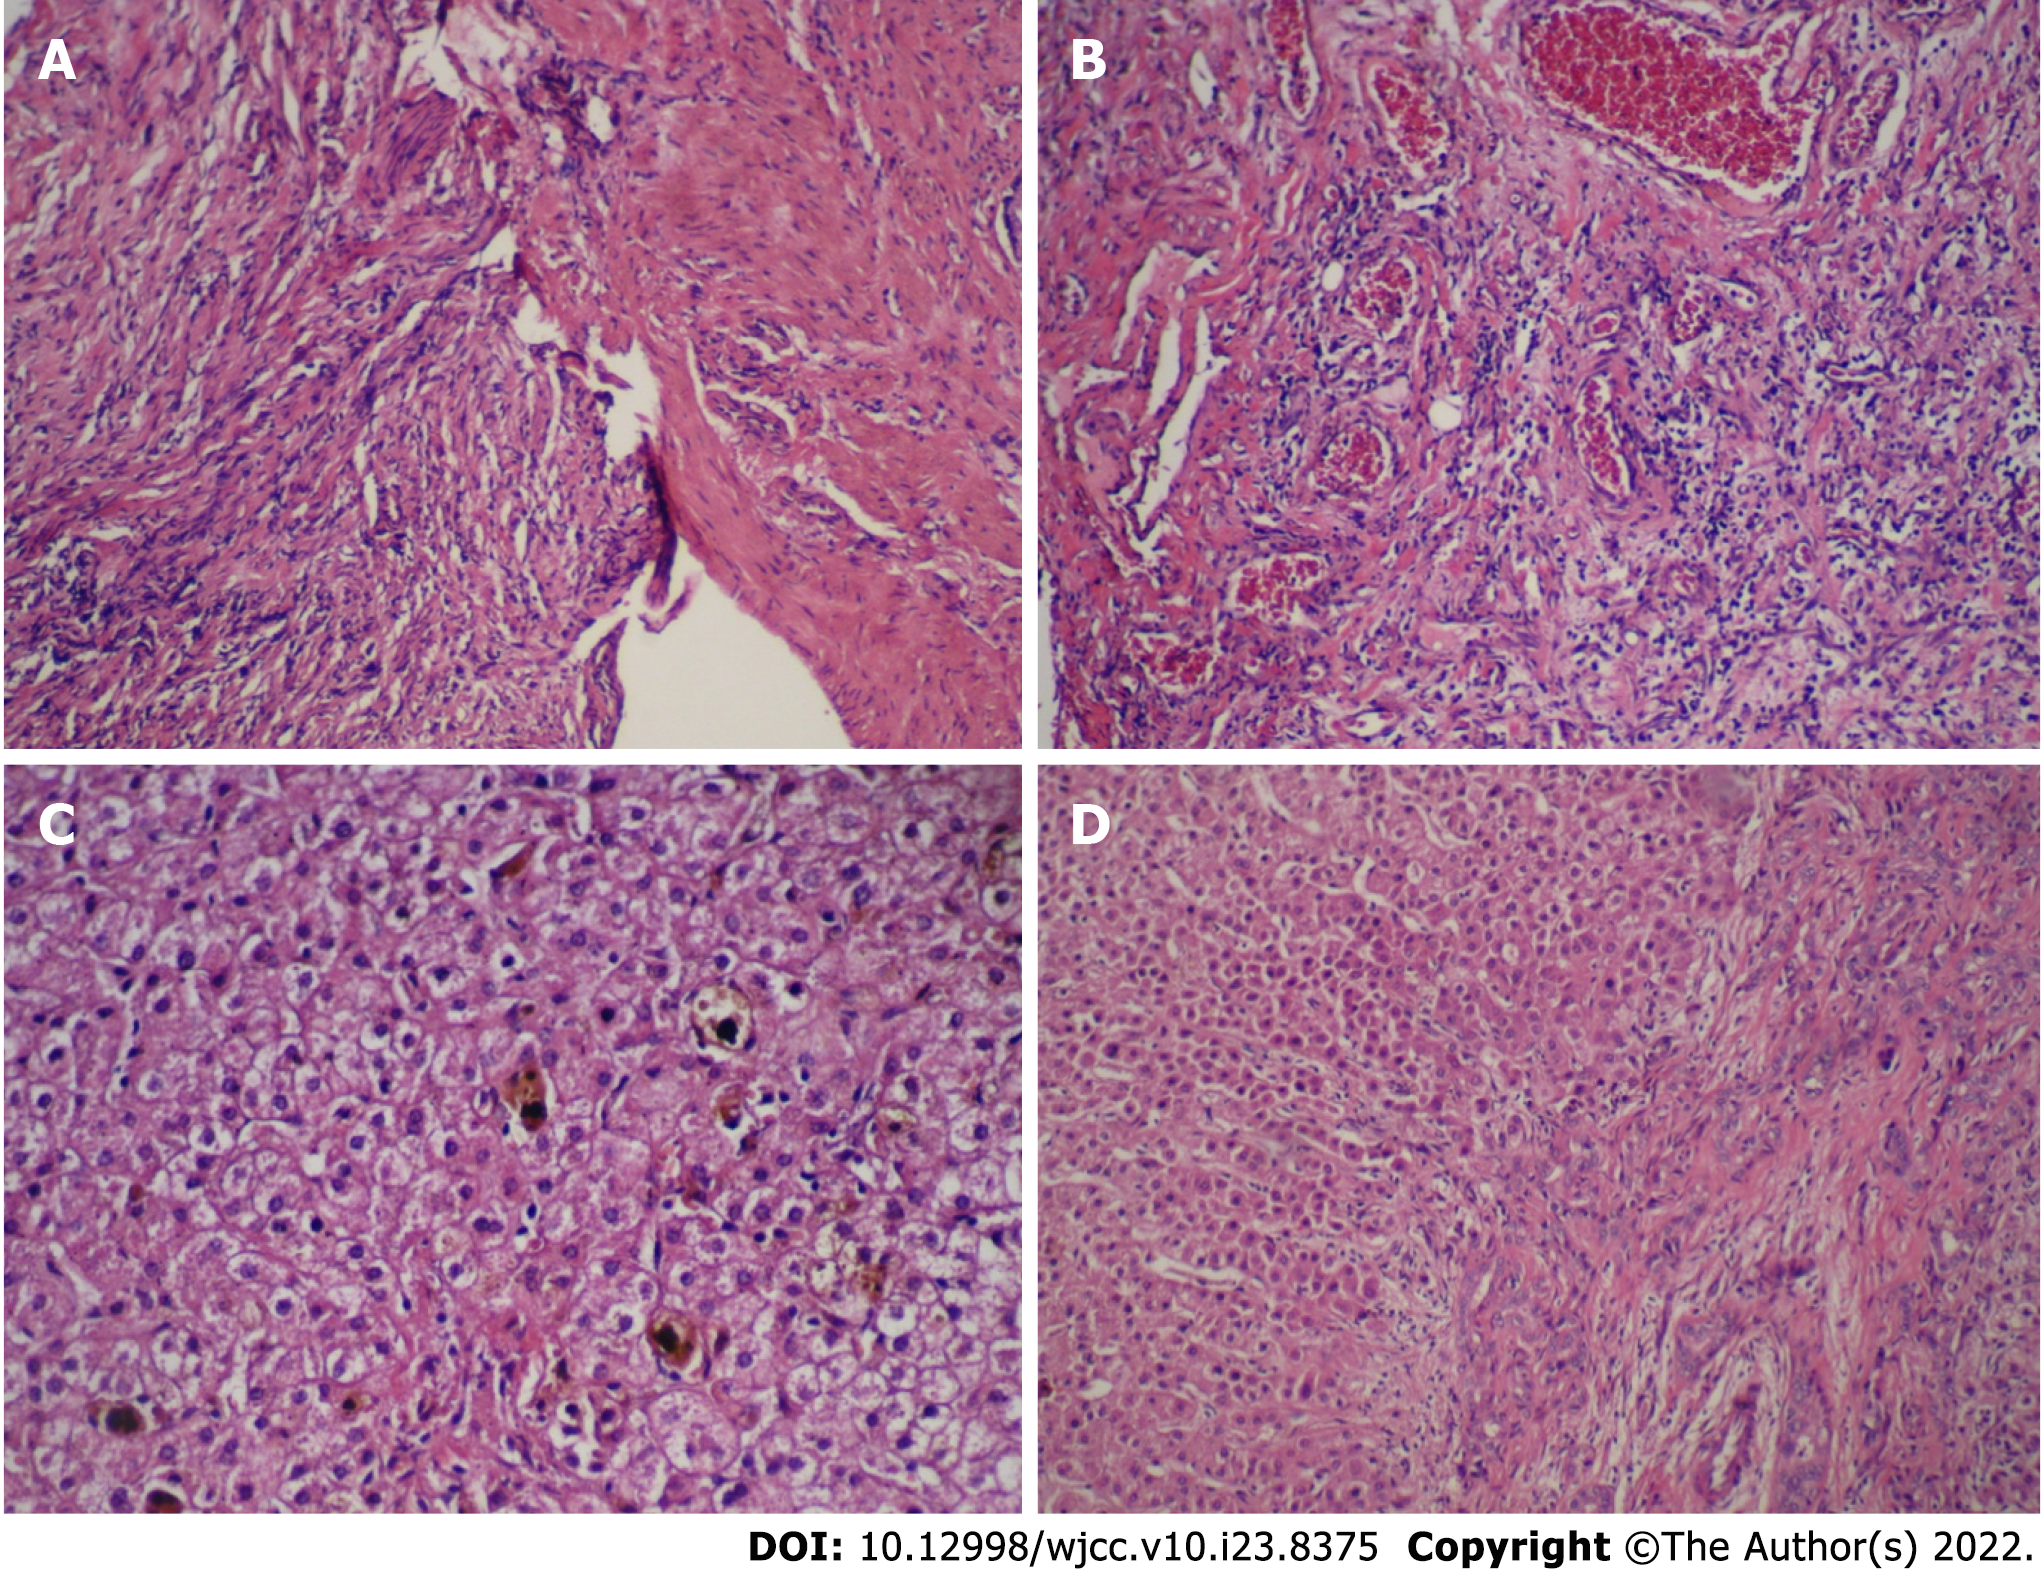
Figure 2 The hematoxylin-eosin staining for the tumor and the liver tissue.
A and B: Inflammatory myofibroblastic tumor of the biliary duct composed of spindle cells, fibrous tissue and abundant small vessels in a background of inflammatory cellular infiltration and myxoid stroma (A: Original magnification: 100 ×; scale bar: 100 μm; and B: Original magnification: 400 ×; scale bar: 100 μm.); C and D: The bile canaliculus hyperplasia, hepatic fibrosis, and lymphocytes infiltration accompanied with hepatocyte degeneration and cholestasis could be observed at portal area (C: Original magnification: 400 ×; scale bar: 100 μm; and D: Original magnification: 100 ×; scale bar: 100 μm).
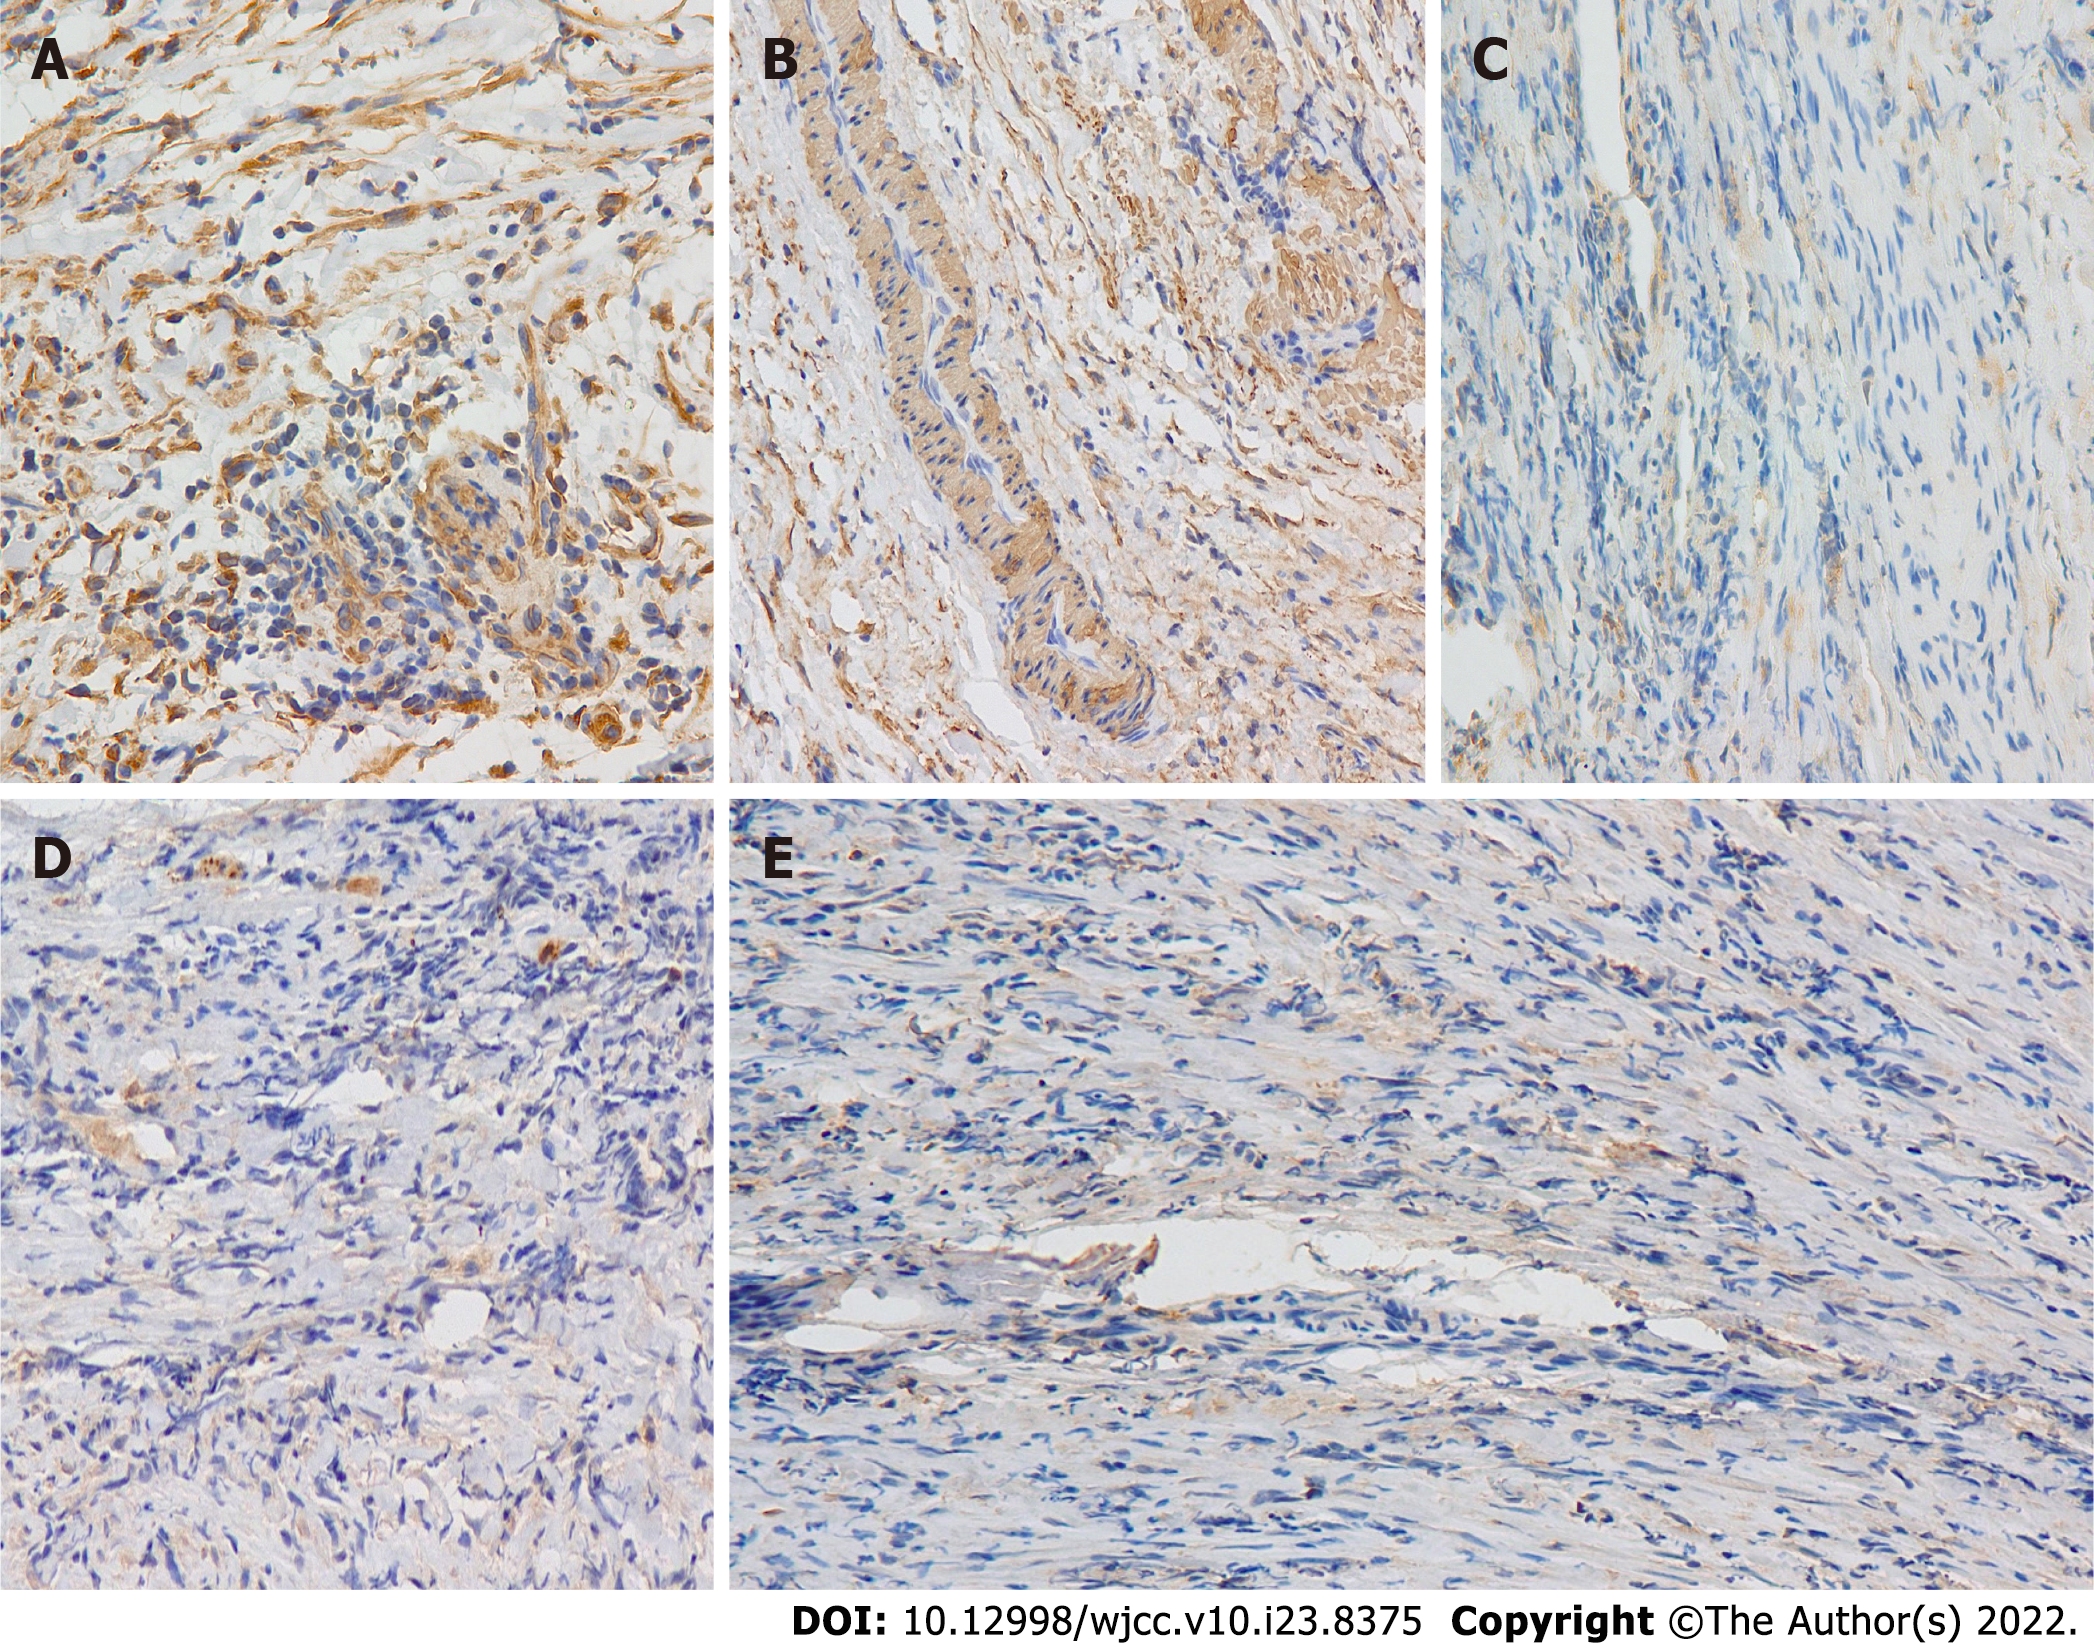
Figure 3 Photomicrograph.
A and B: Photomicrograph of inflammatory myofibroblastic tumor showing immunohistochemical positive for vimentin and smooth muscle actin (A: Original magnification: 400 ×; scale bar: 100 μm; and B: Original magnification: 200 ×; scale bar: 100 μm); C-E: Photomicrograph of inflammatory myofibroblastic tumor showing negative for desmin, S100 and ALK1 (Original magnification: 200 ×; scale bar: 100 μm) (Smooth muscle actin smooth muscle actin).
- Citation: Huang Y, Shu SN, Zhou H, Liu LL, Fang F. Infant biliary cirrhosis secondary to a biliary inflammatory myofibroblastic tumor: A case report and review of literature. World J Clin Cases 2022; 10(23): 8375-8383
- URL: https://www.wjgnet.com/2307-8960/full/v10/i23/8375.htm
- DOI: https://dx.doi.org/10.12998/wjcc.v10.i23.8375


