Copyright
©The Author(s) 2022.
World J Clin Cases. Aug 16, 2022; 10(23): 8336-8343
Published online Aug 16, 2022. doi: 10.12998/wjcc.v10.i23.8336
Published online Aug 16, 2022. doi: 10.12998/wjcc.v10.i23.8336
Figure 1 Cervical ultrasound of the patient before surgery.
A: The right-side nodule (orange arrow) was 58 mm × 41 mm × 67 mm and was classified as TI-RADS 4A; B: The left-side nodule (orange arrow) was 6.4 mm × 8 mm × 8 mm and was classified as TI-RADS 4C.
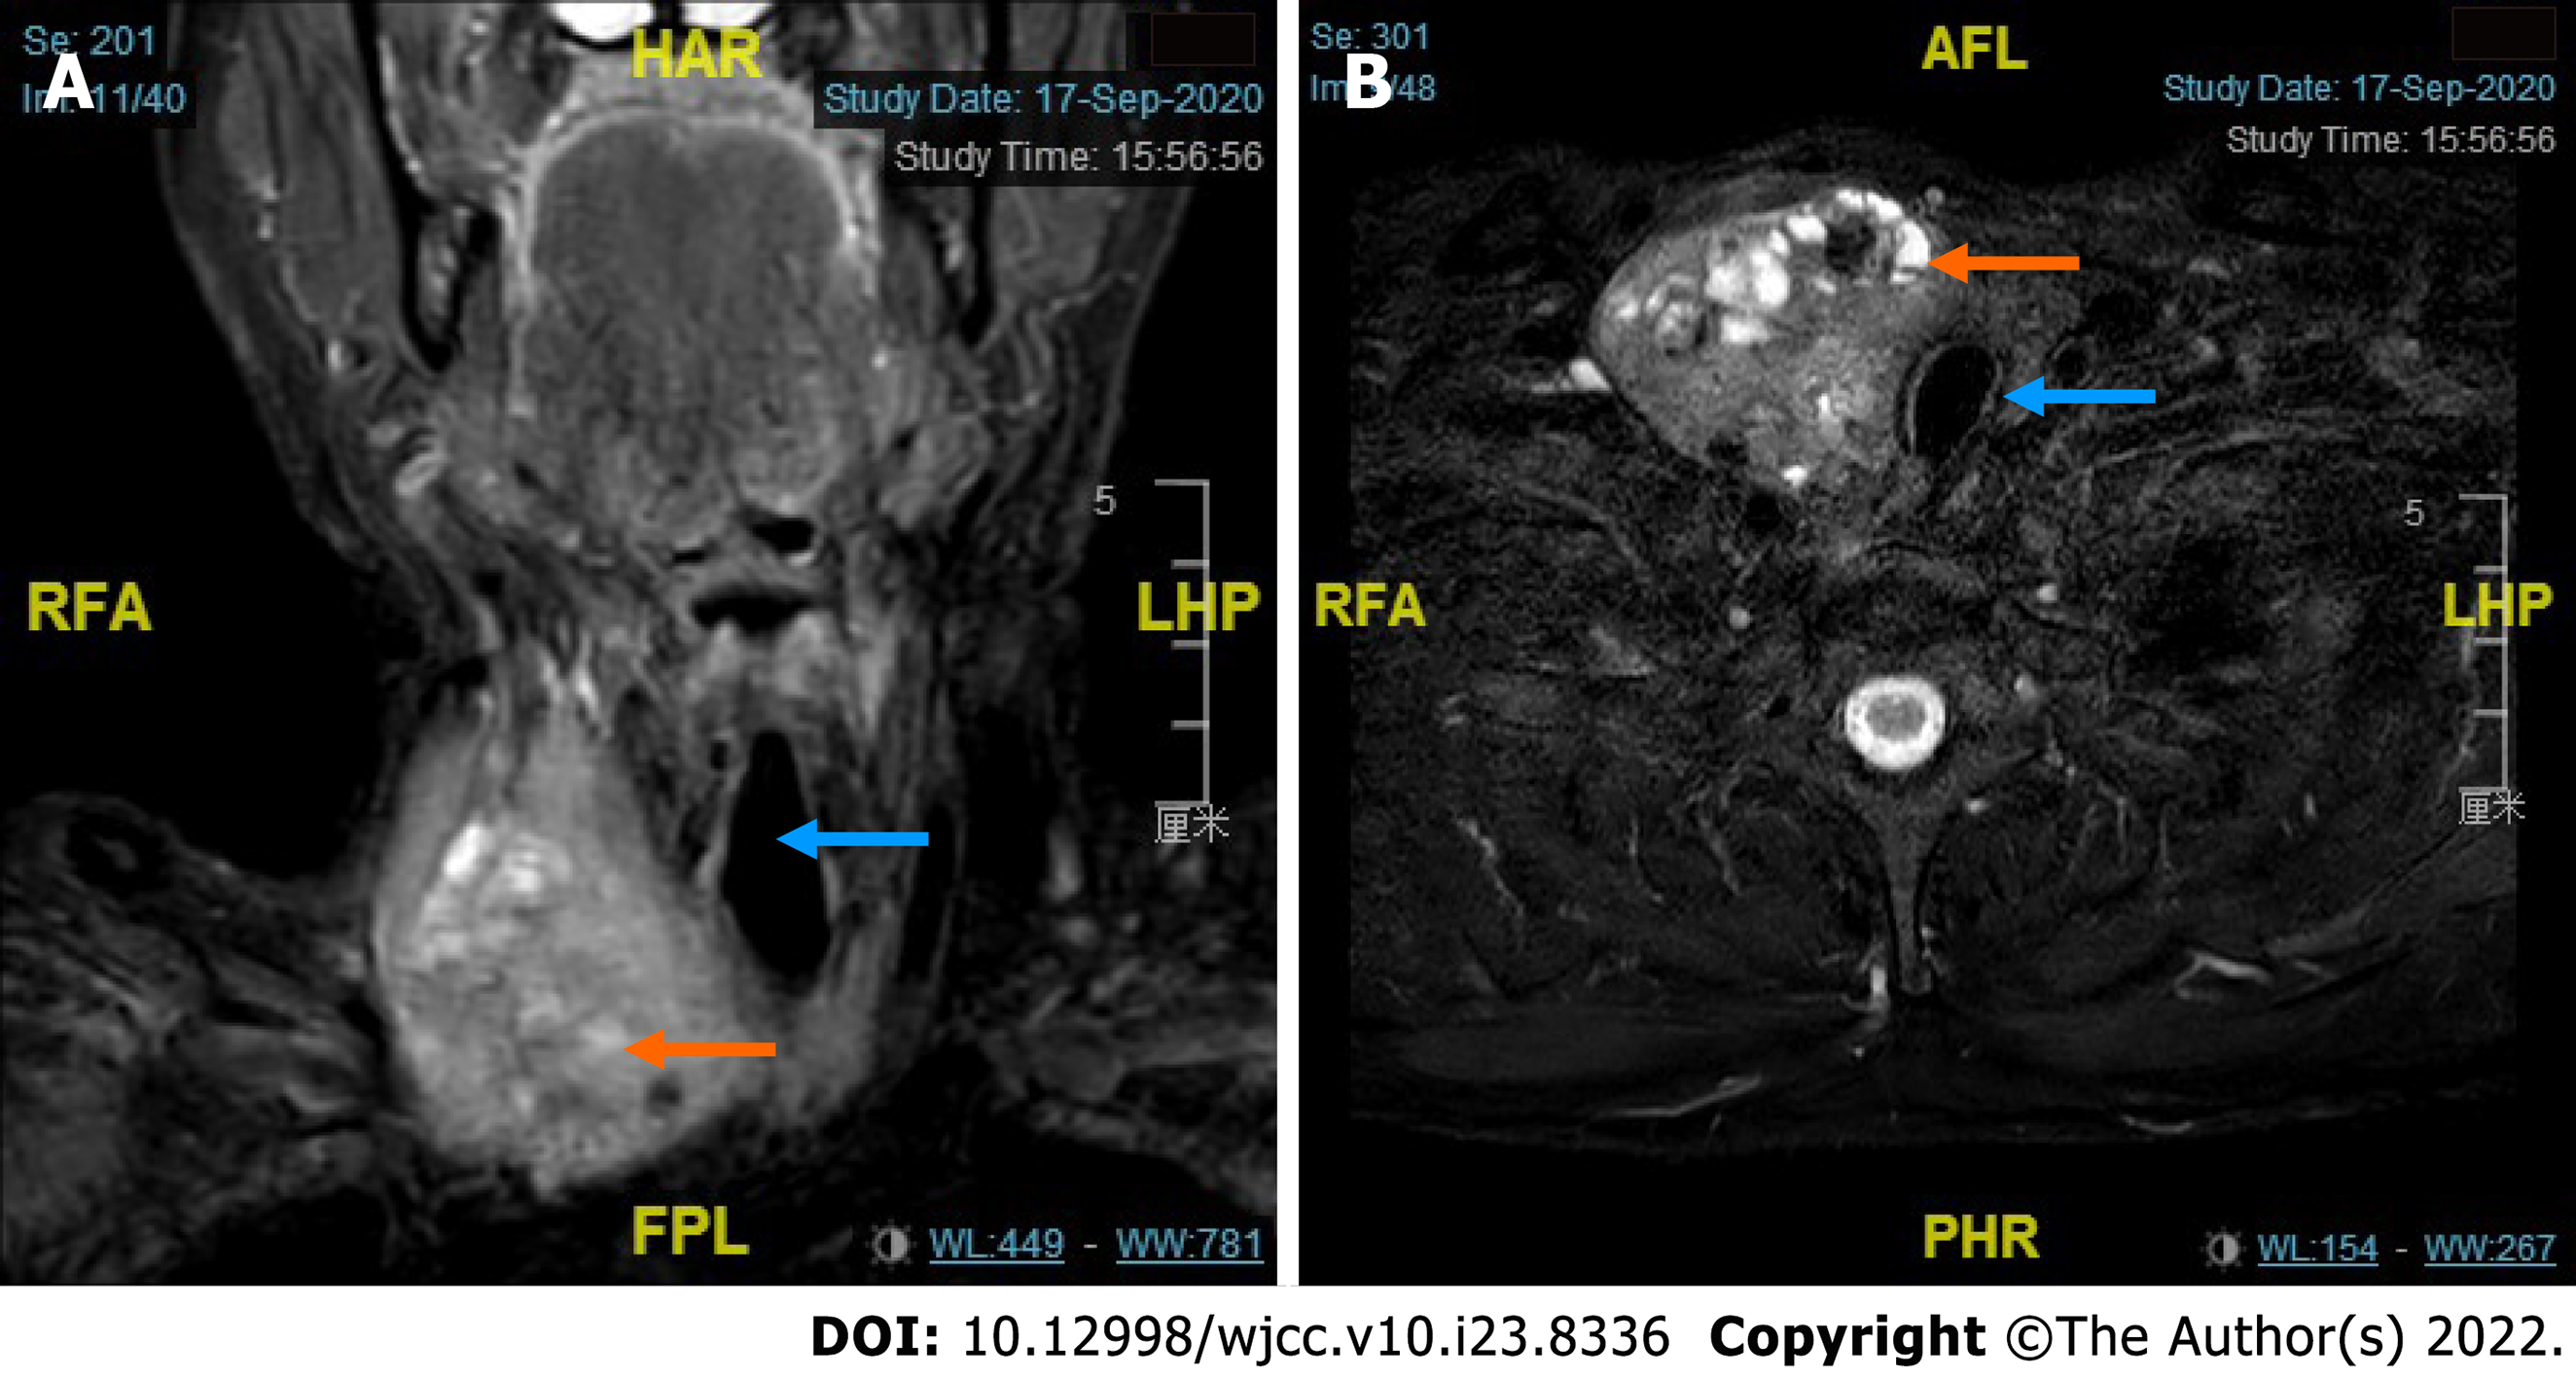
Figure 2 Cervical magnetic resonance imaging of the patient revealing an enlarged thyroid mass.
A and B: Coronal and transverse magnetic resonance imaging showing that the enlarged right-sided thyroid nodule (orange arrow) pushed the trachea (blue arrow) to the left.
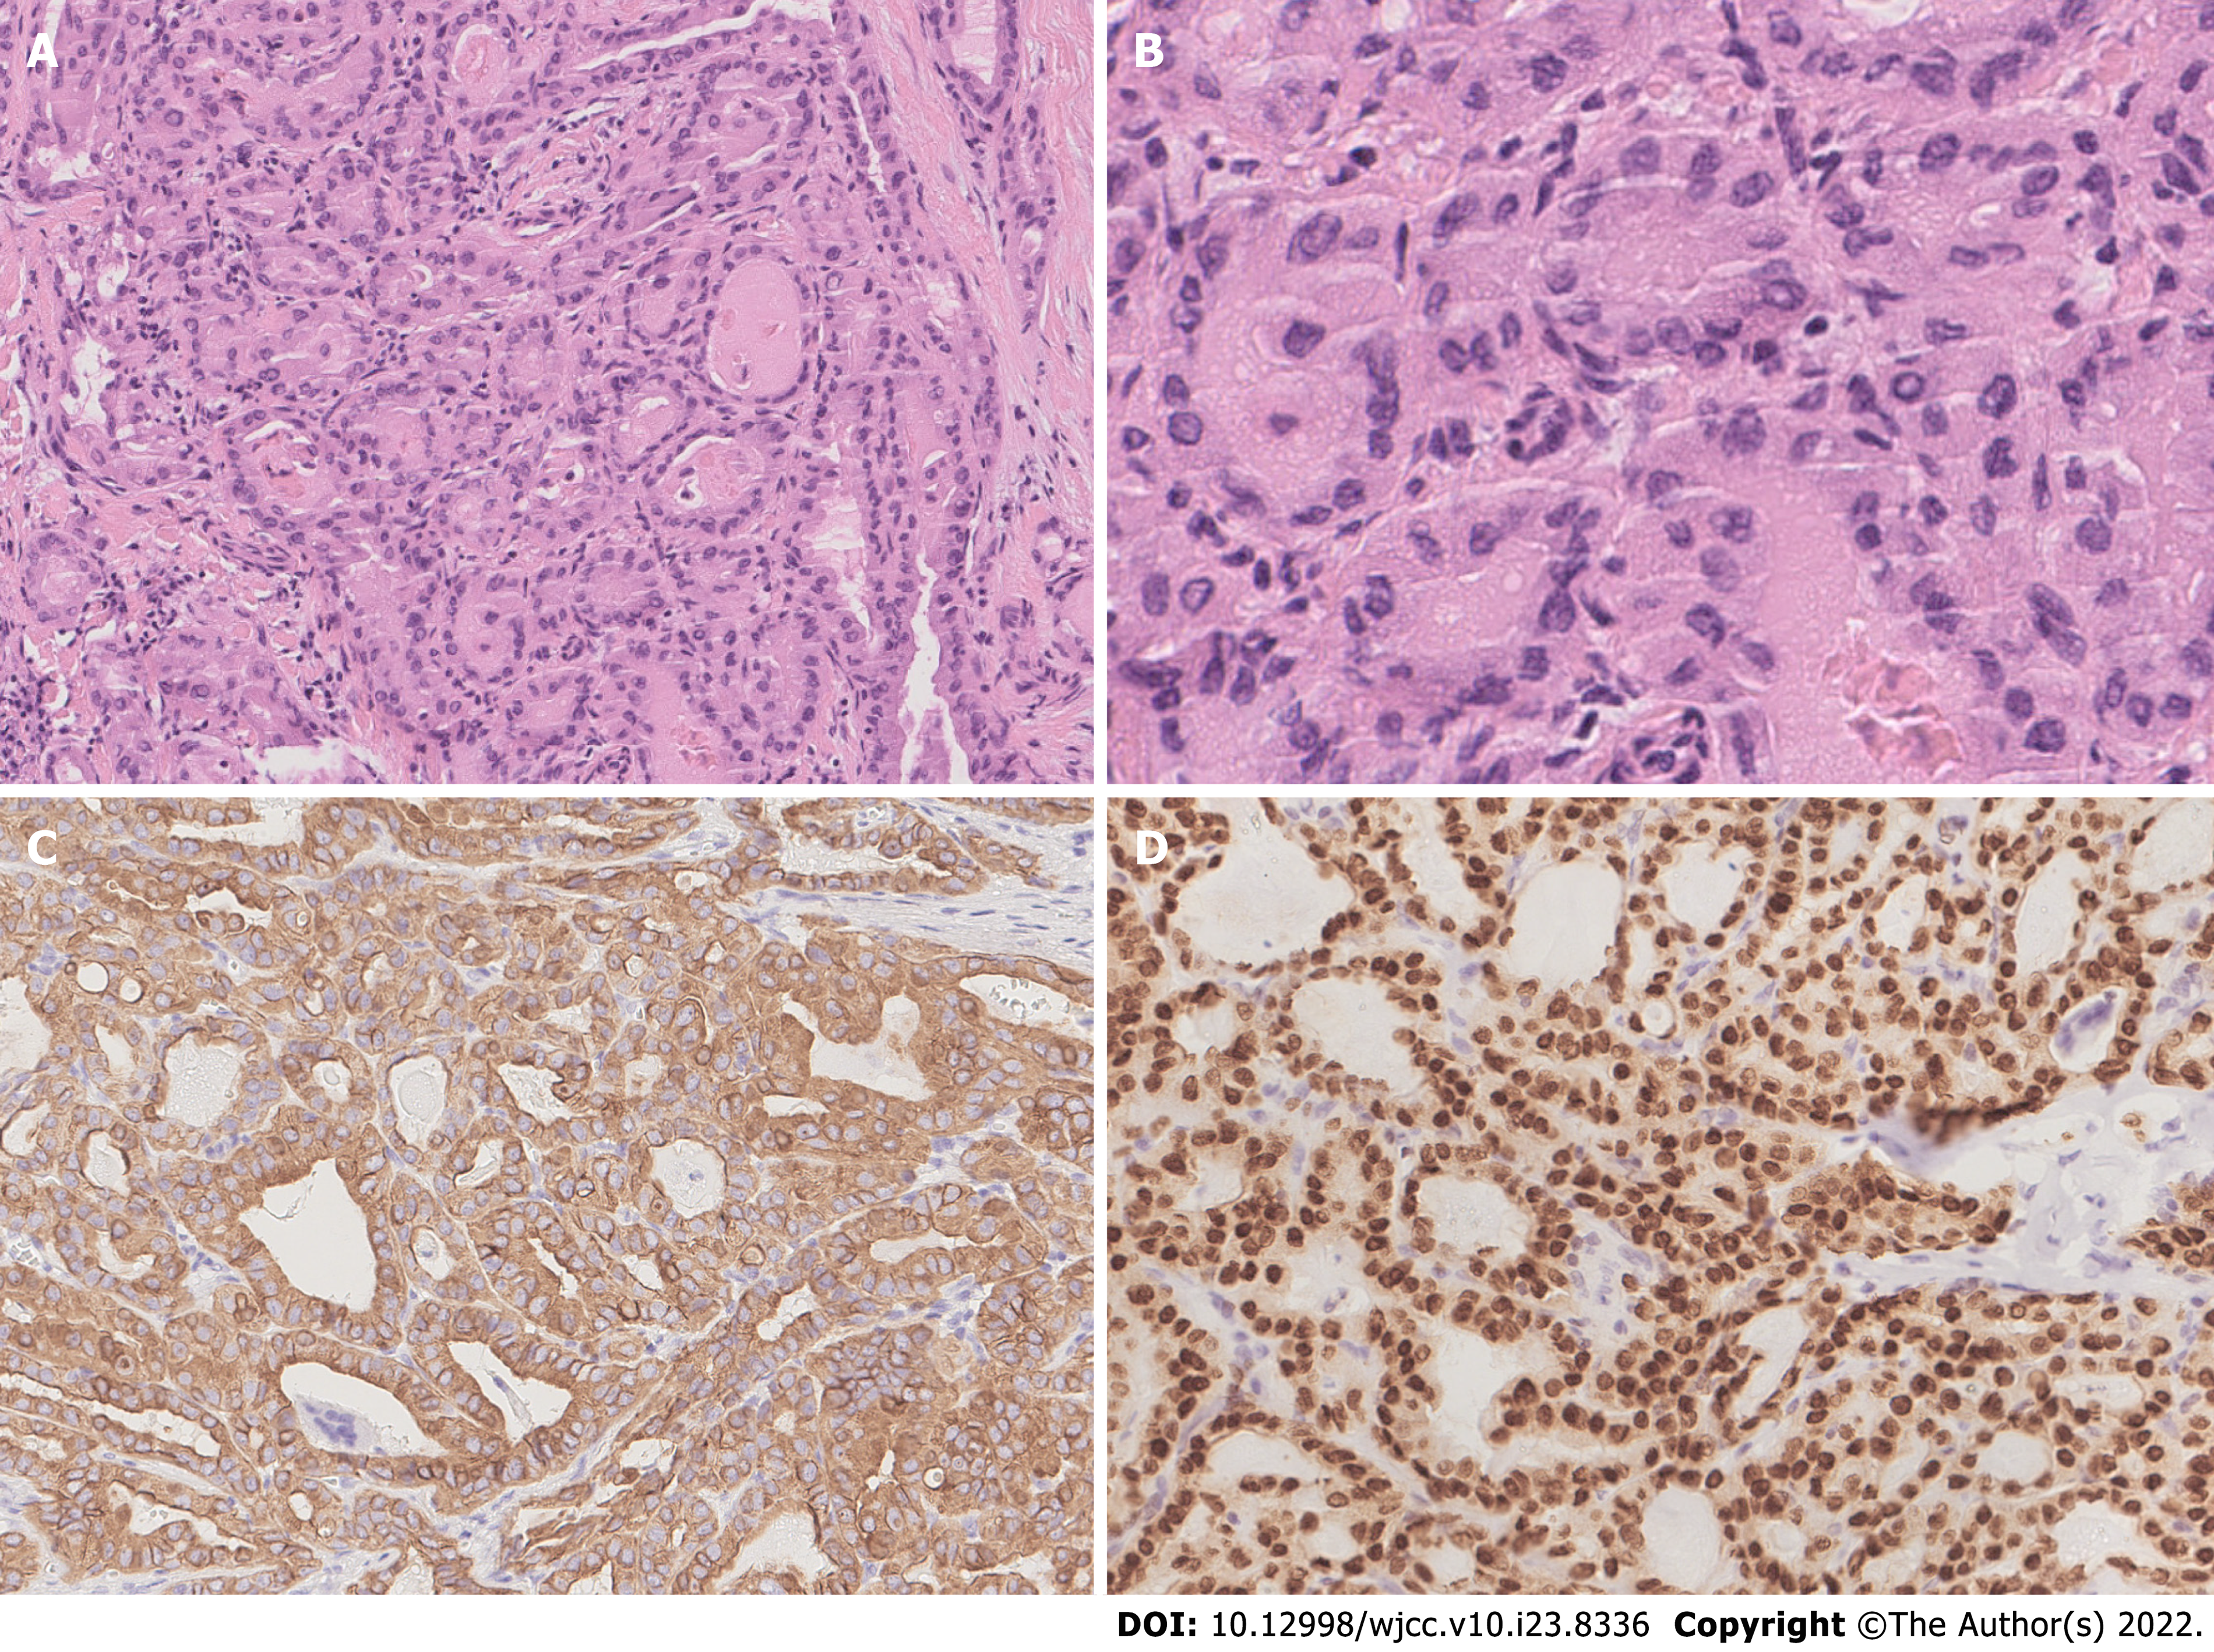
Figure 3 Pathological and immunohistochemical characteristics of papillary thyroid cancer.
A and B: Tumor cells were arranged in a follicular pattern with enlarged nuclei and irregular nuclear membranes, indicating papillary thyroid cancer (PTC) (A: H&E, × 100; B: H&E, × 400); C: PTC cells were strongly positive for CK19 (IHC, × 200); D: PTC cells were strongly positive for TTF1 (IHC, × 200).
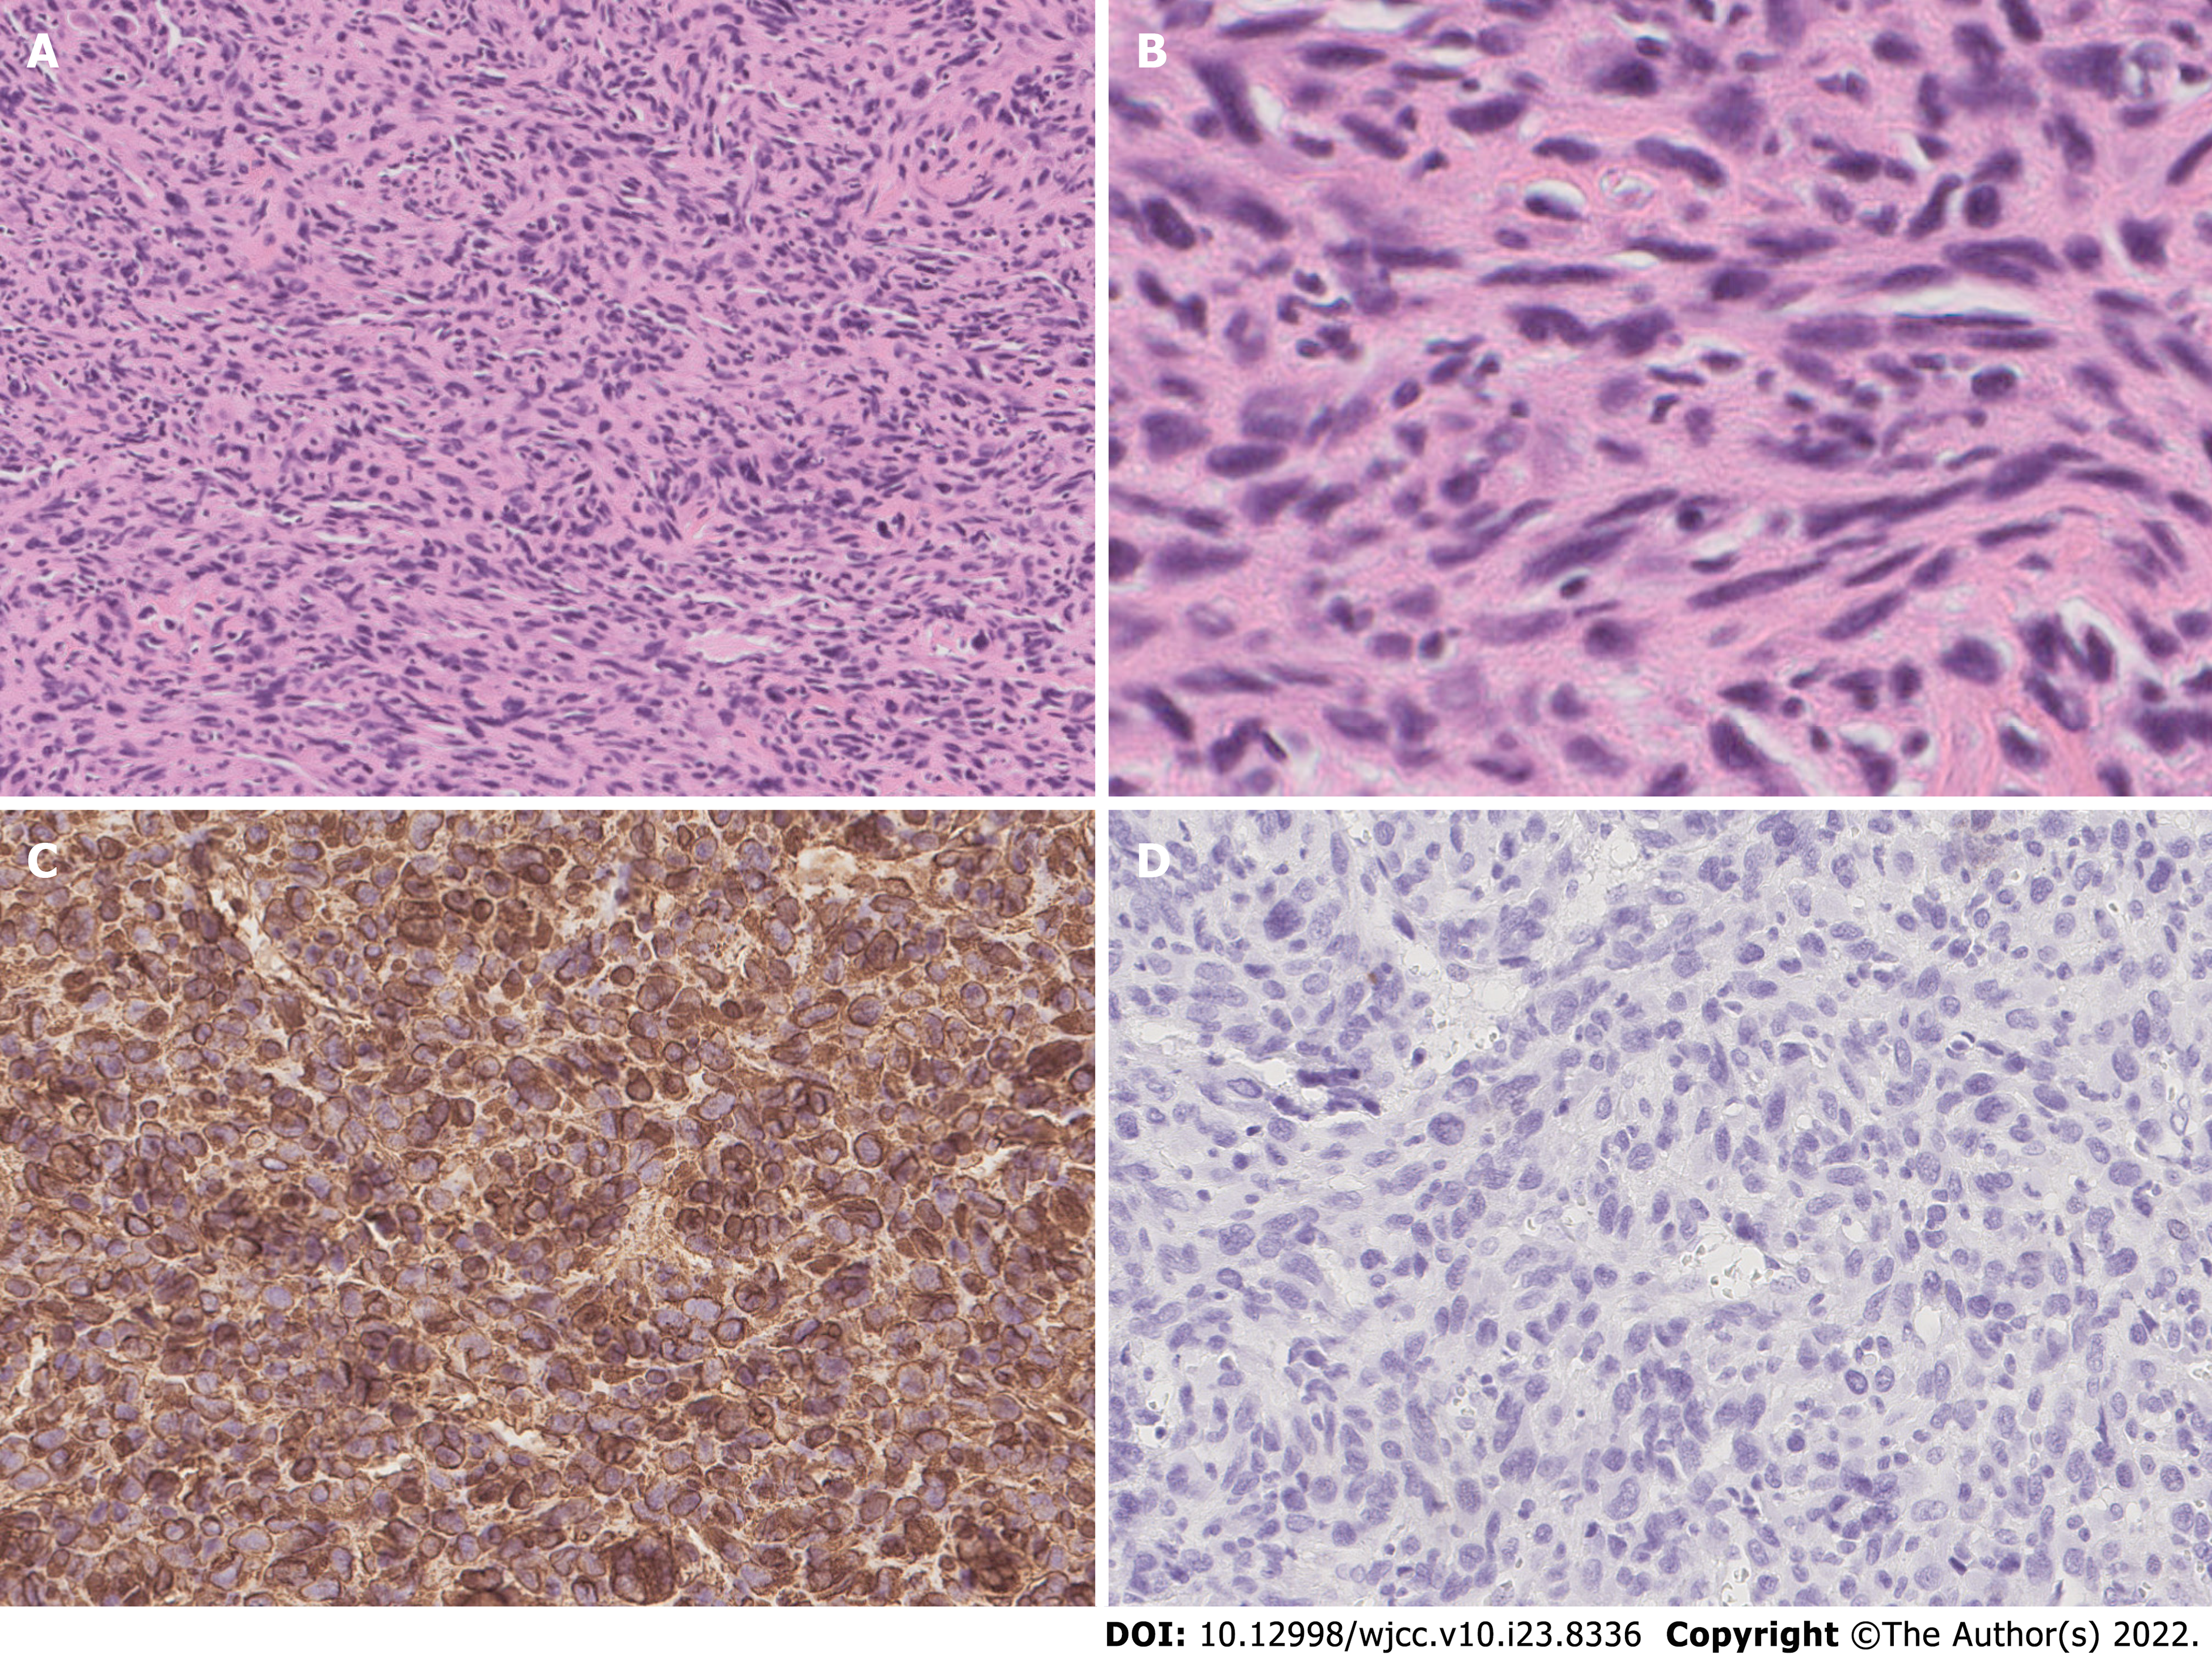
Figure 4 Pathological and immunohistochemical characteristics of undifferentiated pleomorphic sarcoma.
A and B: Tumor cells were spindle-shaped, round, and ovoid with irregular nuclei and frequent mitoses (A: H&E, × 100; B: H&E, × 400); C: Tumor cells were strongly positive for vimentin (IHC, × 200); D: Tumor cells were negative for CK19 (IHC, × 200).
Figure 5 Pathology result of the right nodule showing both papillary thyroid cancer and undifferentiated pleomorphic sarcoma.
A: The papillary component (yellow square) grew within the pleomorphic spindle cell component (H&E, × 25); B: High-power magnification of the yellow-square area in A. In the high-power field, the papillary component showed characteristics of papillary thyroid cancer (PTC) (H&E, × 200); C: CK19 staining showed CK19-positive components (orange arrows), which suggested PTC cells, and the other CK19-negative cells were undifferentiated pleomorphic sarcoma cells (IHC, × 200).
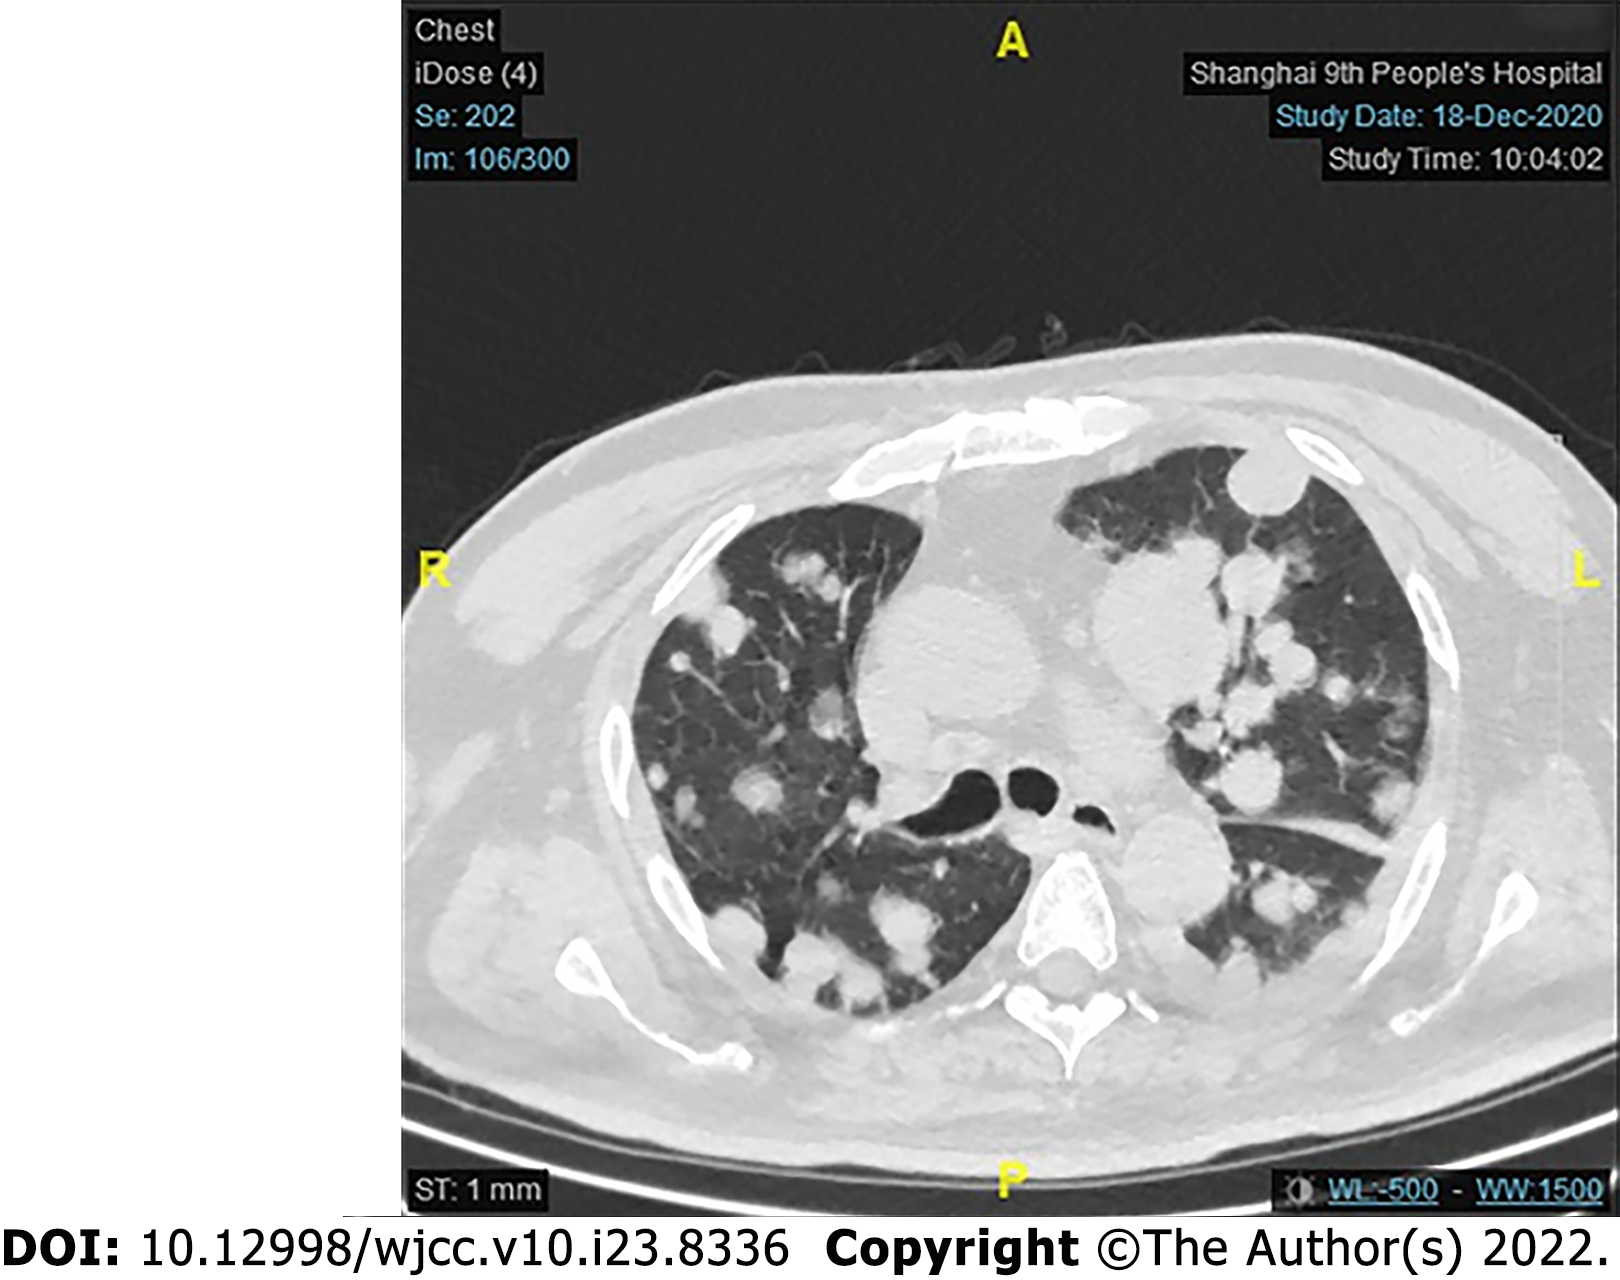
Figure 6 Computed tomography of the lung metastasis.
Computed tomography three months after surgery showing multiple solid nodules in both lung fields, indicating metastasis, and a larger number of and larger nodules in the left lower lobe. The largest lesion was 25 mm.
- Citation: Lee YL, Cheng YQ, Zhu CF, Huo HZ. Papillary thyroid carcinoma occurring with undifferentiated pleomorphic sarcoma: A case report. World J Clin Cases 2022; 10(23): 8336-8343
- URL: https://www.wjgnet.com/2307-8960/full/v10/i23/8336.htm
- DOI: https://dx.doi.org/10.12998/wjcc.v10.i23.8336


