Copyright
©The Author(s) 2022.
World J Clin Cases. Aug 16, 2022; 10(23): 8304-8311
Published online Aug 16, 2022. doi: 10.12998/wjcc.v10.i23.8304
Published online Aug 16, 2022. doi: 10.12998/wjcc.v10.i23.8304
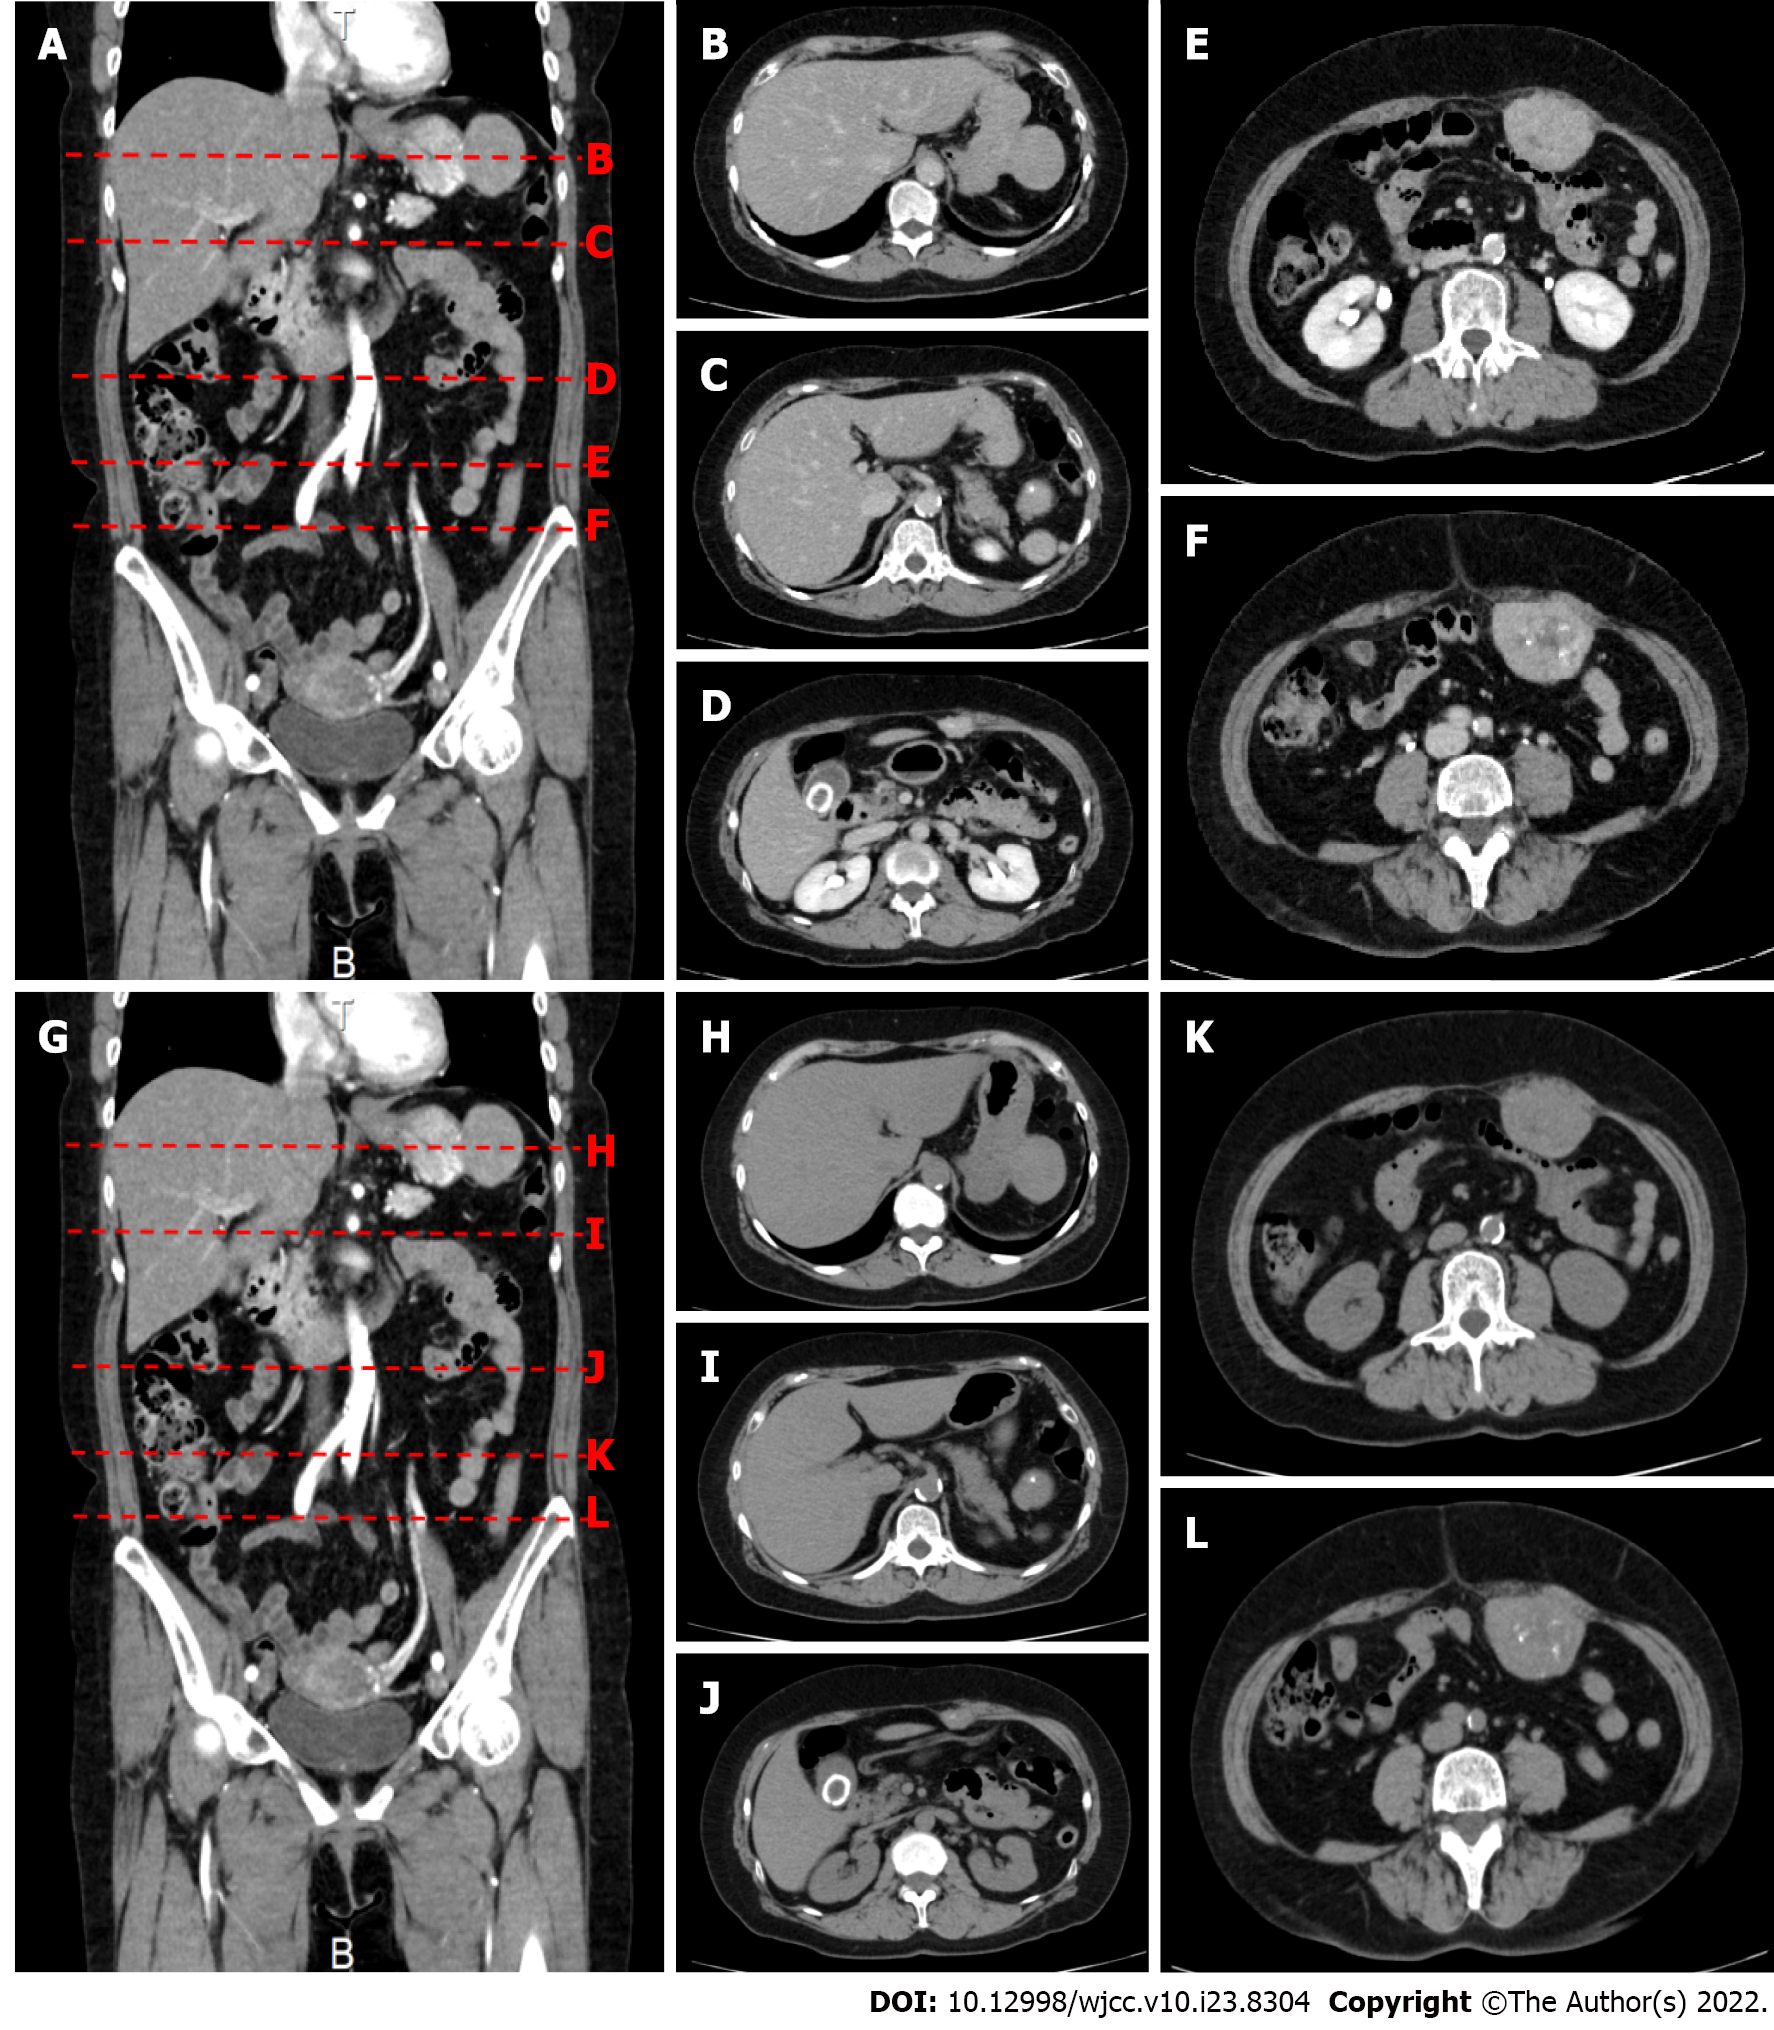
Figure 1 Contrast-enhanced computed tomography shows a 50 mm × 40 mm × 48 mm mass protruding from below the serosa at the greater curvature of the upper stomach.
A: Contrast enhancement is observed in the arterial phase; B and H: A 50 mm × 40 mm × 48 mm mass protrudes outward from the greater curvature of the upper stomach; C and I: A nodule about 7 mm in size is found near the accessory spleen; D and J: Three masses protruding from the abdominal wall into the peritoneal cavity are also observed. The most cranial abdominal wall mass measures 28 mm × 16 mm × 18 mm and has irregular margins; E and K: The middle abdominal wall mass measures 55 mm × 42 mm × 36 mm and has irregular margins; F and L: The most caudal abdominal wall mass measures 55 mm × 44 mm × 55 mm and has irregular margins. All of these masses show internal calcification and contrast enhancement; G: Plain computed tomography.
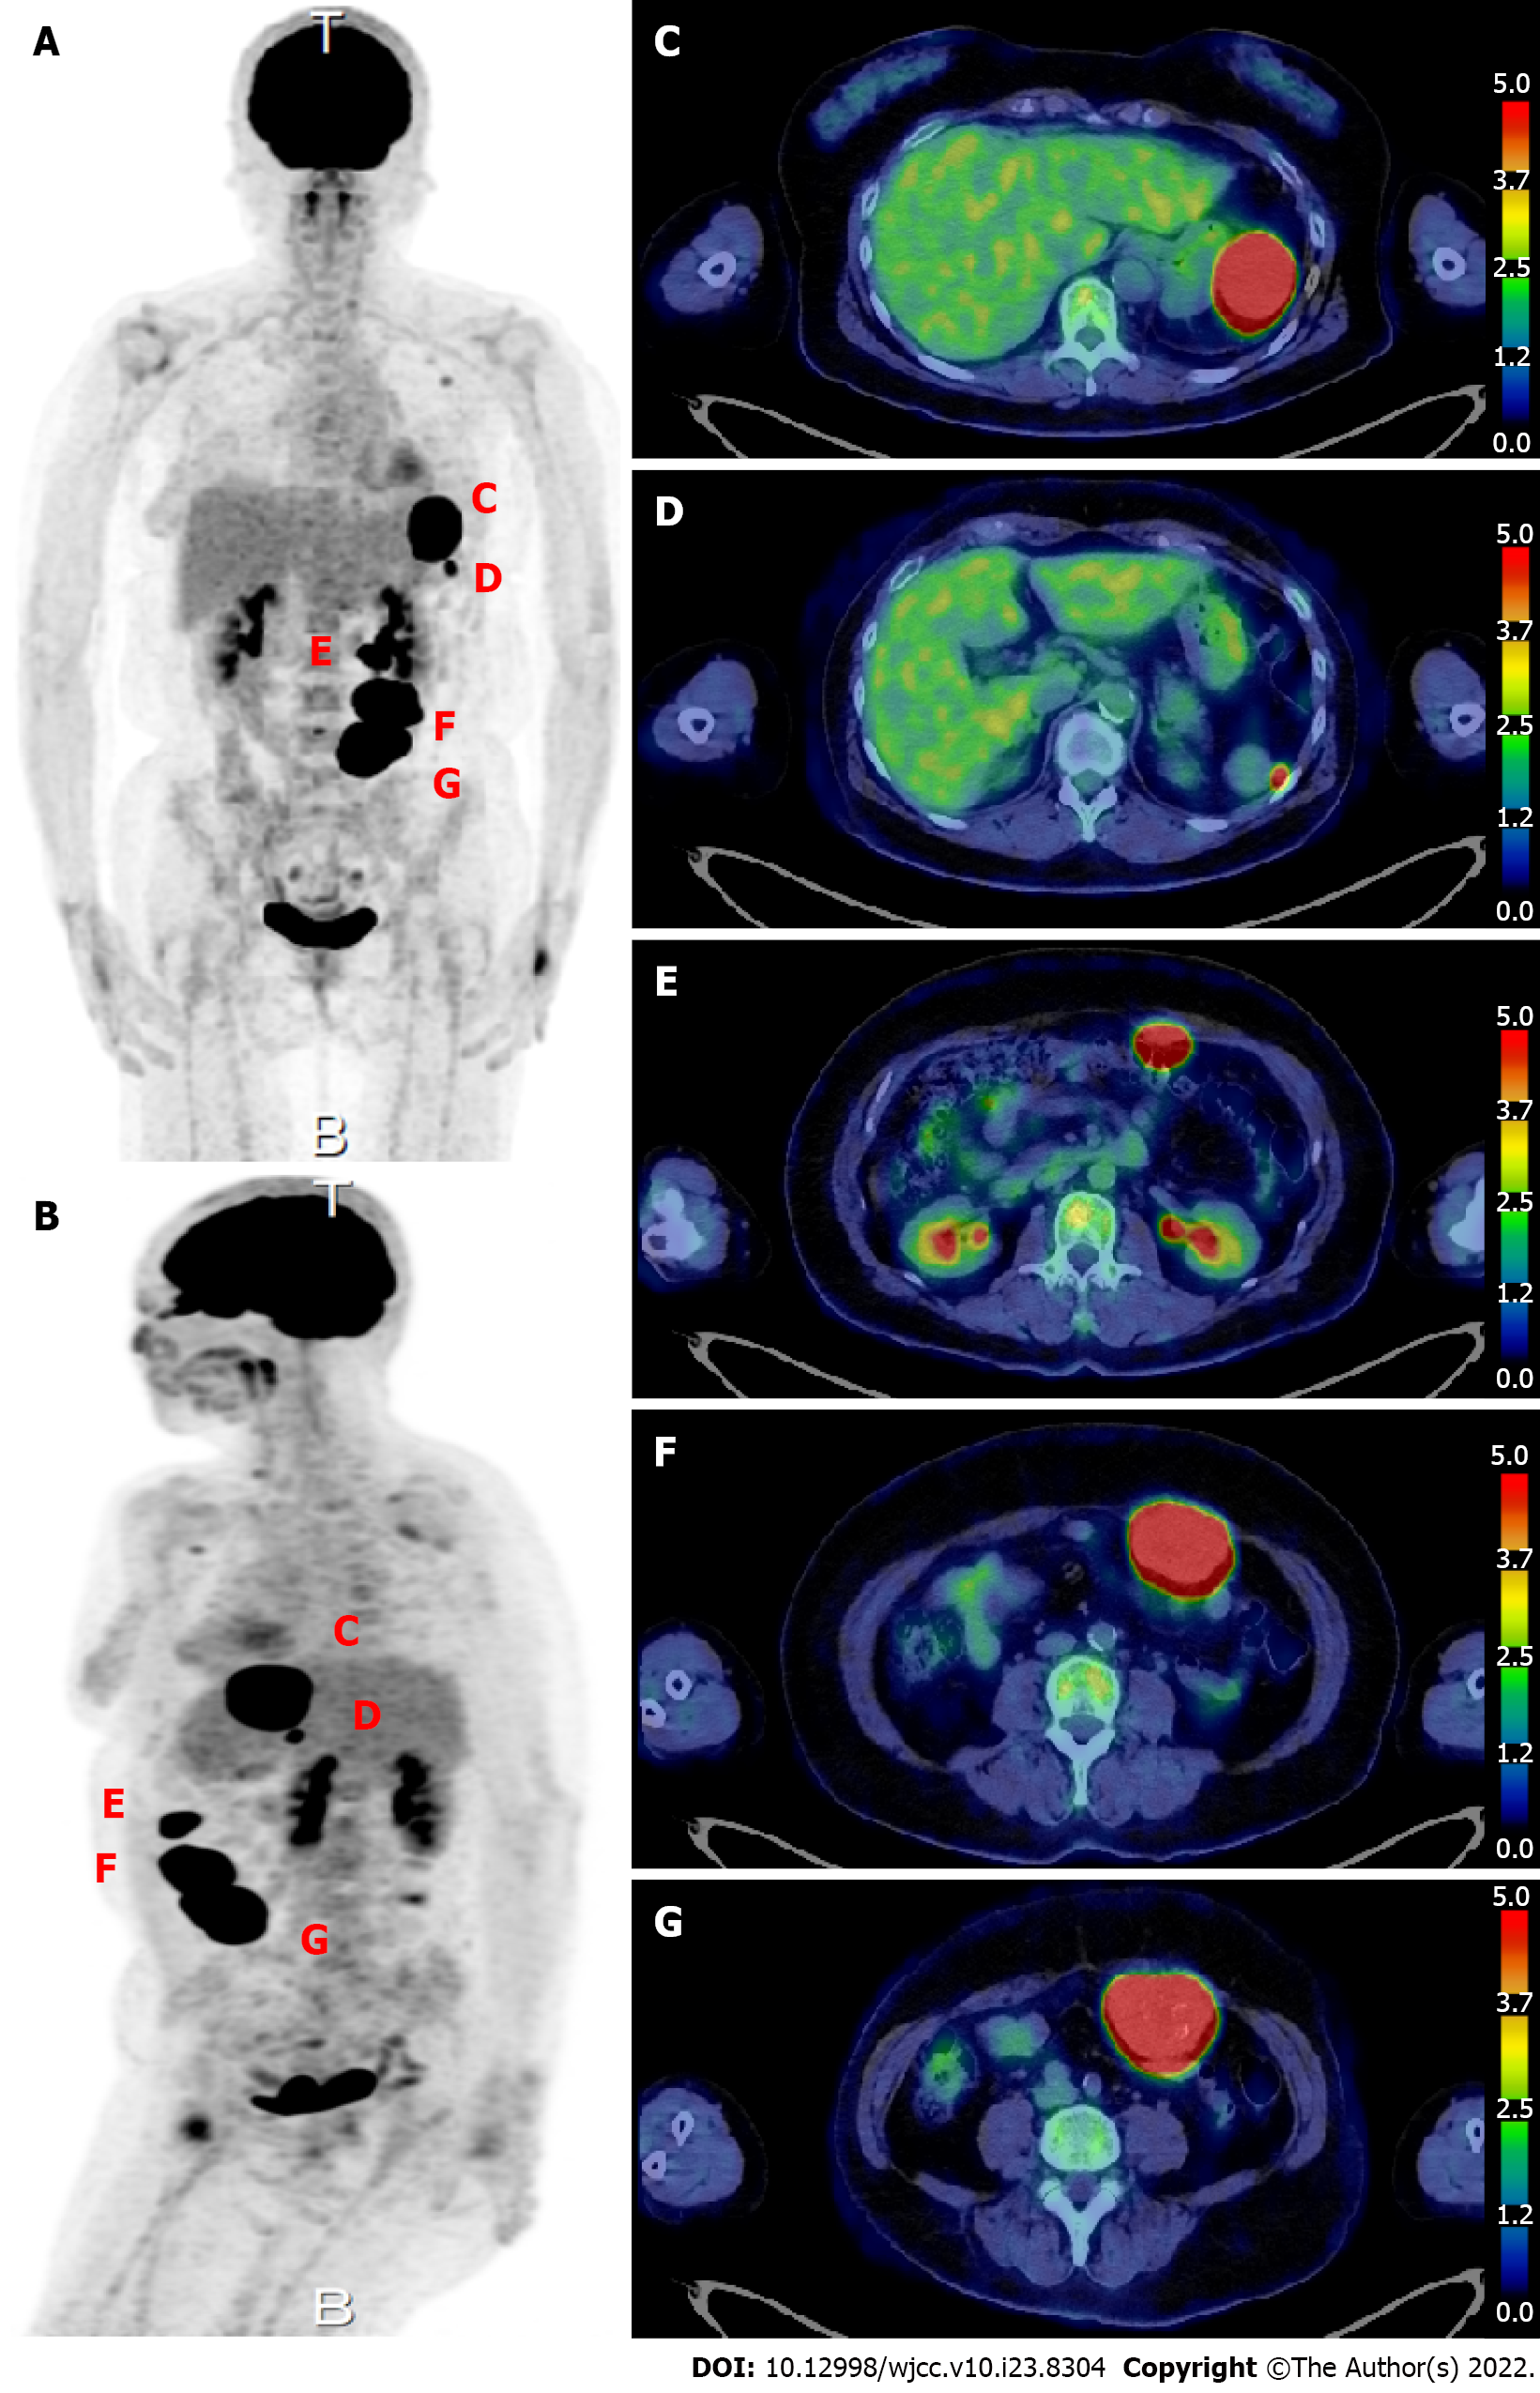
Figure 2 18F-fluorodeoxyglucose positron emission tomography.
A and B: Scan image; C: A 50-mm mass with high fluorodeoxyglucose (FDG) uptake [maximum standardized uptake value (SUVmax) 34.19] is seen protruding toward the serosa at the greater curvature of the stomach. A 50-mm intraperitoneal mass compressing the stomach is observed at the site of the previous splenectomy; D: A nodule about 7 mm in size with high FDG uptake (SUVmax 11.29) is observed near the accessory spleen; E: The most cranial abdominal wall mass shows high FDG uptake (SUVmax: 37.71); F: The middle abdominal wall mass shows high FDG uptake (SUVmax: 37.71); G: The most caudal abdominal wall mass shows high FDG uptake (SUVmax: 37.71).
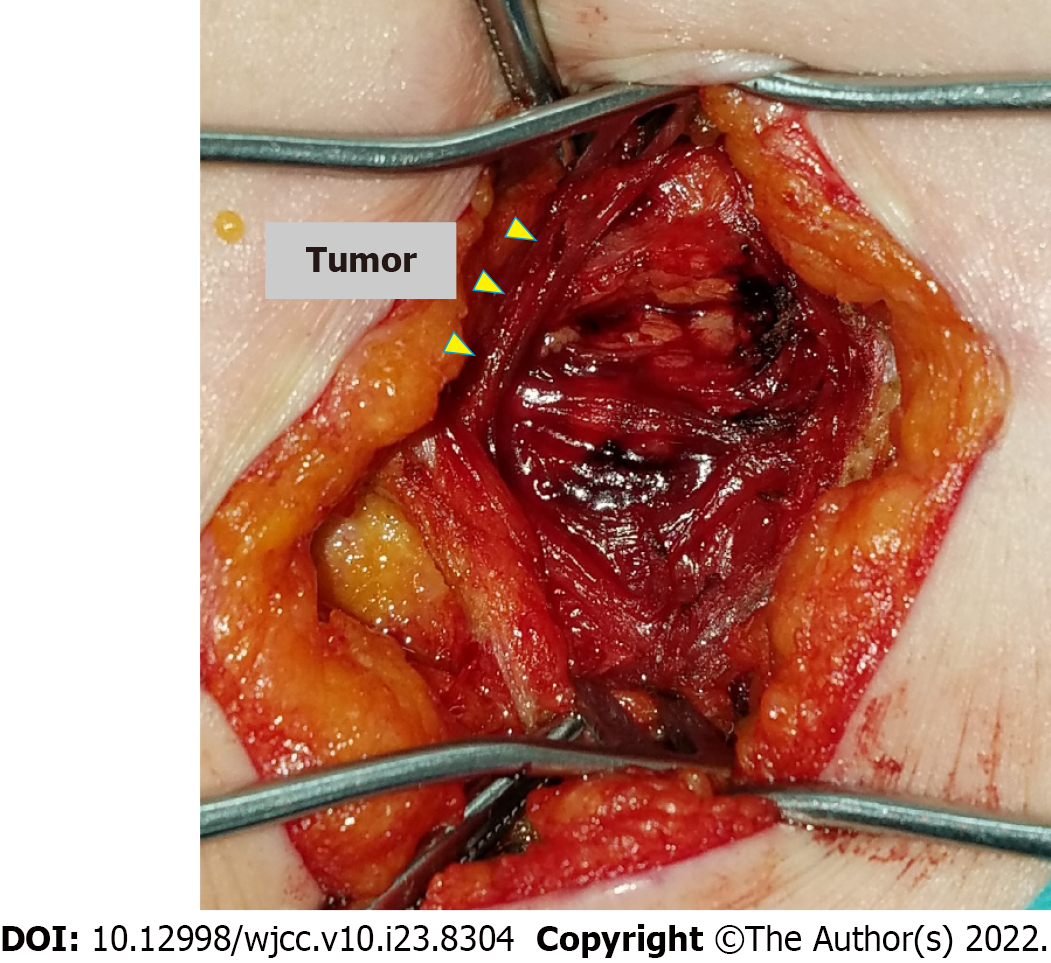
Figure 3 An intraoperative photograph shows an incision of approximately 5 cm made at the scar from the previous pararectal incision.
Dissection of the tissue reveals a hard, elastic, whitish mass, from which two 2-cm portions are excised.
Figure 4 Histopathological findings of the surgical specimens.
A and B: Histopathological findings show a well-demarcated nodule of needle-like crystals surrounded by a fibrous capsule, with histiocytes and multinucleated giant cells (hematoxylin and eosin stain; A: × 200; B: × 400); C: Histiocytes are immunohistochemically positive for CD68 (× 200).
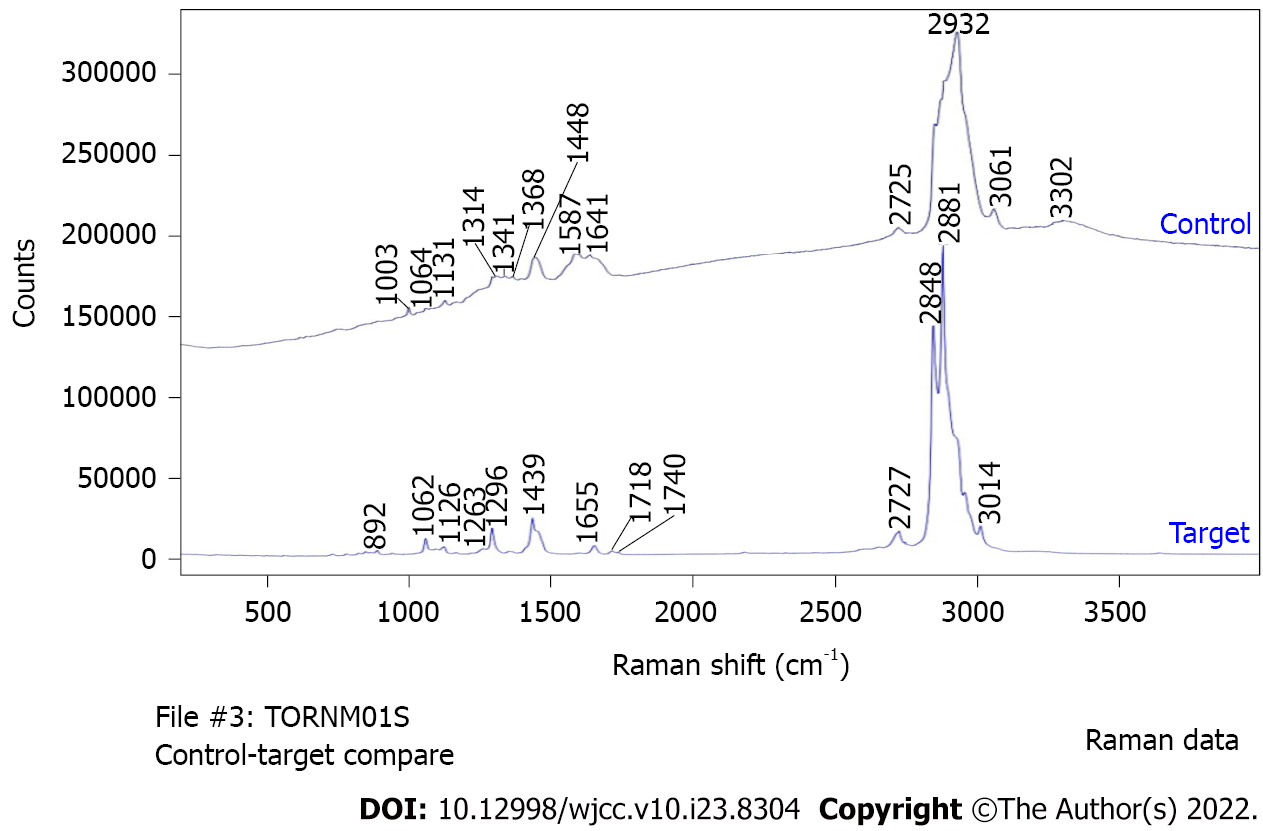
Figure 5 Raman spectra of the target and control areas.
The following peaks are seen in the target area: 1000-1300 cm-1, P-O and P=O bonds of phosphate (partially overlapping with the alkyl group signal); 1400-12800 cm-1, C-H bonds of saturated hydrocarbon groups; 1600-13800 cm-1, C=C bonds of unsaturated hydrocarbons; 1700 cm-1, C=O bonds of esters.
- Citation: Ohkura Y, Uruga H, Shiiba M, Ito S, Shimoyama H, Ishihara M, Ueno M, Udagawa H. Phosphoglyceride crystal deposition disease requiring differential diagnosis from malignant tumors and confirmed by Raman spectroscopy: A case report. World J Clin Cases 2022; 10(23): 8304-8311
- URL: https://www.wjgnet.com/2307-8960/full/v10/i23/8304.htm
- DOI: https://dx.doi.org/10.12998/wjcc.v10.i23.8304


