Copyright
©The Author(s) 2022.
World J Clin Cases. Jul 26, 2022; 10(21): 7523-7530
Published online Jul 26, 2022. doi: 10.12998/wjcc.v10.i21.7523
Published online Jul 26, 2022. doi: 10.12998/wjcc.v10.i21.7523
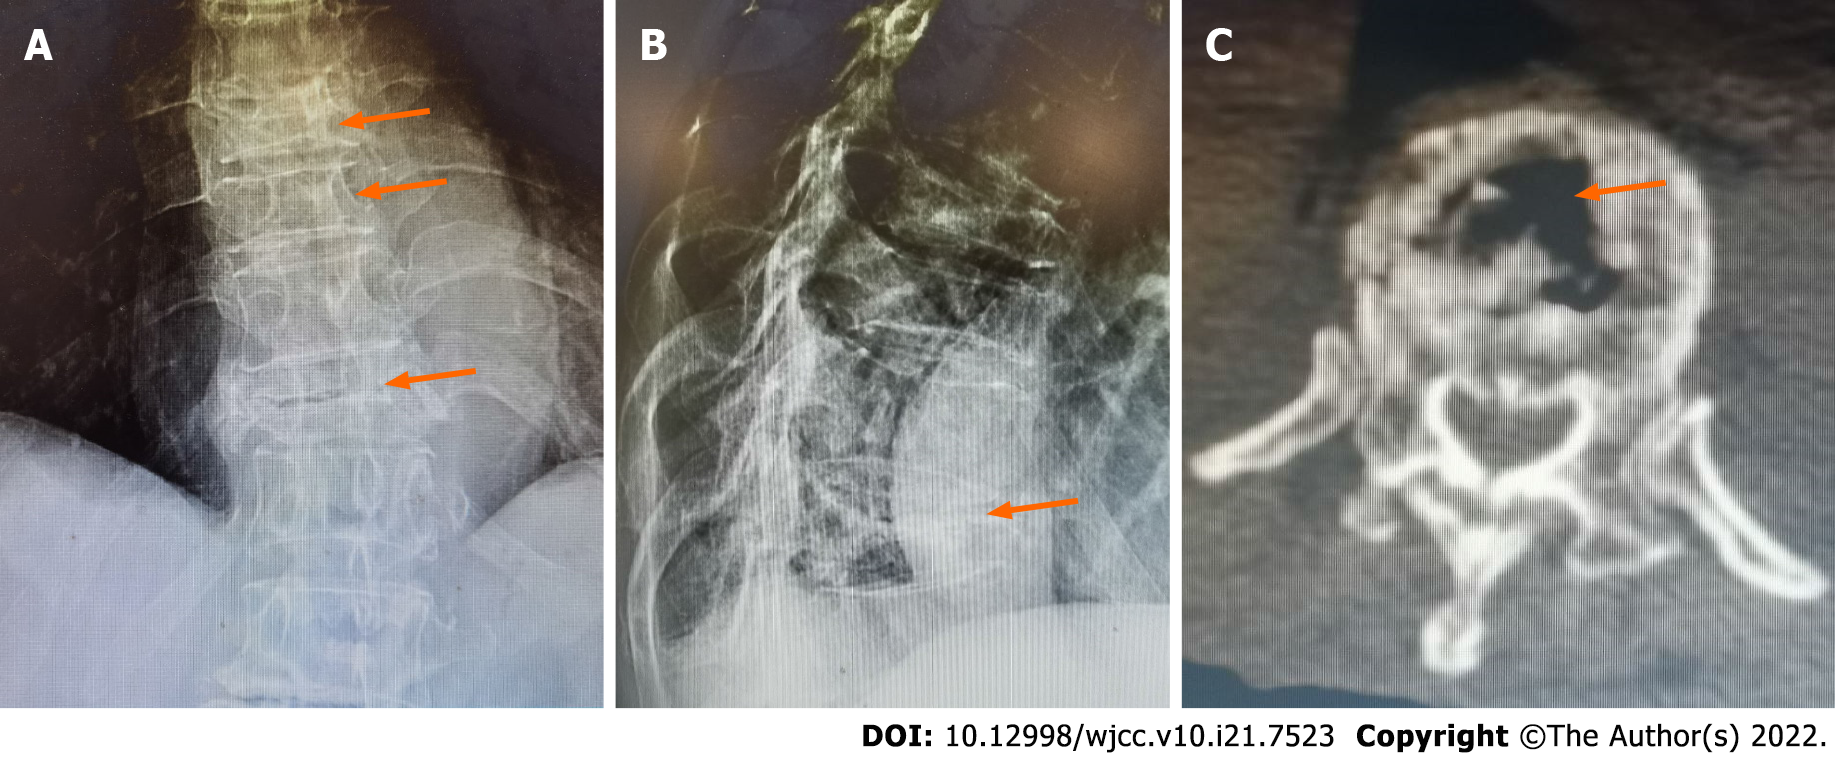
Figure 1 Preoperative X-ray and computed tomography images of the patient.
A: Anterior-posterior film showing the flattened shapes of the T8, T9, and T11 vertebrae (arrows). B: Lateral film showing the vertebral compression rate as being above 90% in T11 (arrow). C: Computed tomography scan revealing the vacuum cleft sign on a horizontal section of the vertebra (arrow).
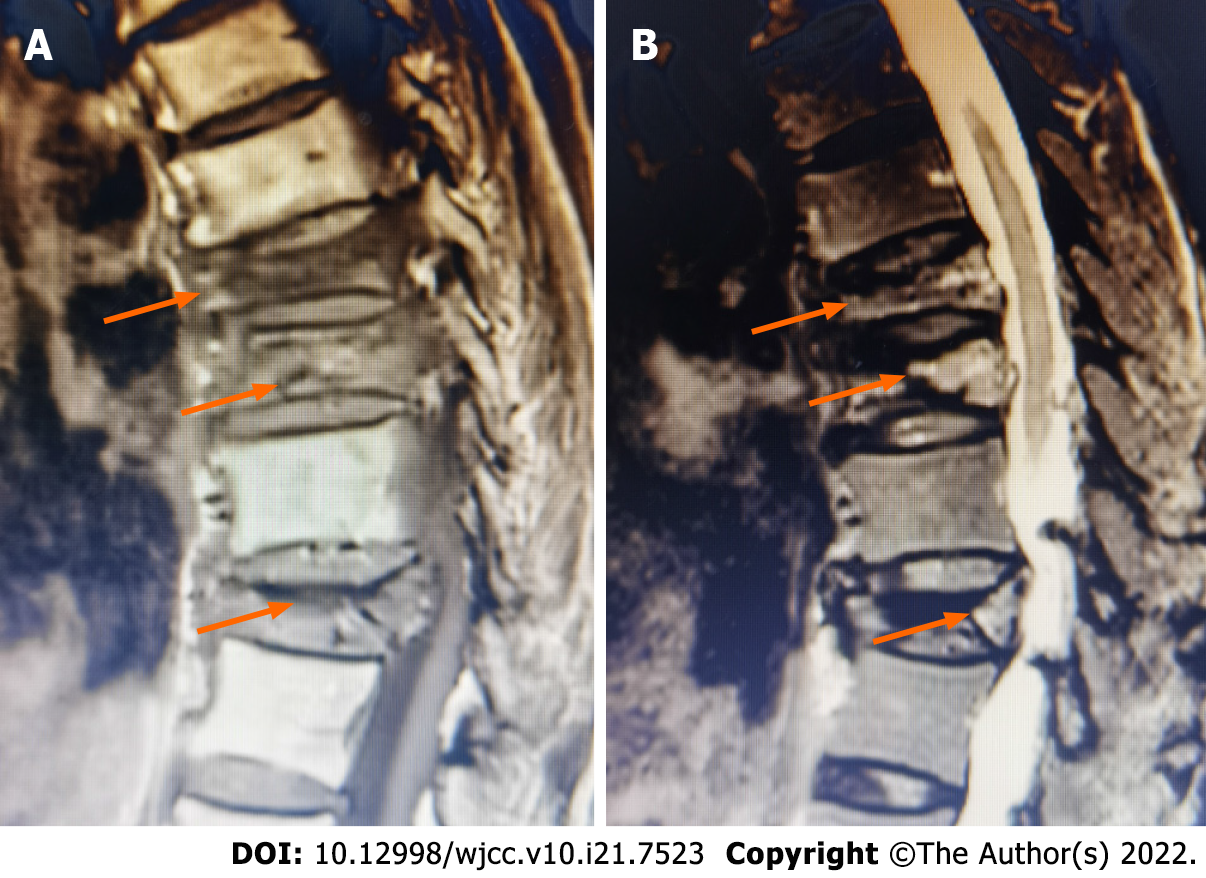
Figure 2 Preoperative magnetic resonance imaging of the patient.
A: Sagittal T1-weighted magnetic resonance image revealing bone marrow replacement by asymmetrical hypointensity (arrows). B: Sagittal T2-weighted MR images showing mixed signal intensities within the vertebral body and a linear area of hyperintensity surrounded by hypointensities (double-line sign) (arrows).
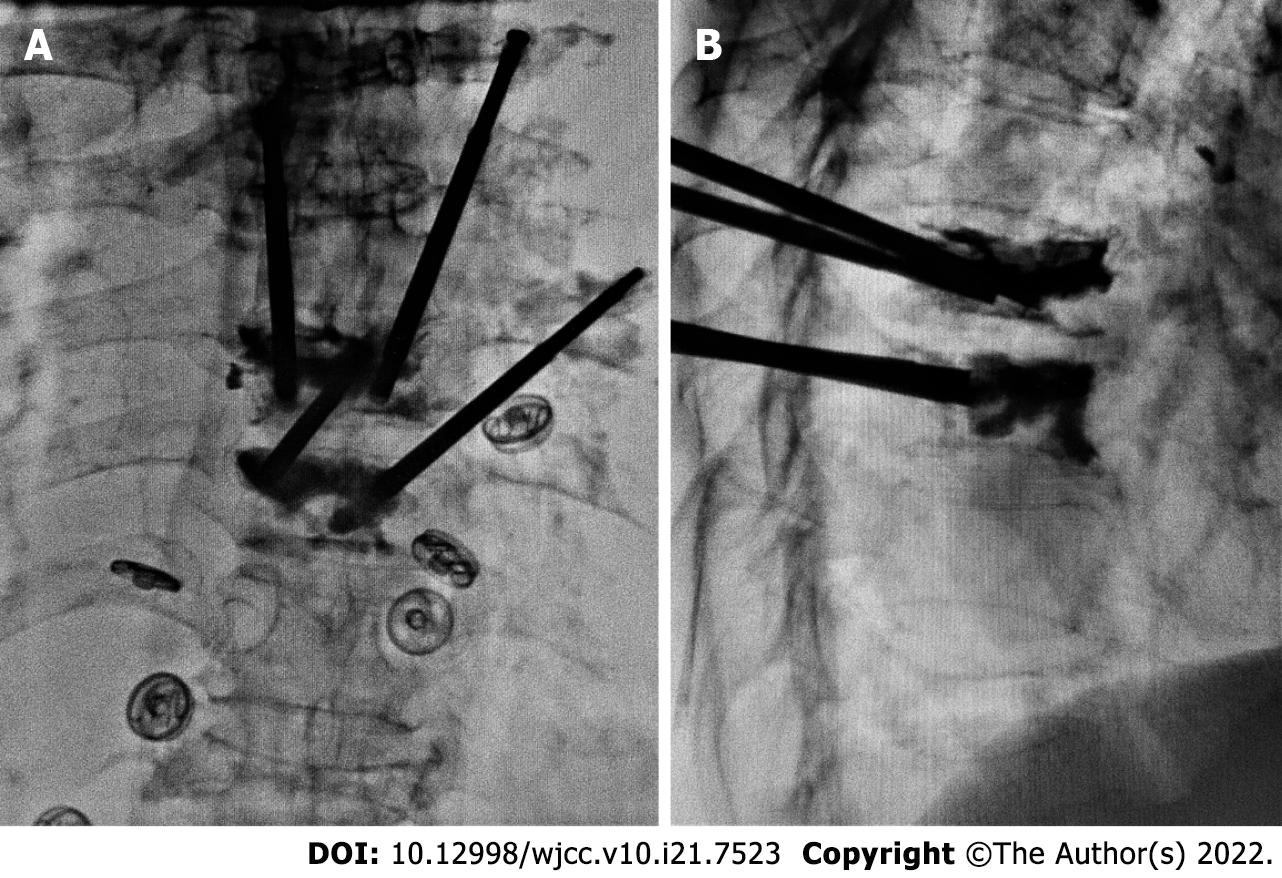
Figure 3 Intraoperative fluoroscopy of cement injection during percutaneous kyphoplasty.
A: Anterior-posterior film showing both vertebrae receiving bone cement injections through bilateral channels. B: Lateral film showing good dispersion of the bone cement in the vertebrae.
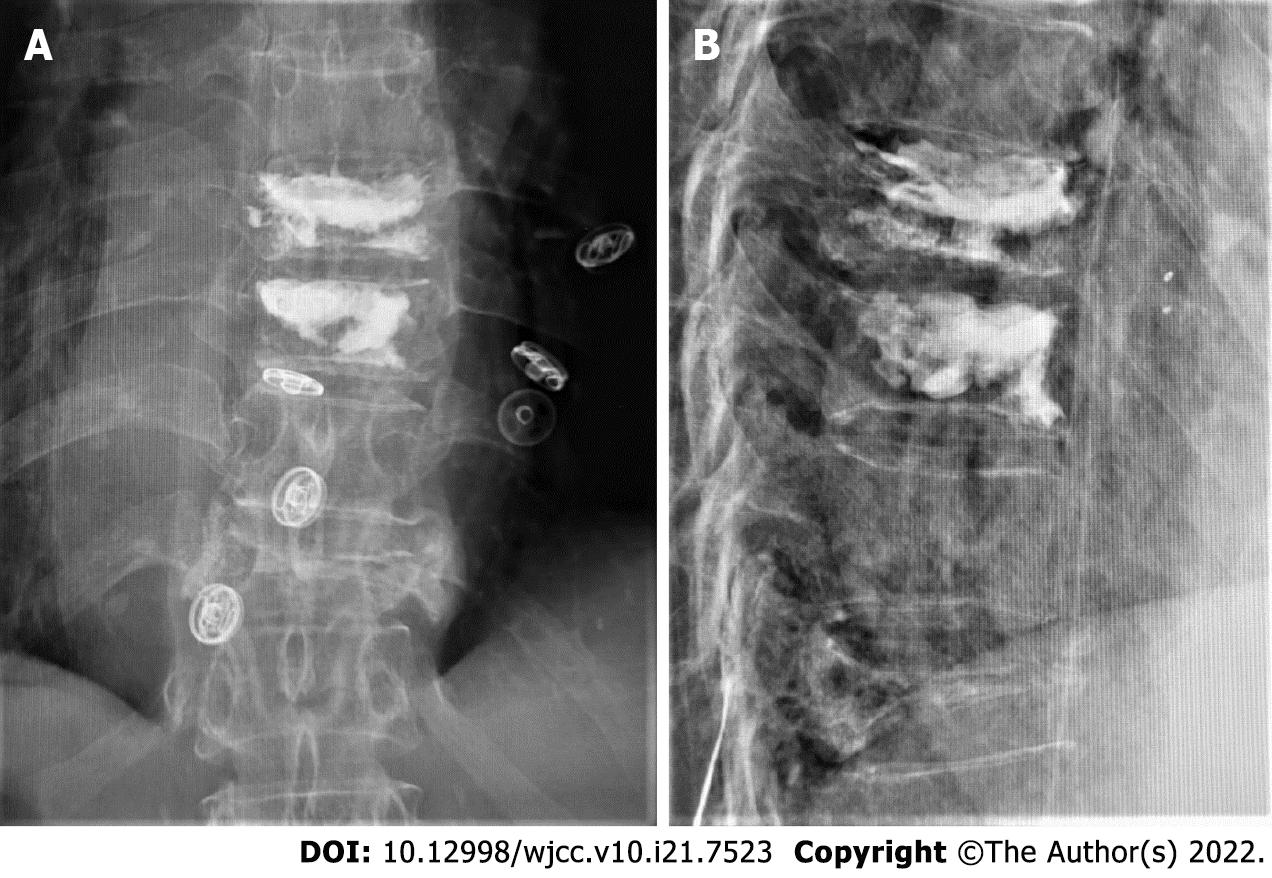
Figure 4 Postoperative radiograph of the patient.
A: Anterior-posterior film. B: Lateral film. The X-ray images show good distribution of the bone cement without marked leakage in the canalis spinalis.
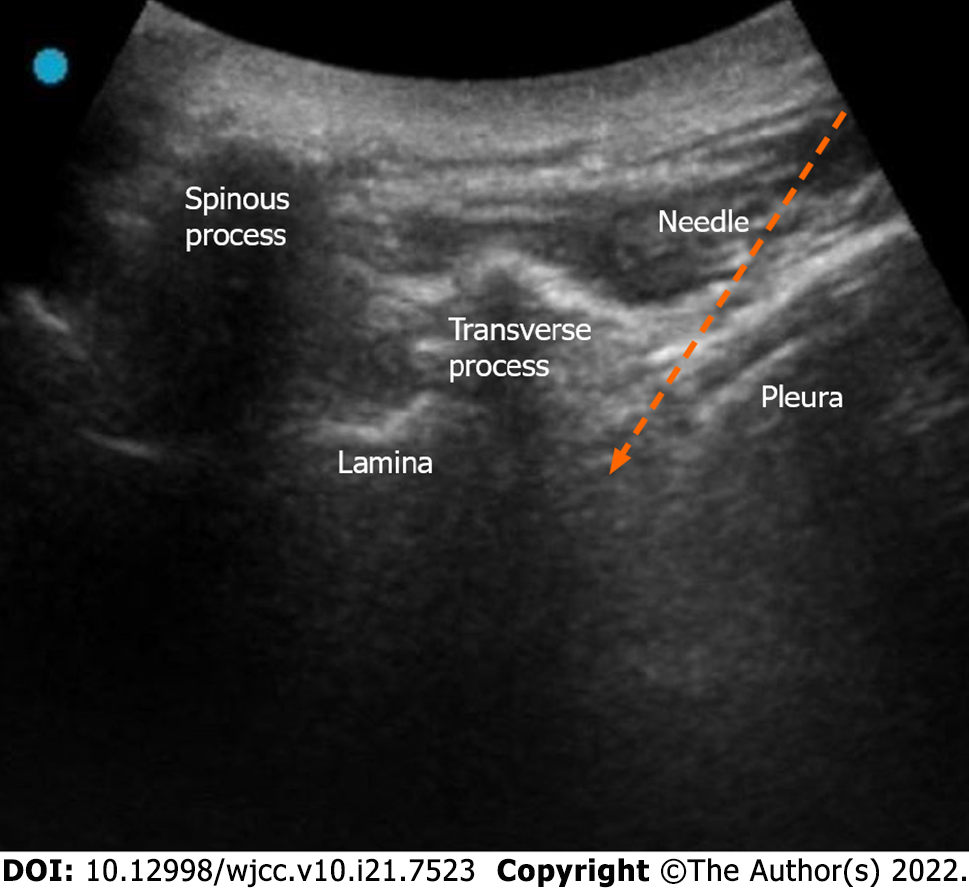
Figure 5 Ultrasound image of the selective nerve block.
Low-frequency probe short axis image showing the structure of spinous process, lamina, transverse process, and pleura from medial to lateral. The gap between the pleura and the lateral deep surface of the transverse process was the target region of the puncture (arrow).
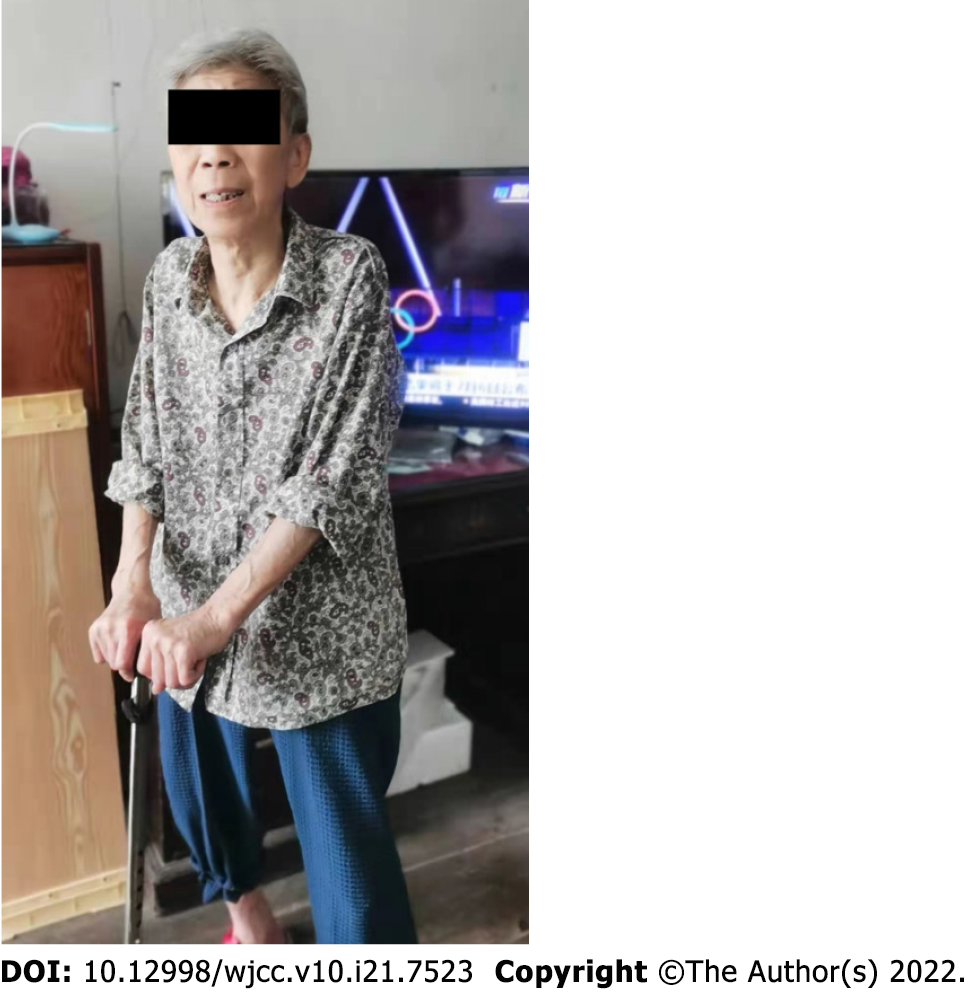
Figure 6 Functional status of the patient at 3-month follow-up.
The Visual Analog Scale score decreased to 1 point and the Oswestry Disability Index score decreased to 40%.
- Citation: Zhang X, Li ZX, Yin LJ, Chen H. Selective nerve block for the treatment of neuralgia in Kummell’s disease: A case report. World J Clin Cases 2022; 10(21): 7523-7530
- URL: https://www.wjgnet.com/2307-8960/full/v10/i21/7523.htm
- DOI: https://dx.doi.org/10.12998/wjcc.v10.i21.7523


