Copyright
©The Author(s) 2022.
World J Clin Cases. Jul 26, 2022; 10(21): 7467-7473
Published online Jul 26, 2022. doi: 10.12998/wjcc.v10.i21.7467
Published online Jul 26, 2022. doi: 10.12998/wjcc.v10.i21.7467
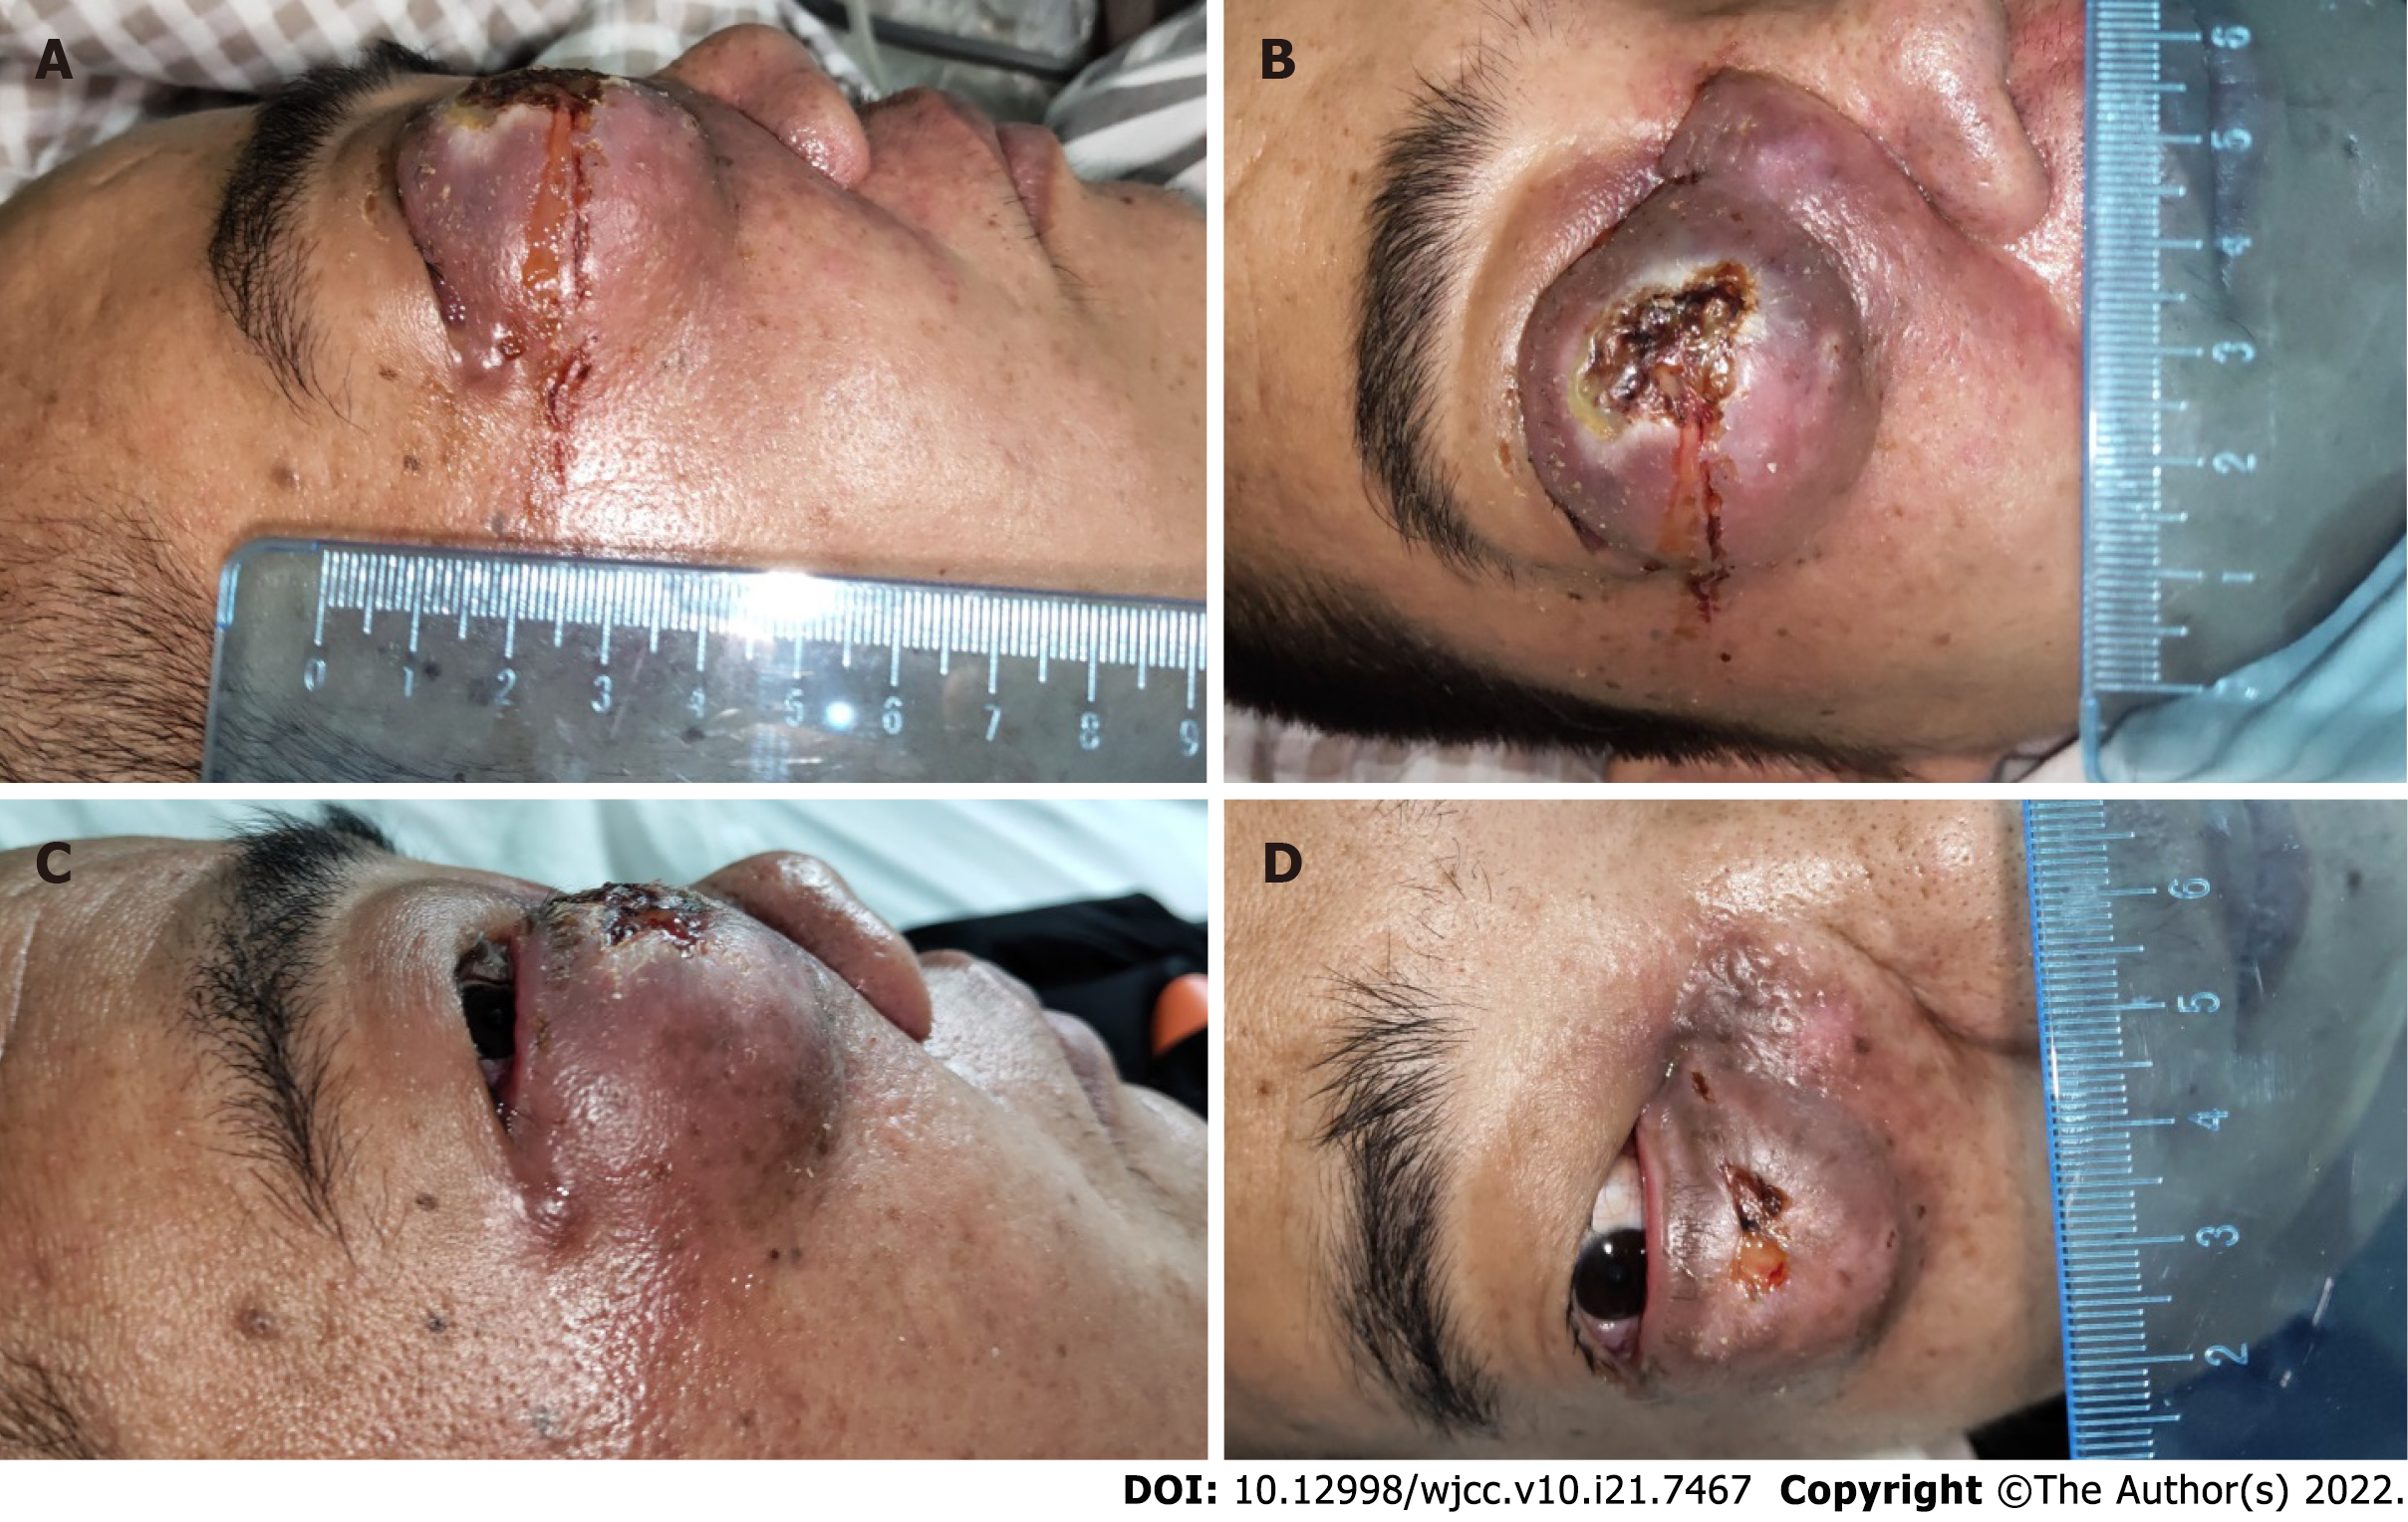
Figure 1 Comparison of tumor manifestations before and after interventional therapy.
A and B: Before interventional therapy; C and D: 2 wk after interventional therapy.
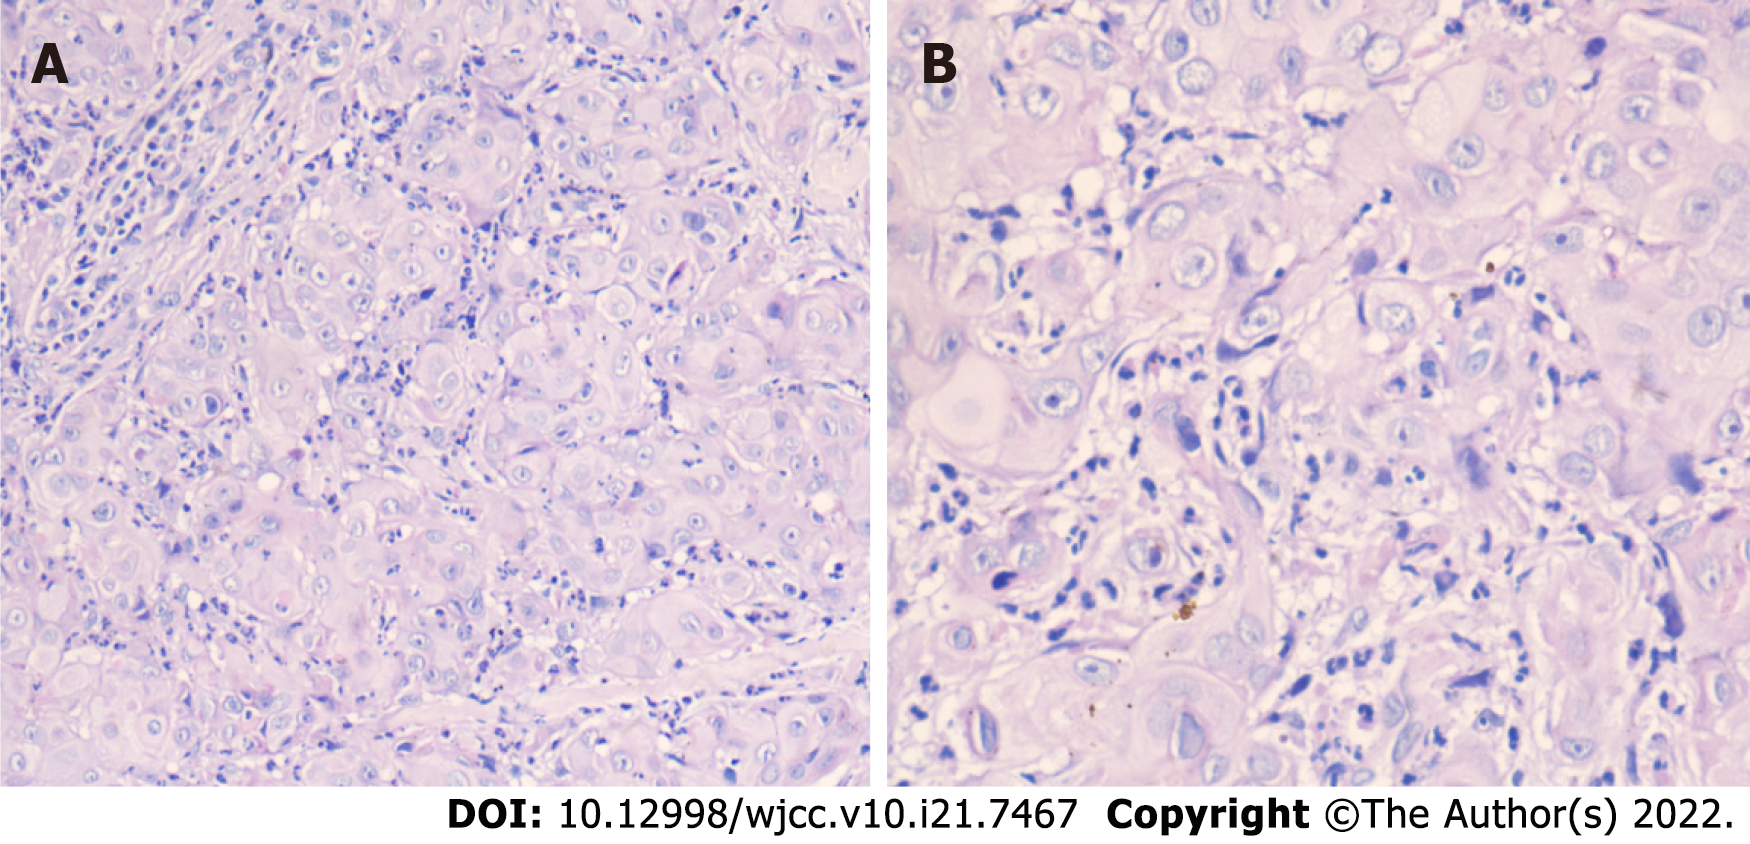
Figure 2 Hematoxylin-eosin staining of primary lacrimal sac carcinoma.
A: 200 ×; B: 400 ×.
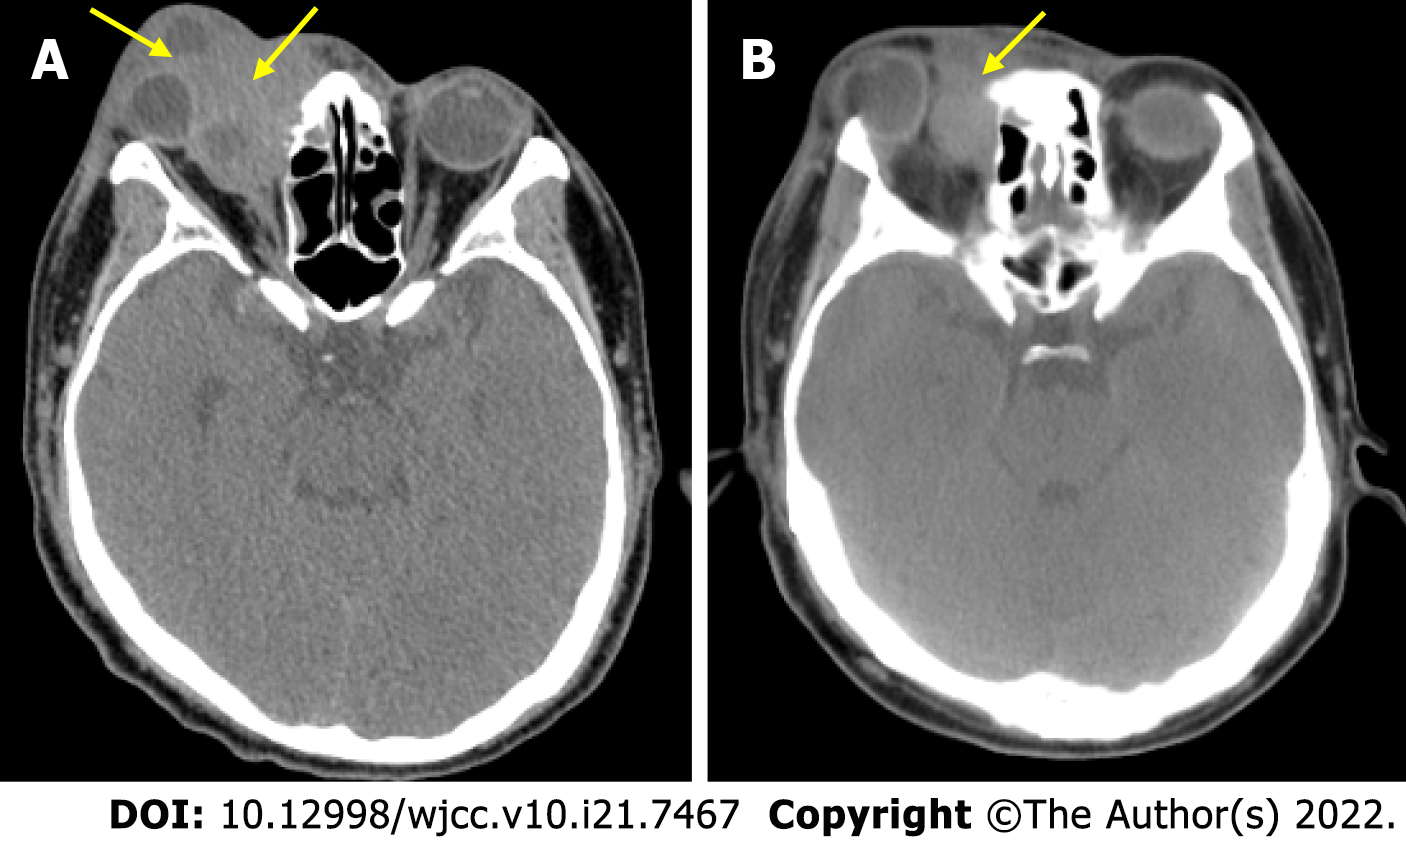
Figure 3 Comparison of computed tomography images before and after interventional therapy.
A: Before interventional therapy; B: 6 wk after interventional therapy. Yellow arrow: Tumor site.
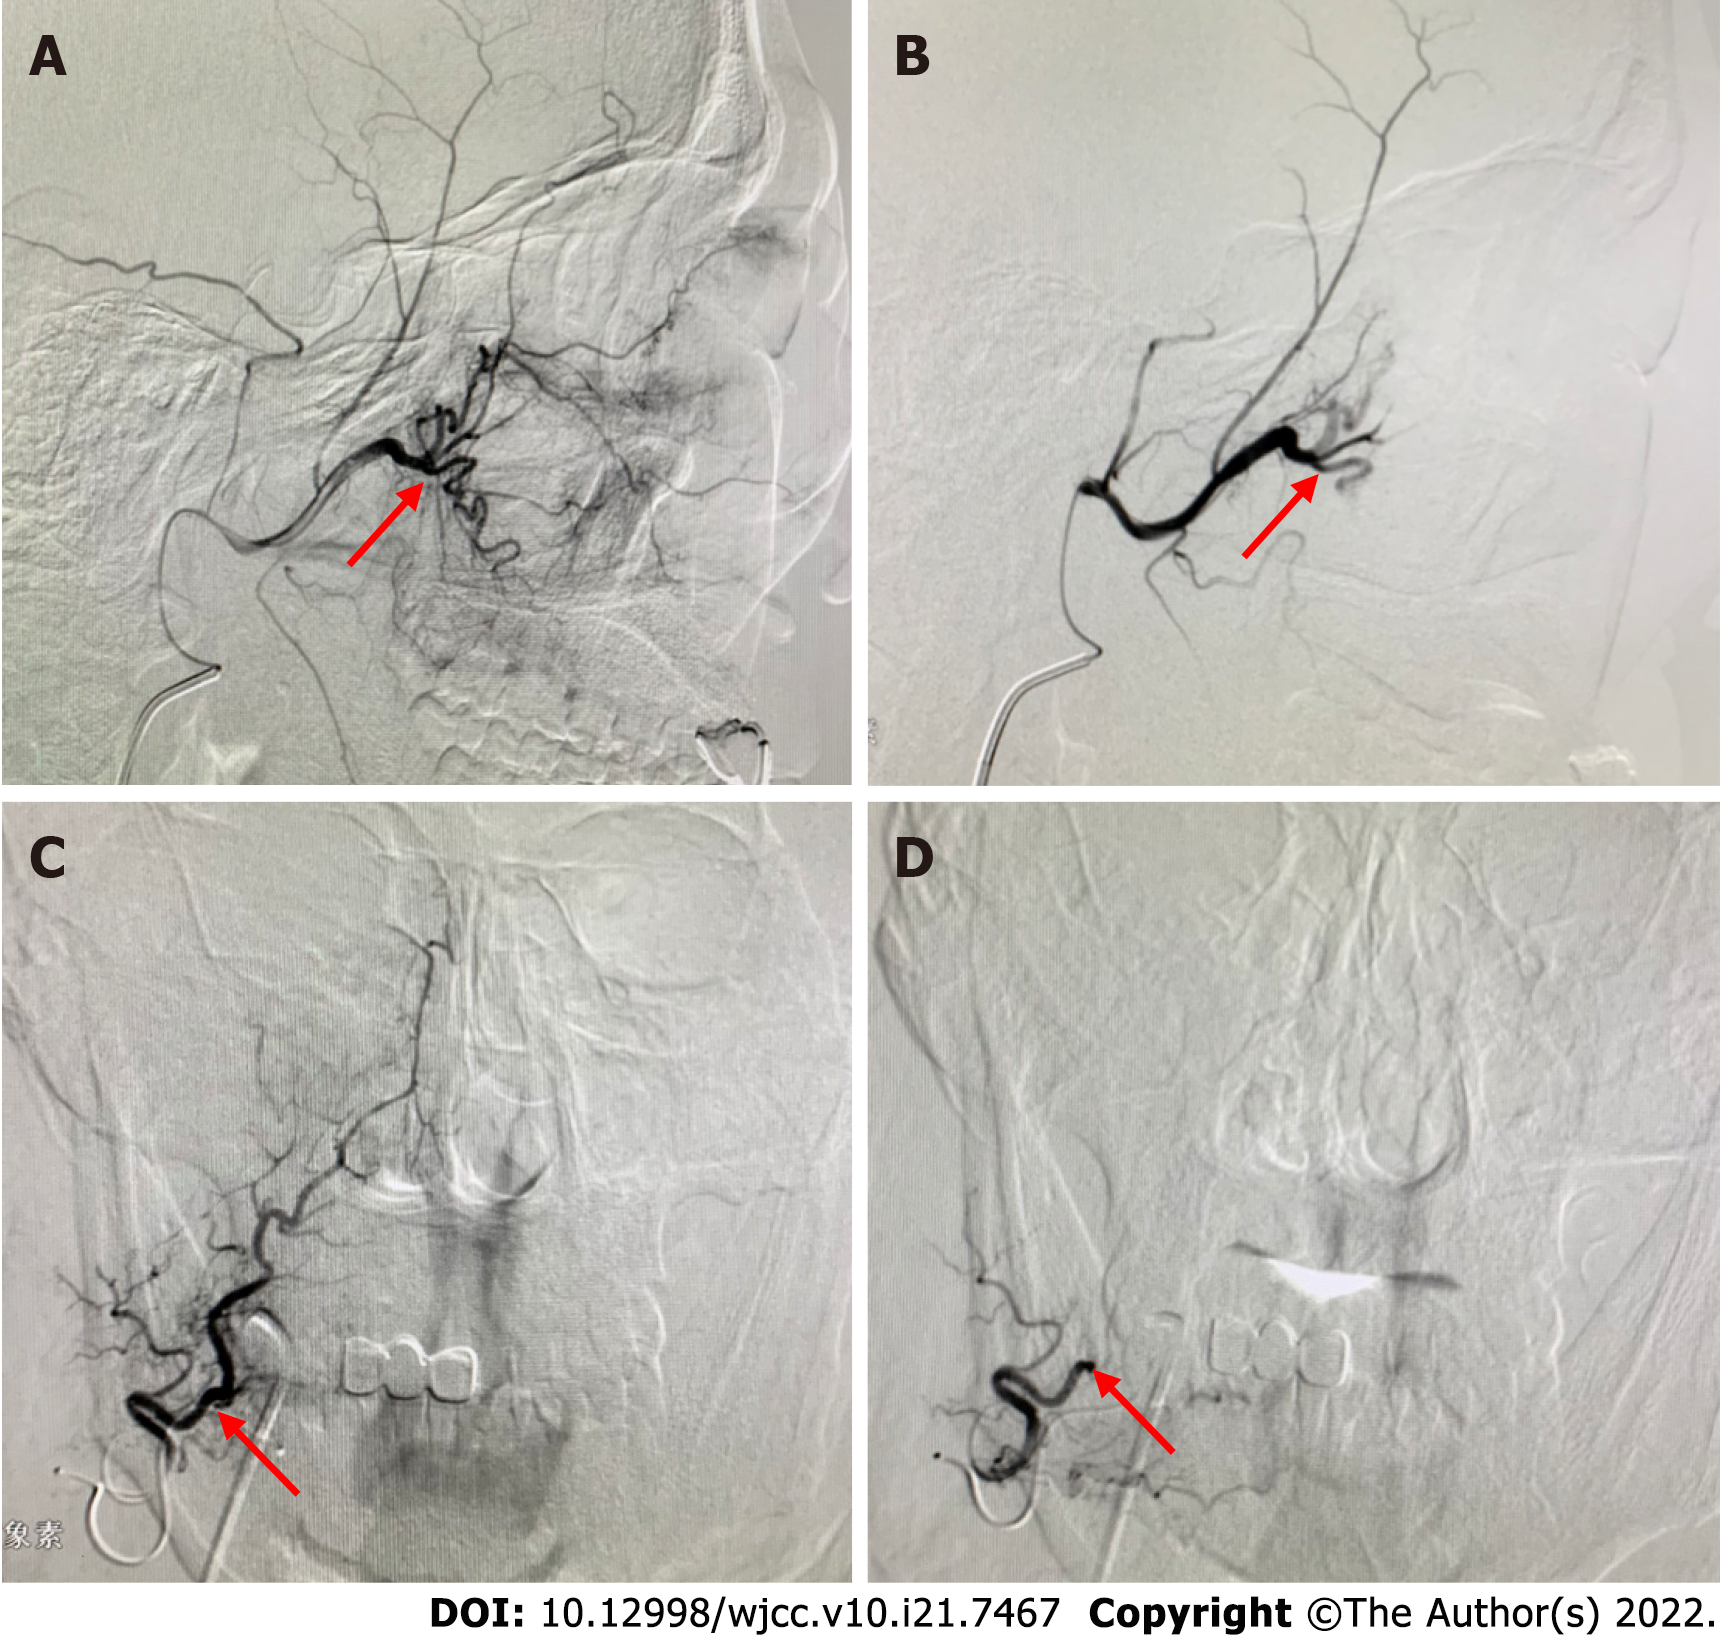
Figure 4 Images of primary lacrimal sac carcinoma before and after transcatheter arterial infusion chemotherapy and microsphere embolization.
A: Before embolization of the maxillary artery branch supplying the tumor; B: The blood supply from the maxillary artery branch disappeared after maxillary artery embolization; C: Before embolization of the facial artery branch supplying the tumor; D: The blood supply from the facial artery branch disappeared after facial artery embolization.
- Citation: Sun MH, Yi WD, Shen L, Zhou L, Lu JX. Transcatheter arterial infusion chemotherapy and embolization for primary lacrimal sac squamous cell carcinoma: A case report. World J Clin Cases 2022; 10(21): 7467-7473
- URL: https://www.wjgnet.com/2307-8960/full/v10/i21/7467.htm
- DOI: https://dx.doi.org/10.12998/wjcc.v10.i21.7467


