Copyright
©The Author(s) 2022.
World J Clin Cases. Jul 26, 2022; 10(21): 7438-7444
Published online Jul 26, 2022. doi: 10.12998/wjcc.v10.i21.7438
Published online Jul 26, 2022. doi: 10.12998/wjcc.v10.i21.7438
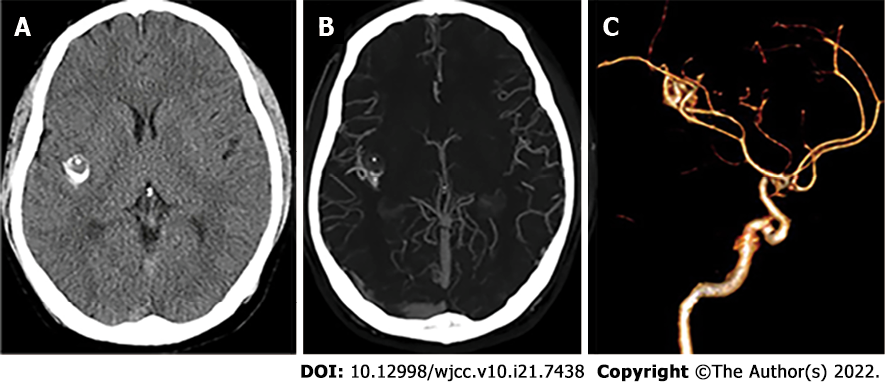
Figure 1 Computed tomographic angiography before the first operation.
A: A preoperative non-contrast enhanced axial computed tomographic (CT) shows an area of high density in the right Sylvian fissure, most likely a calcification (an 11 mm × 12 mm × 12 mm mass lesion); B: Contrast CT imaging shows an enhanced mass in the right deep Sylvian fissure region with edema and areas of calcification; C: Computed tomographic angiography did not show any tumor stain or dilatation of the middle cerebral artery.
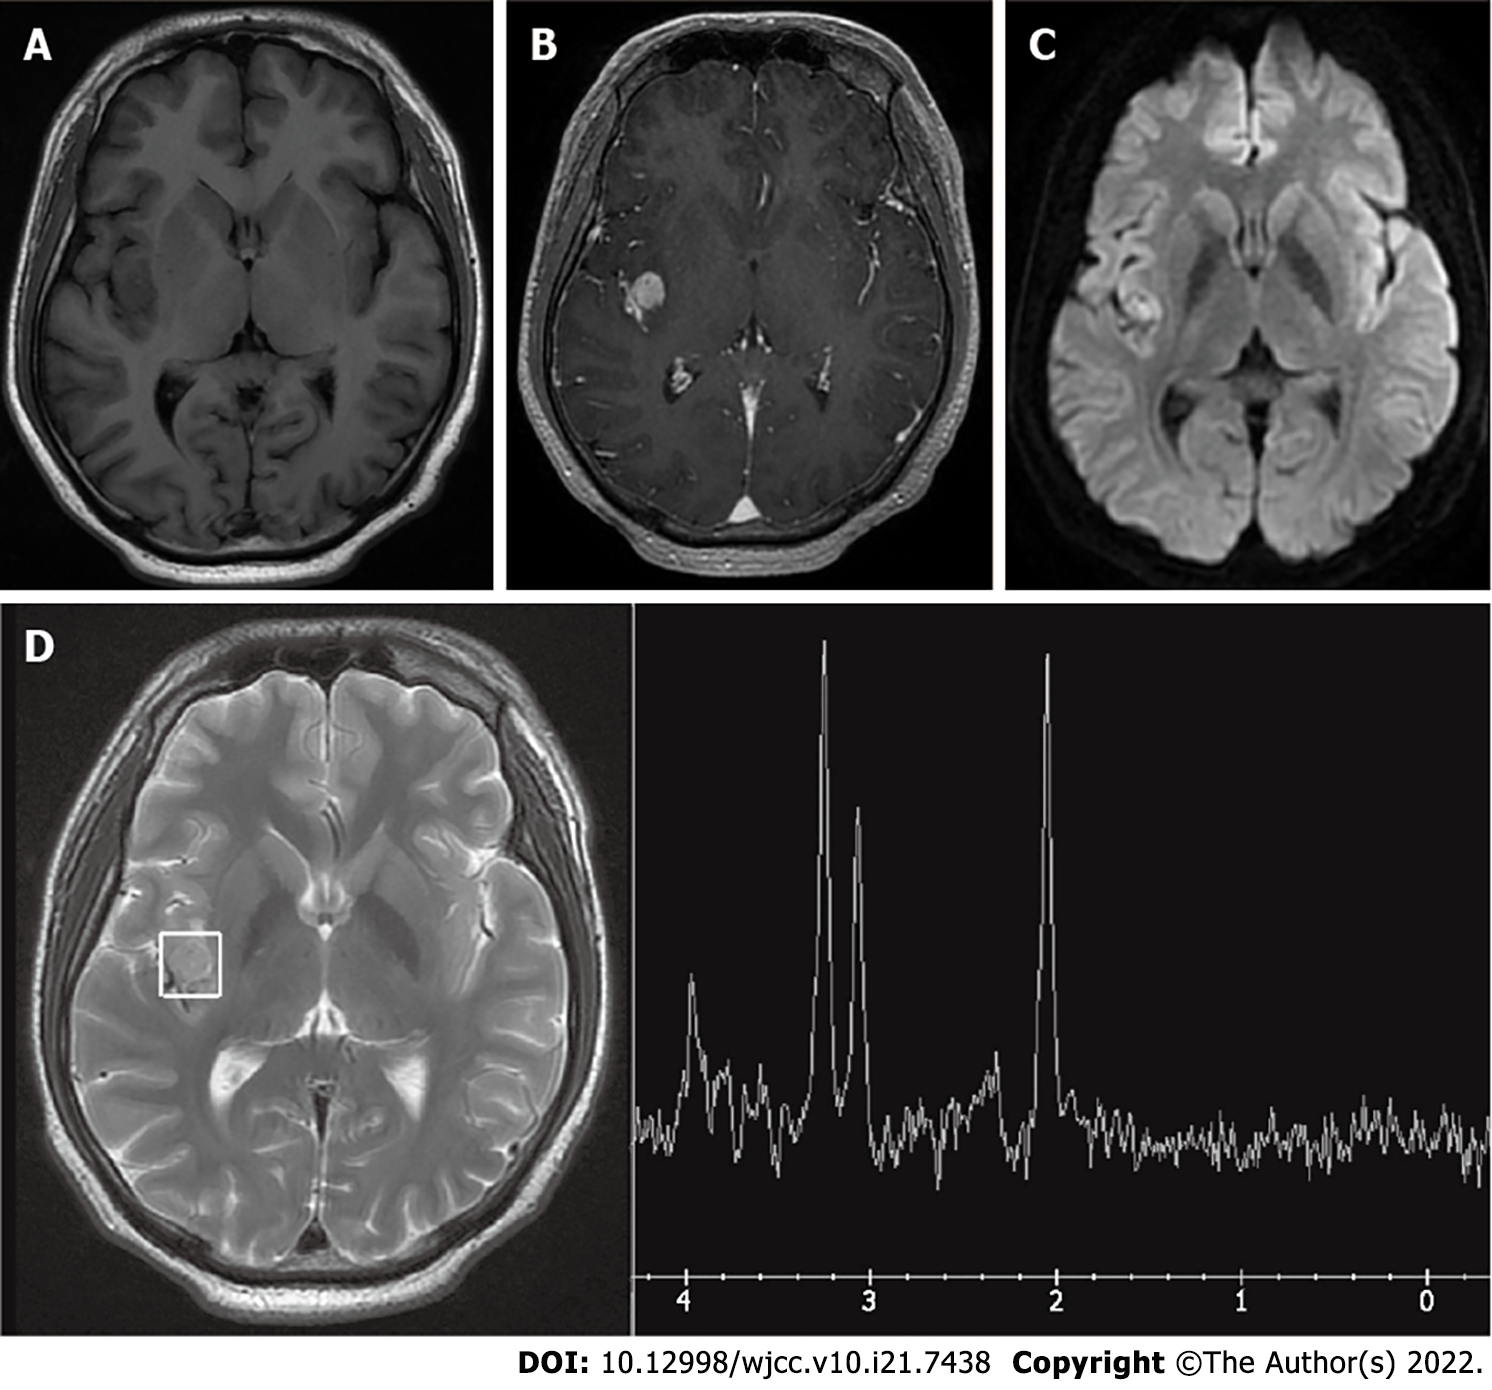
Figure 2 Magnetic resonance imaging and magnetic resonance spectroscopy before the first operation.
A and B: Axial T1-weighted magnetic resonance imaging scan demonstrating a hypointense right Sylvian fissure lesion, which was homogenously enhanced after contrast administration; C: Diffusion weighted imaging shows a hyperintense mass in the posterior part of the insular lobe; D: The magnetic resonance spectroscopy (MRS) N-acetyl aspartate (NAA) peak was slightly decreased.
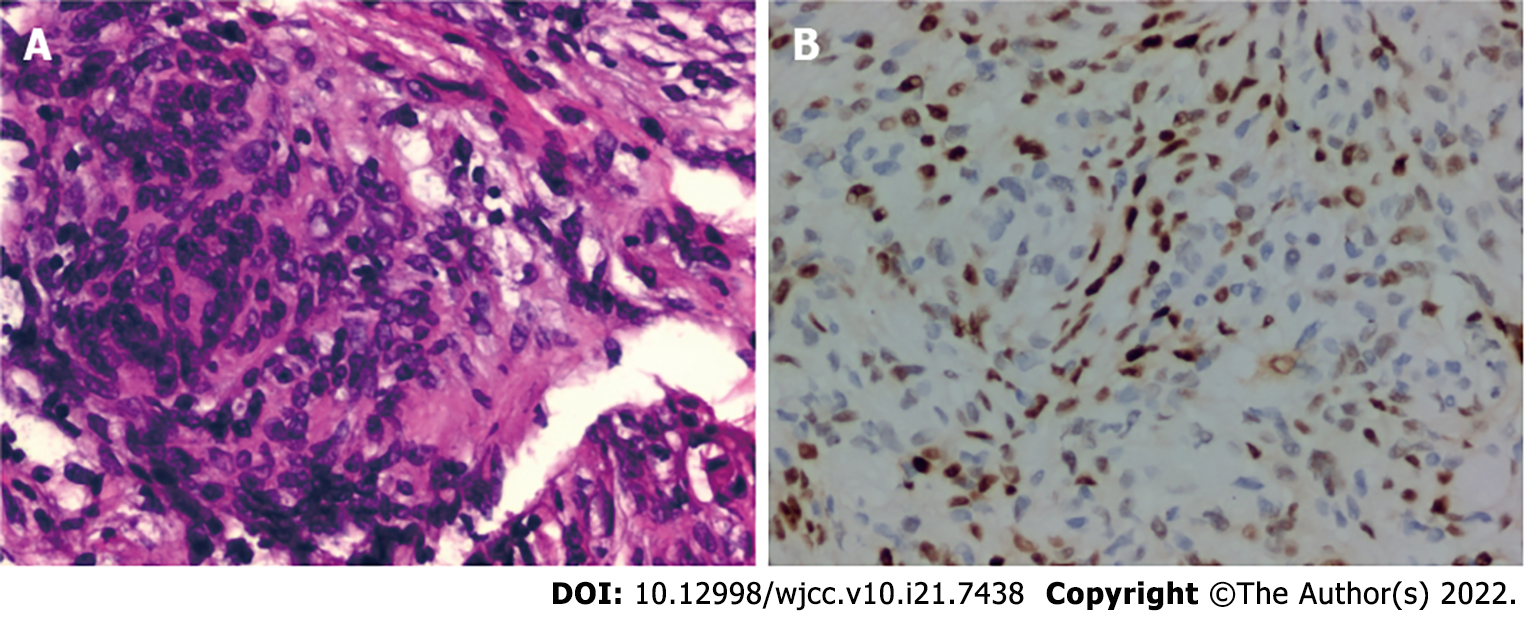
Figure 3 Postoperative histopathology.
A: Hematoxylin and eosin staining; original magnification, × 200: Microscopically, the tissue demonstrates spindle-shaped tumor cells and characteristic diffused arrangement in sheets with multiple gravel structures; B: Estimated proliferation index of 5% stained by Ki67 (Immunohistochemical staining, original magnification, × 200). Considering the H&E results, findings were consistent with meningioma.
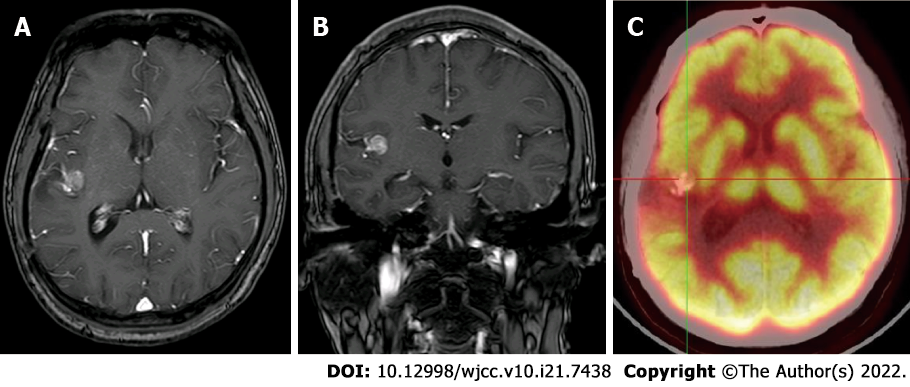
Figure 4 Positron emission tomography-computed tomographic.
A and B: After the first operation, contrast magnetic resonance imaging T2-weighted image shows a small and stable residual tumor in the right Sylvian fissure: Axial view (A), Coronal view (B); C: Positron emission tomography-computed tomographic shows the limited hypometabolism zone around the tumor and surgical exposure area.
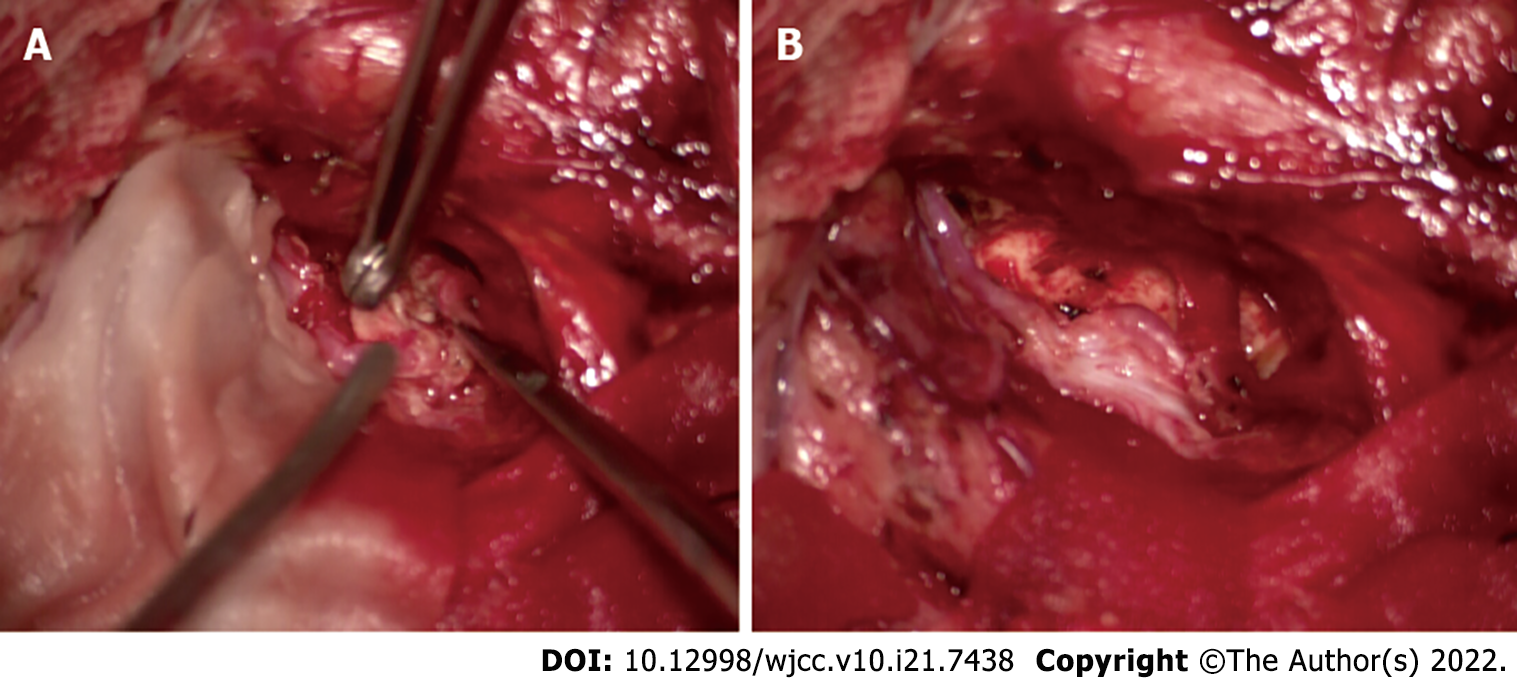
Figure 5 Intraoperative picture demonstrates complete removal of the tumor.
A: The exposed brain cortex shows shallow sulci, marked flattening, and thinning of gyri around the Sylvian fissure; B: After splitting the Sylvian fissure, the mass is exposed.
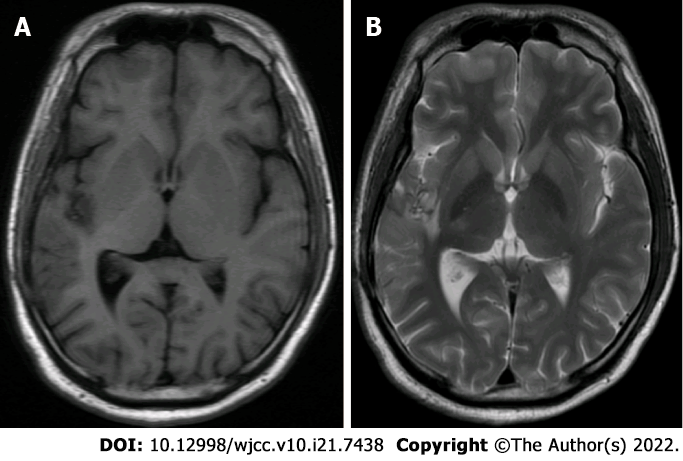
Figure 6 Magnetic resonance imaging images after one year of the second operation.
Magnetic resonance imaging (MRI) images show no mass in the right sylvian fissure: MRI-T1 weighted image, axial view (A), MRI-T2 weighted image, axial view (B).
- Citation: Wang A, Zhang X, Sun KK, Li C, Song ZM, Sun T, Wang F. Deep Sylvian fissure meningiomas: A case report. World J Clin Cases 2022; 10(21): 7438-7444
- URL: https://www.wjgnet.com/2307-8960/full/v10/i21/7438.htm
- DOI: https://dx.doi.org/10.12998/wjcc.v10.i21.7438


