Copyright
©The Author(s) 2022.
World J Clin Cases. Jul 26, 2022; 10(21): 7224-7241
Published online Jul 26, 2022. doi: 10.12998/wjcc.v10.i21.7224
Published online Jul 26, 2022. doi: 10.12998/wjcc.v10.i21.7224
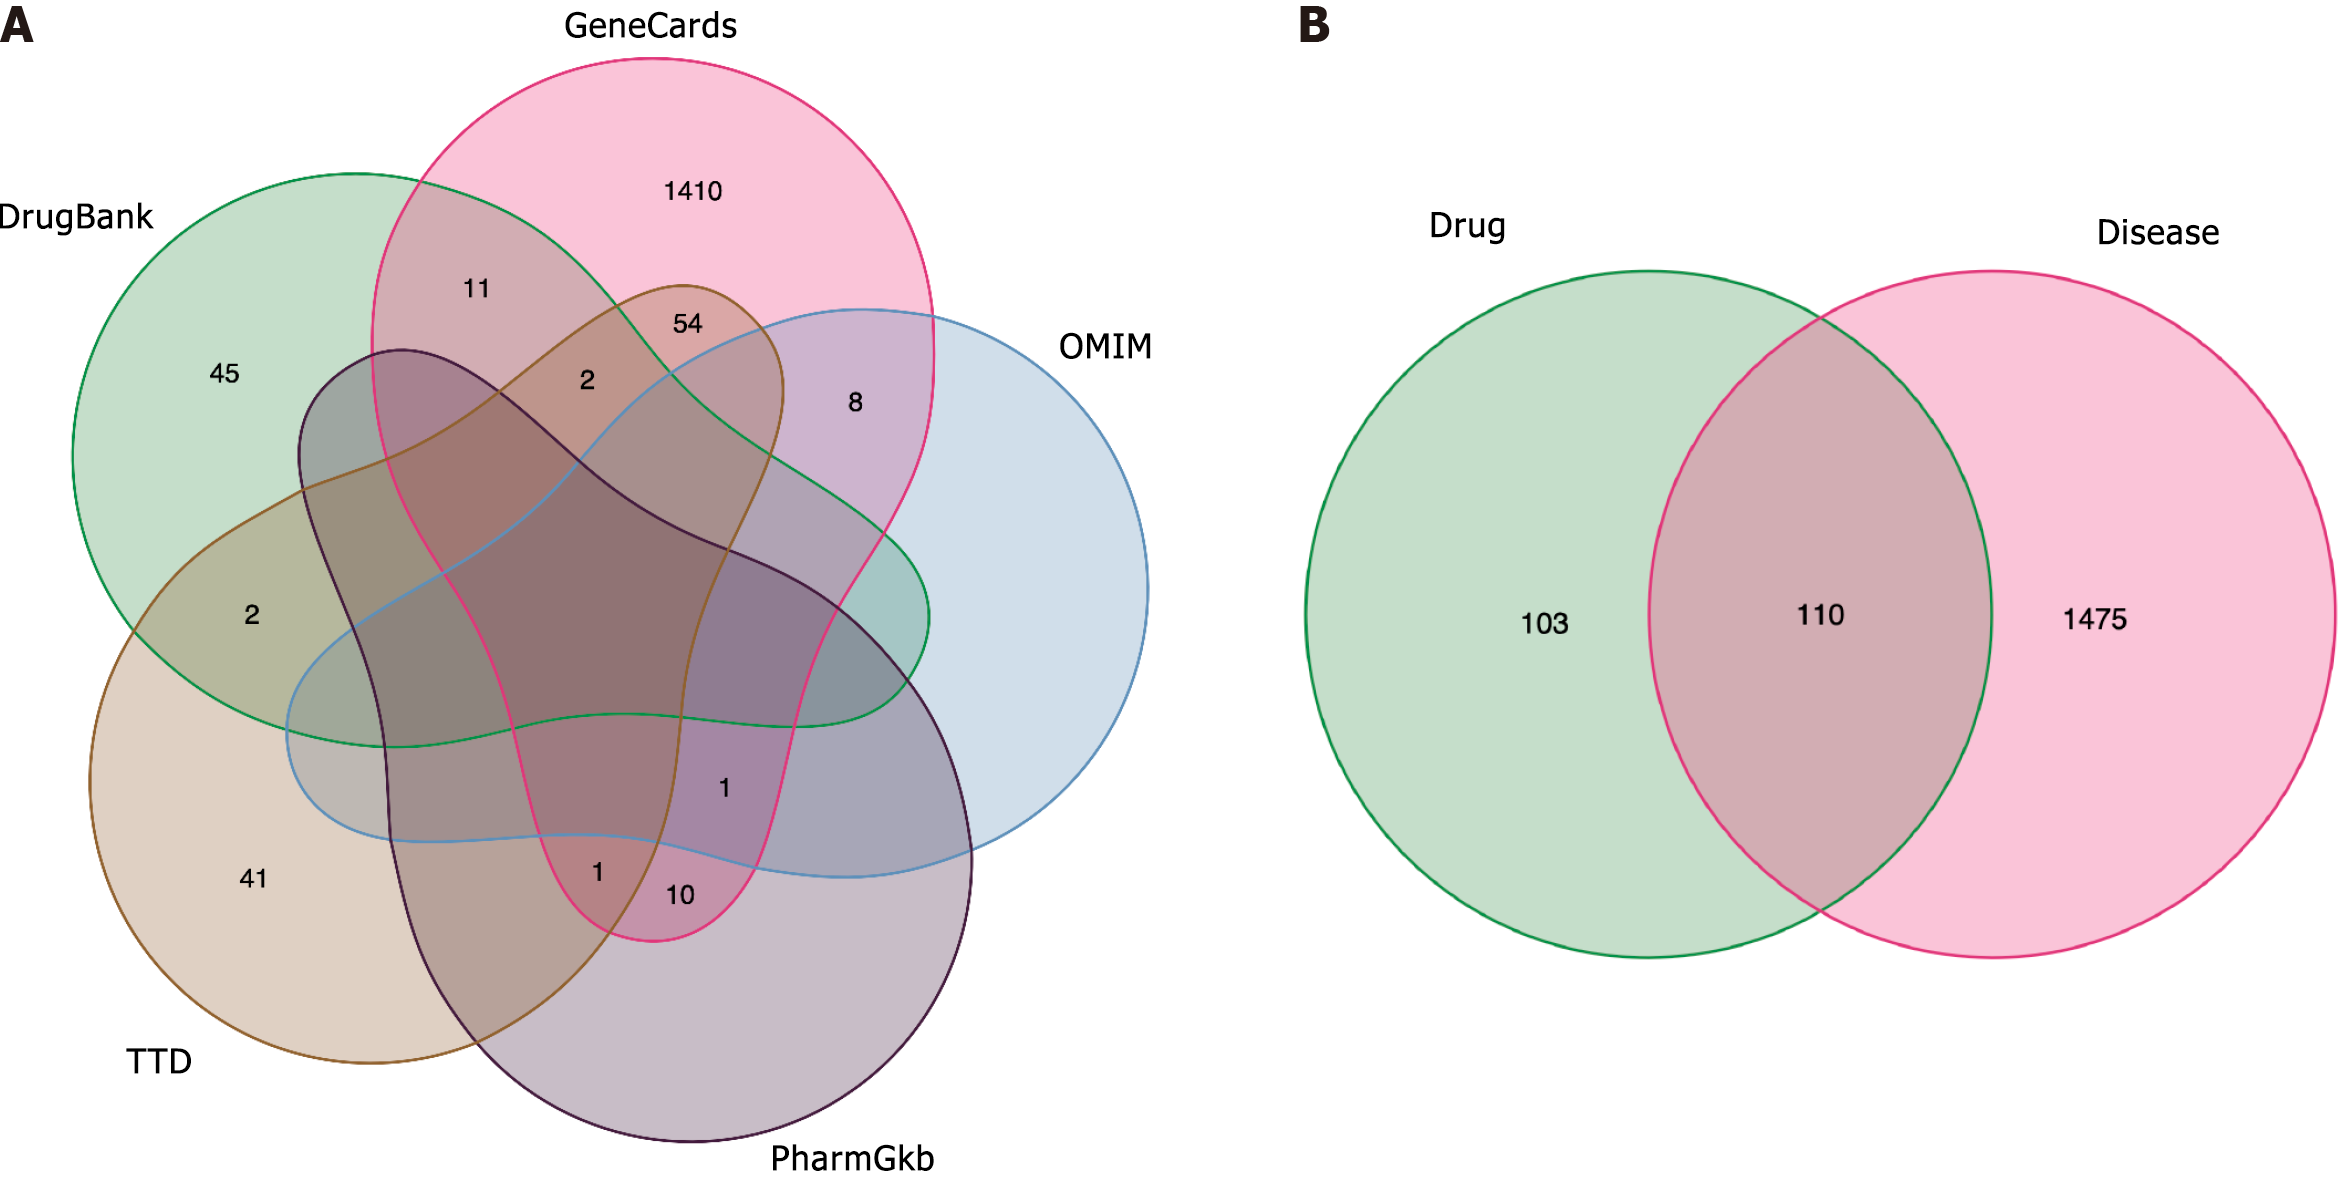
Figure 1 Gene screening.
A: Psoriasis (PSO)-related genes. GeneCards, Online Mendelian Inheritance in Man, PharmGkb, Therapeutic Target Database, and DrugBank databases of PSO-related genes were searched for PSO gene targets, and 1585 PSO gene targets were identified; B: Biyu decoction (BYT)-PSO intersection genes. The gene intersection between PSO-related genes and the predicted targets of BYT active ingredients represents the target of BYT in PSO. PSO: Psoriasis; OMIM: Online Mendelian Inheritance in Man; TTD: Therapeutic Target Database; BYT: Biyu decoction.
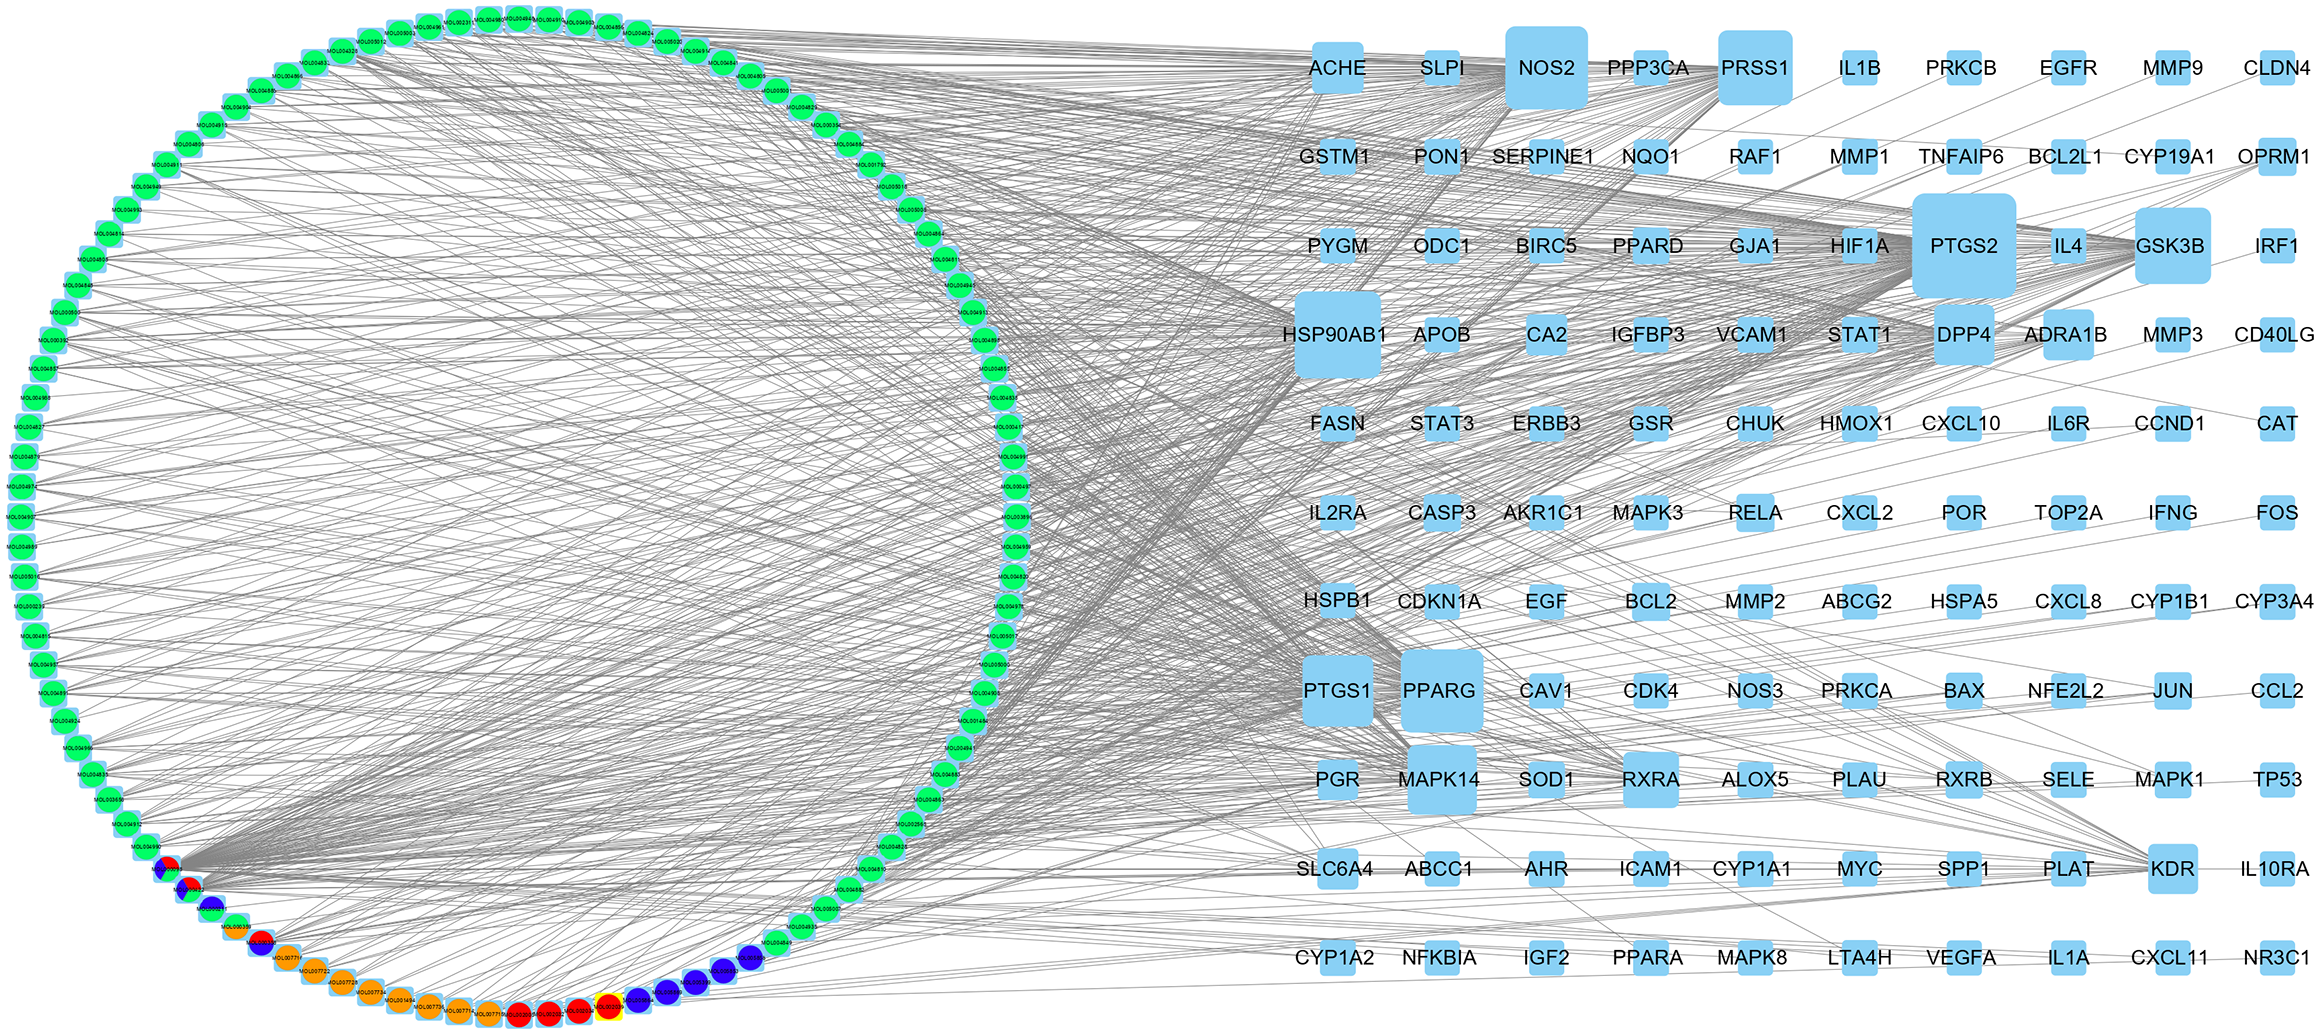
Figure 2 Biyu decoction-psoriasis network.
The circle indicates the drug component, orange represents Zicao, blue represents Diyu, red represents Cebaiye, and light green represents Gancao. The square represents the gene target. The larger the target, the more strongly the target is associated with the drug component. PSO: Psoriasis; BYT: Biyu decoction.
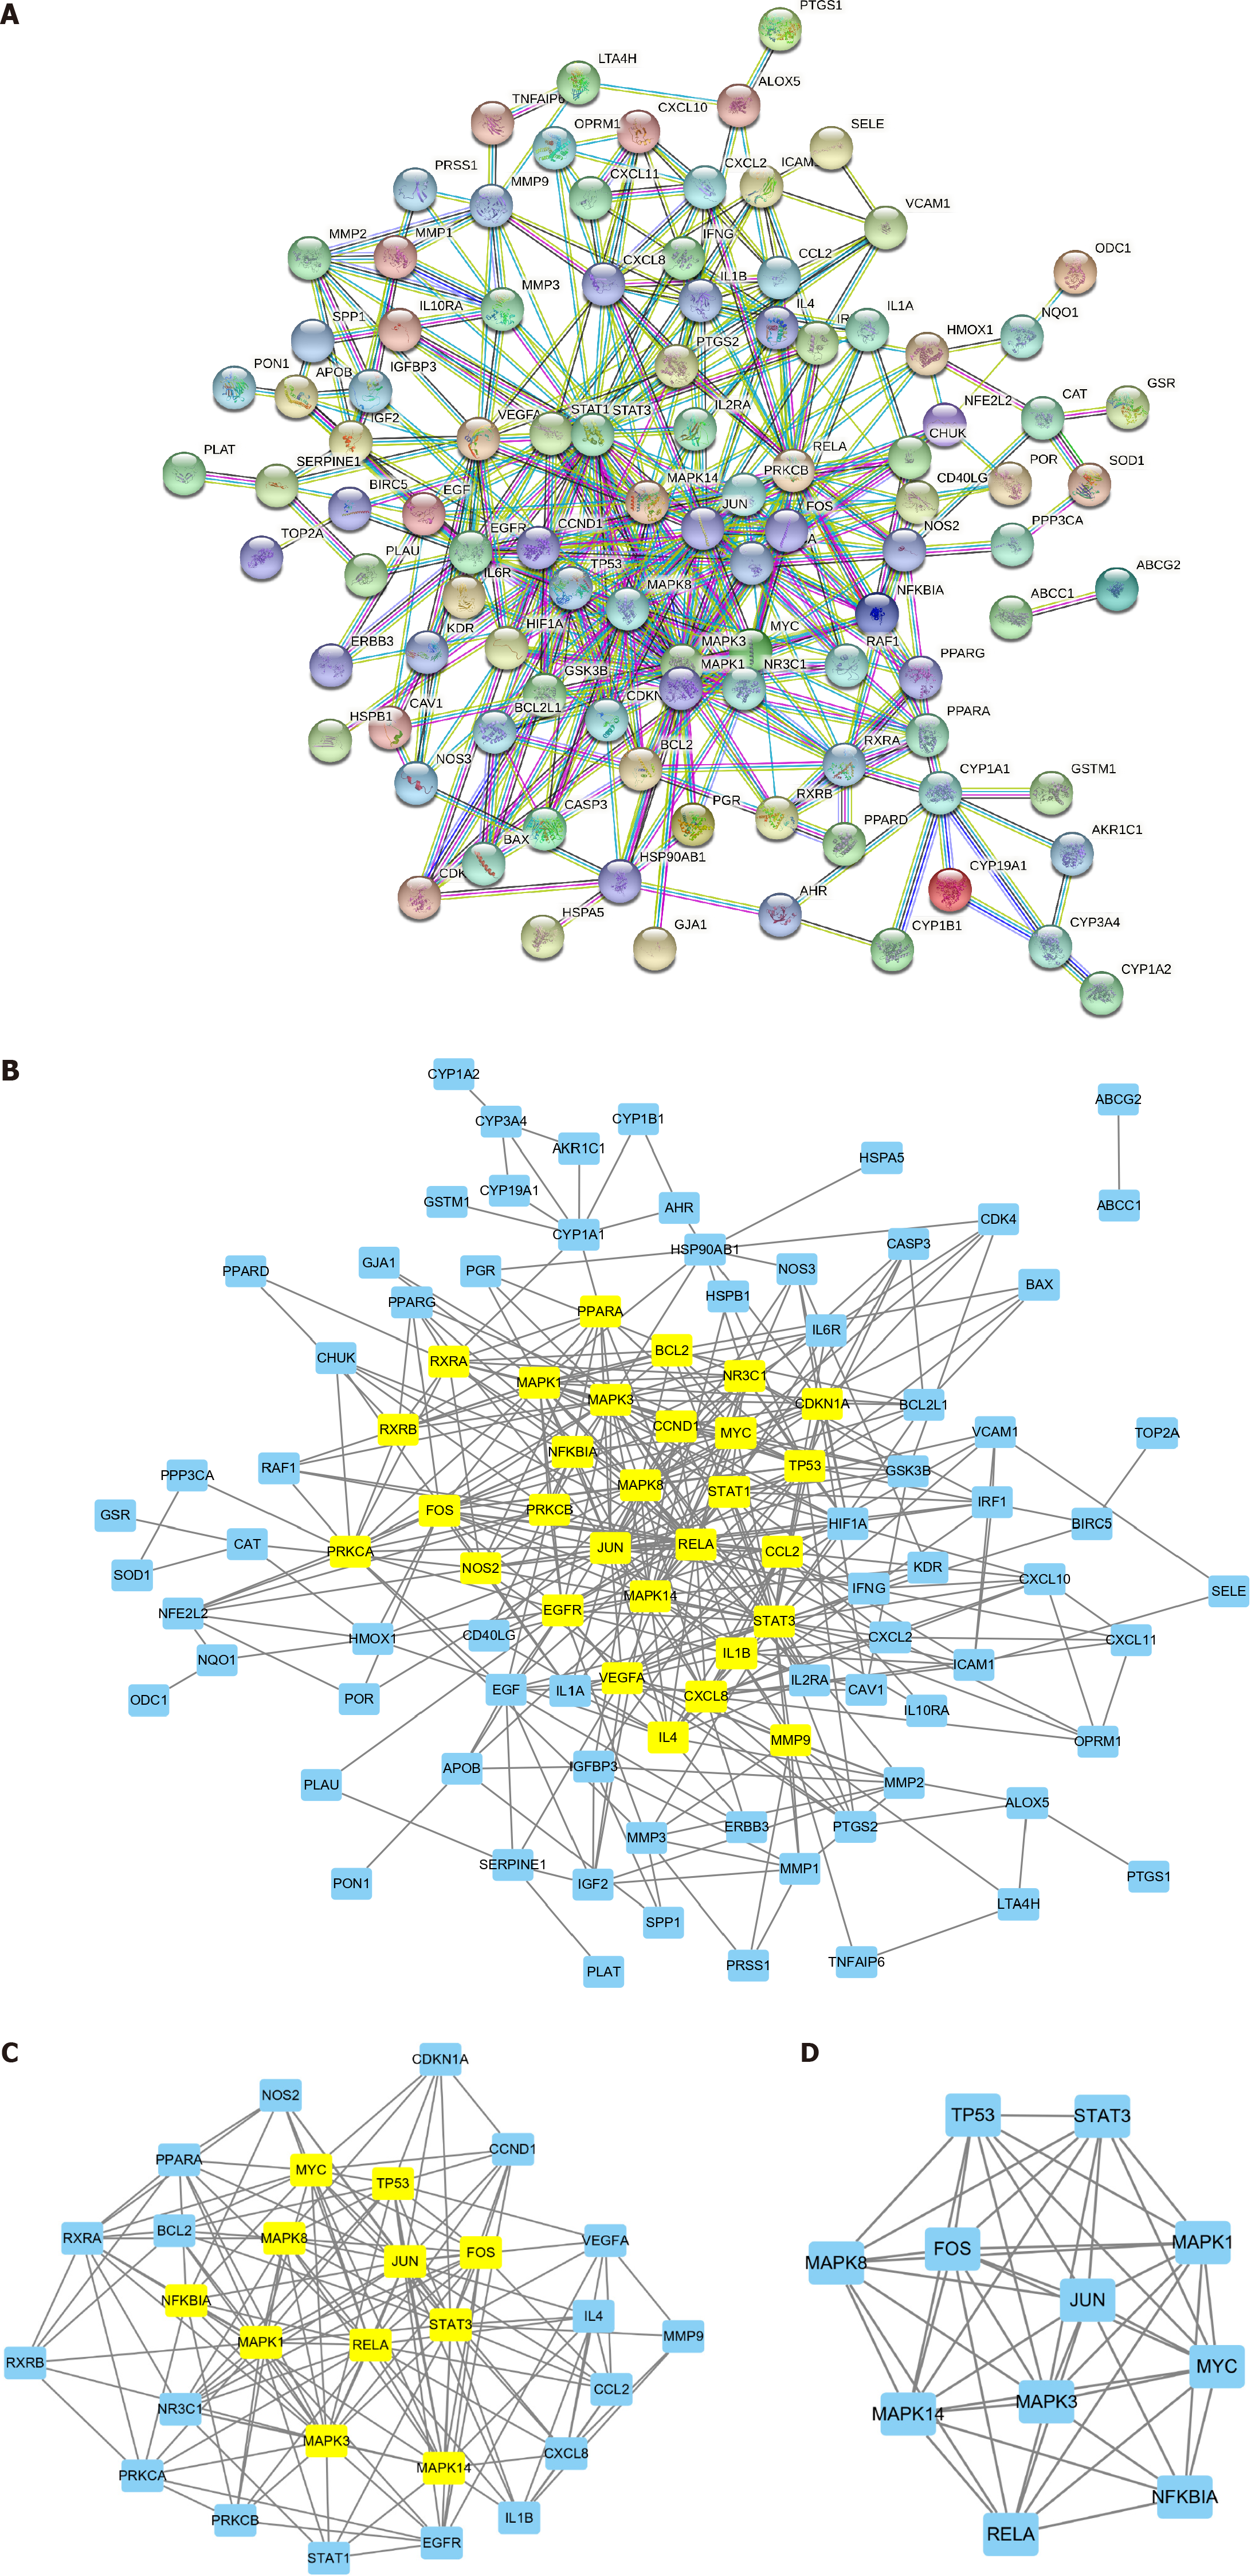
Figure 3 Protein-protein interaction network constructed from Biyu decoction-psoriasis intersection genes.
A: Biyu decoction-psoriasis intersection gene protein-protein interaction (PPI) network; B-D: PPI core gene network screening process. PSO: Psoriasis; BYT: Biyu decoction; PPI: Protein-protein interaction.
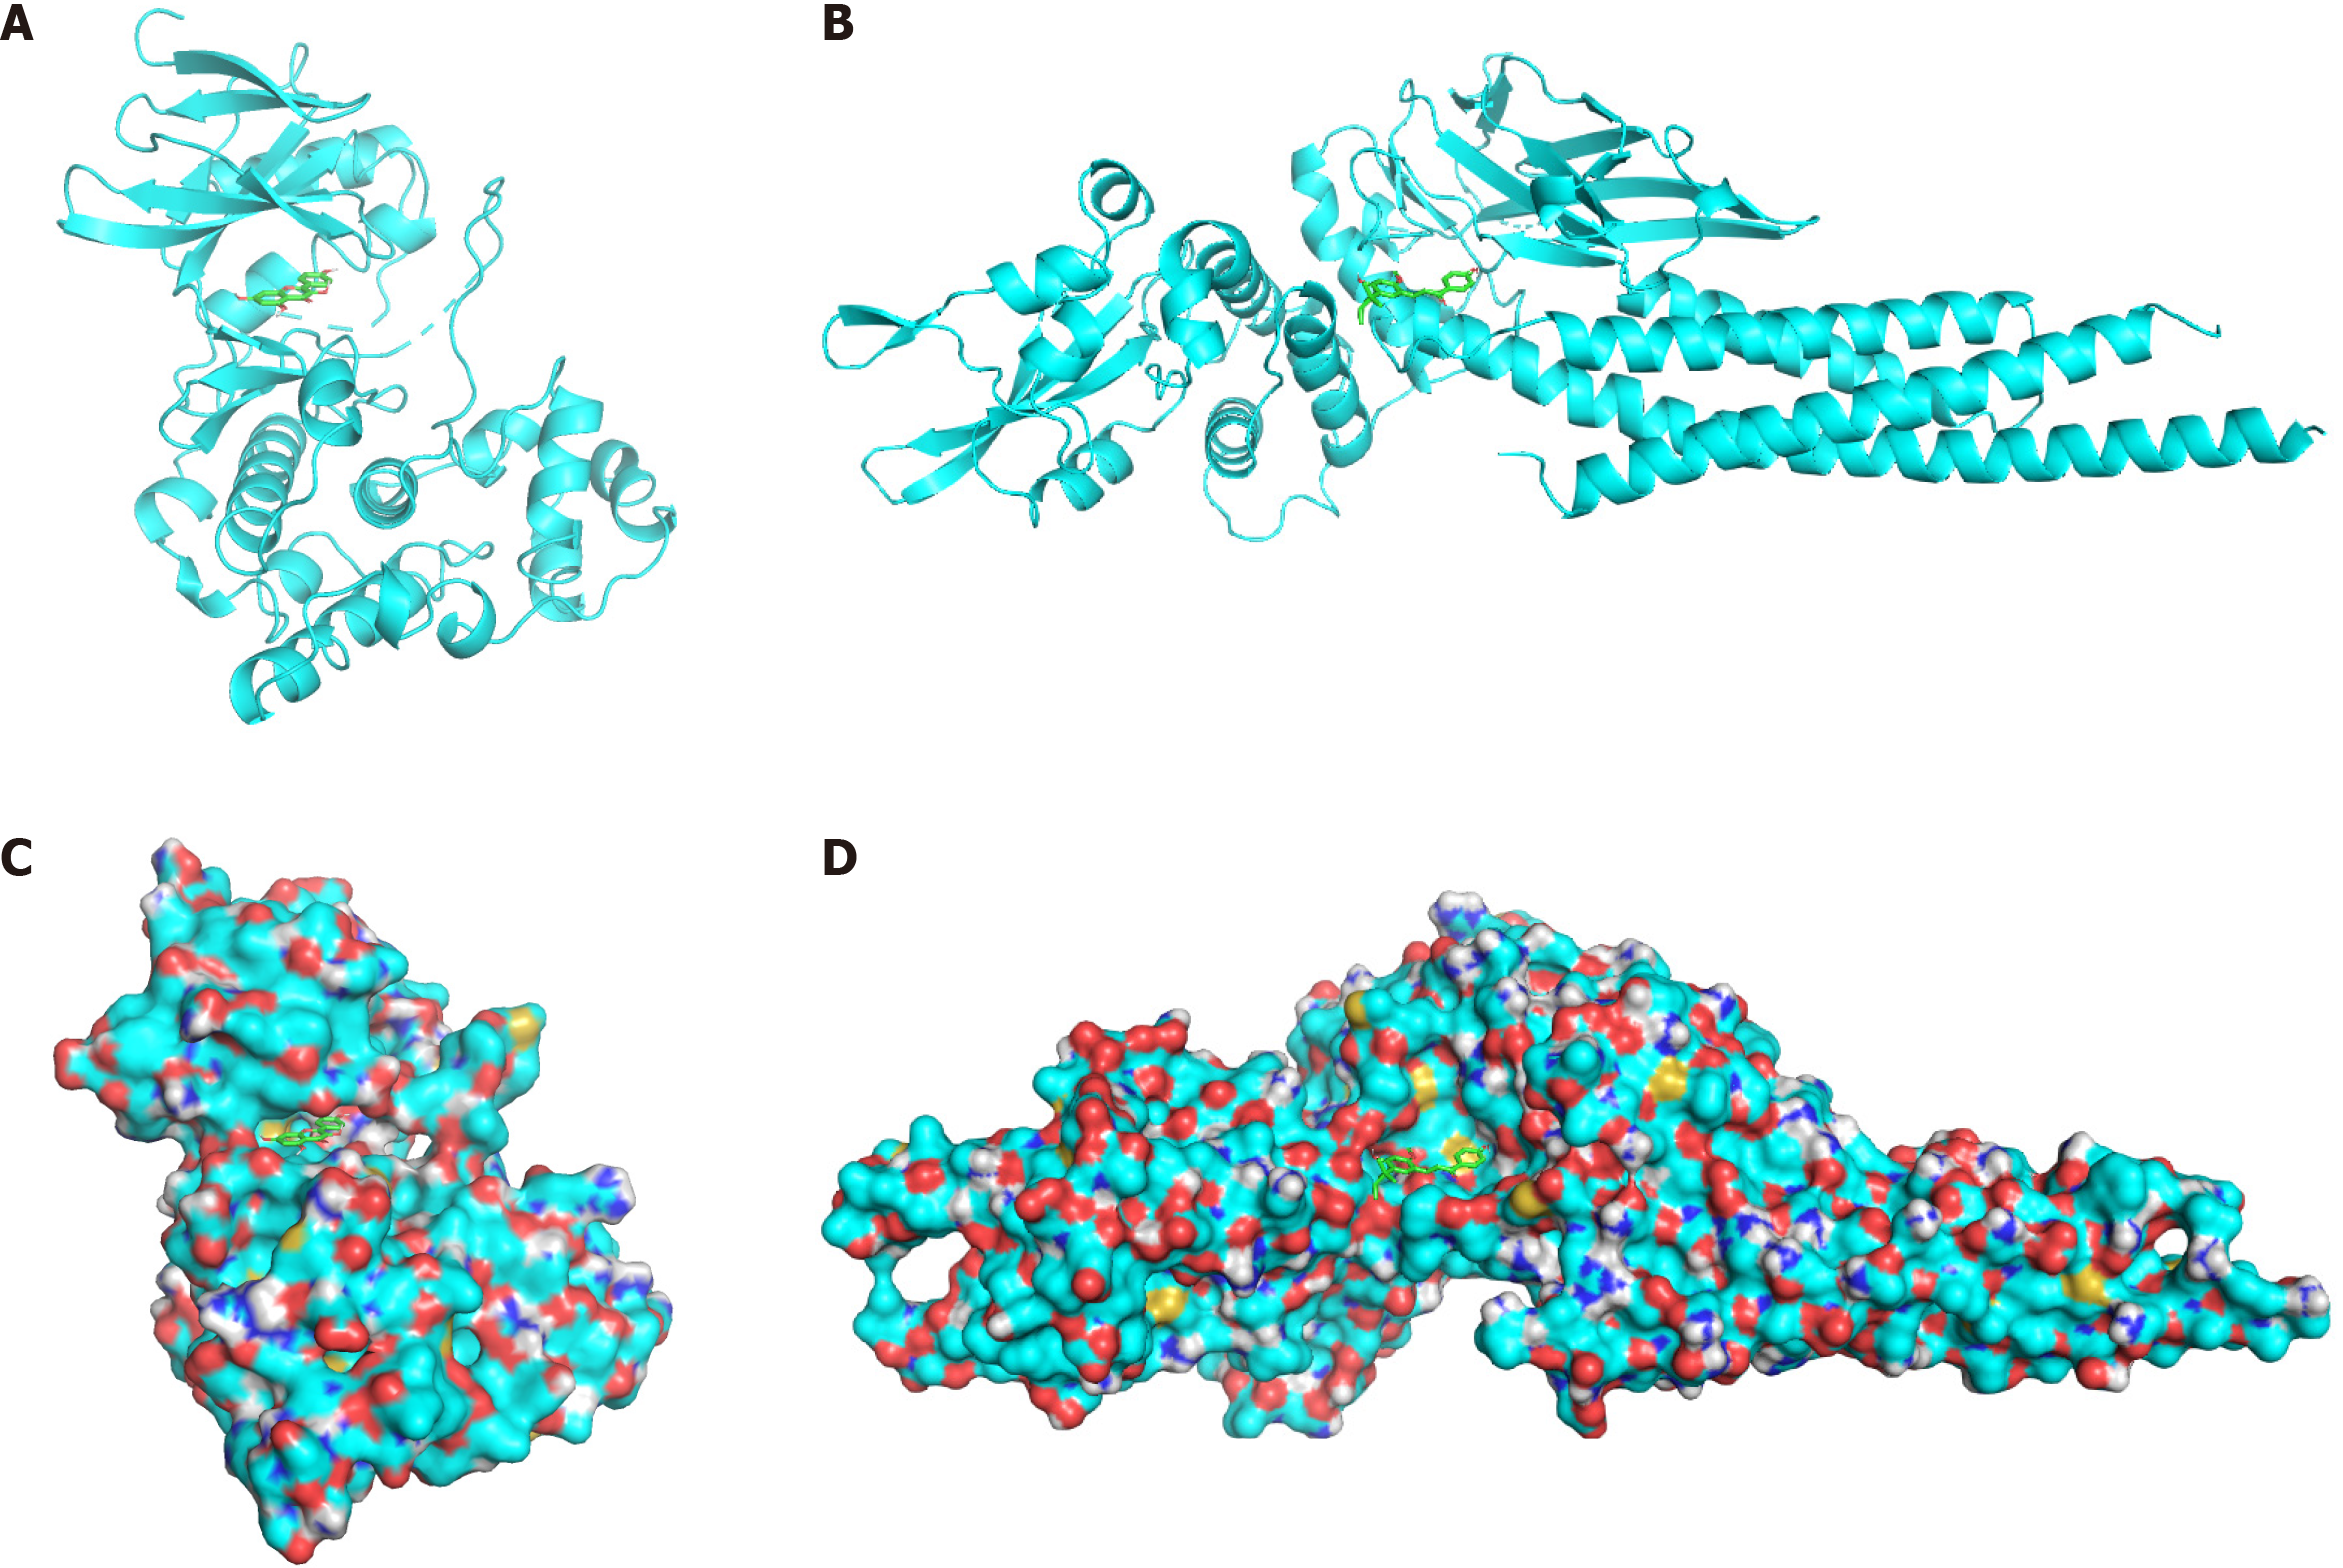
Figure 4 The docking model of the main active ingredients and core targets.
A and C: The docking models of kaempferol and MAPK8, respectively, and the compound surface is hidden; B and D: The docking models of licochalcone A and STAT3, respectively, and the compound surface is shown.
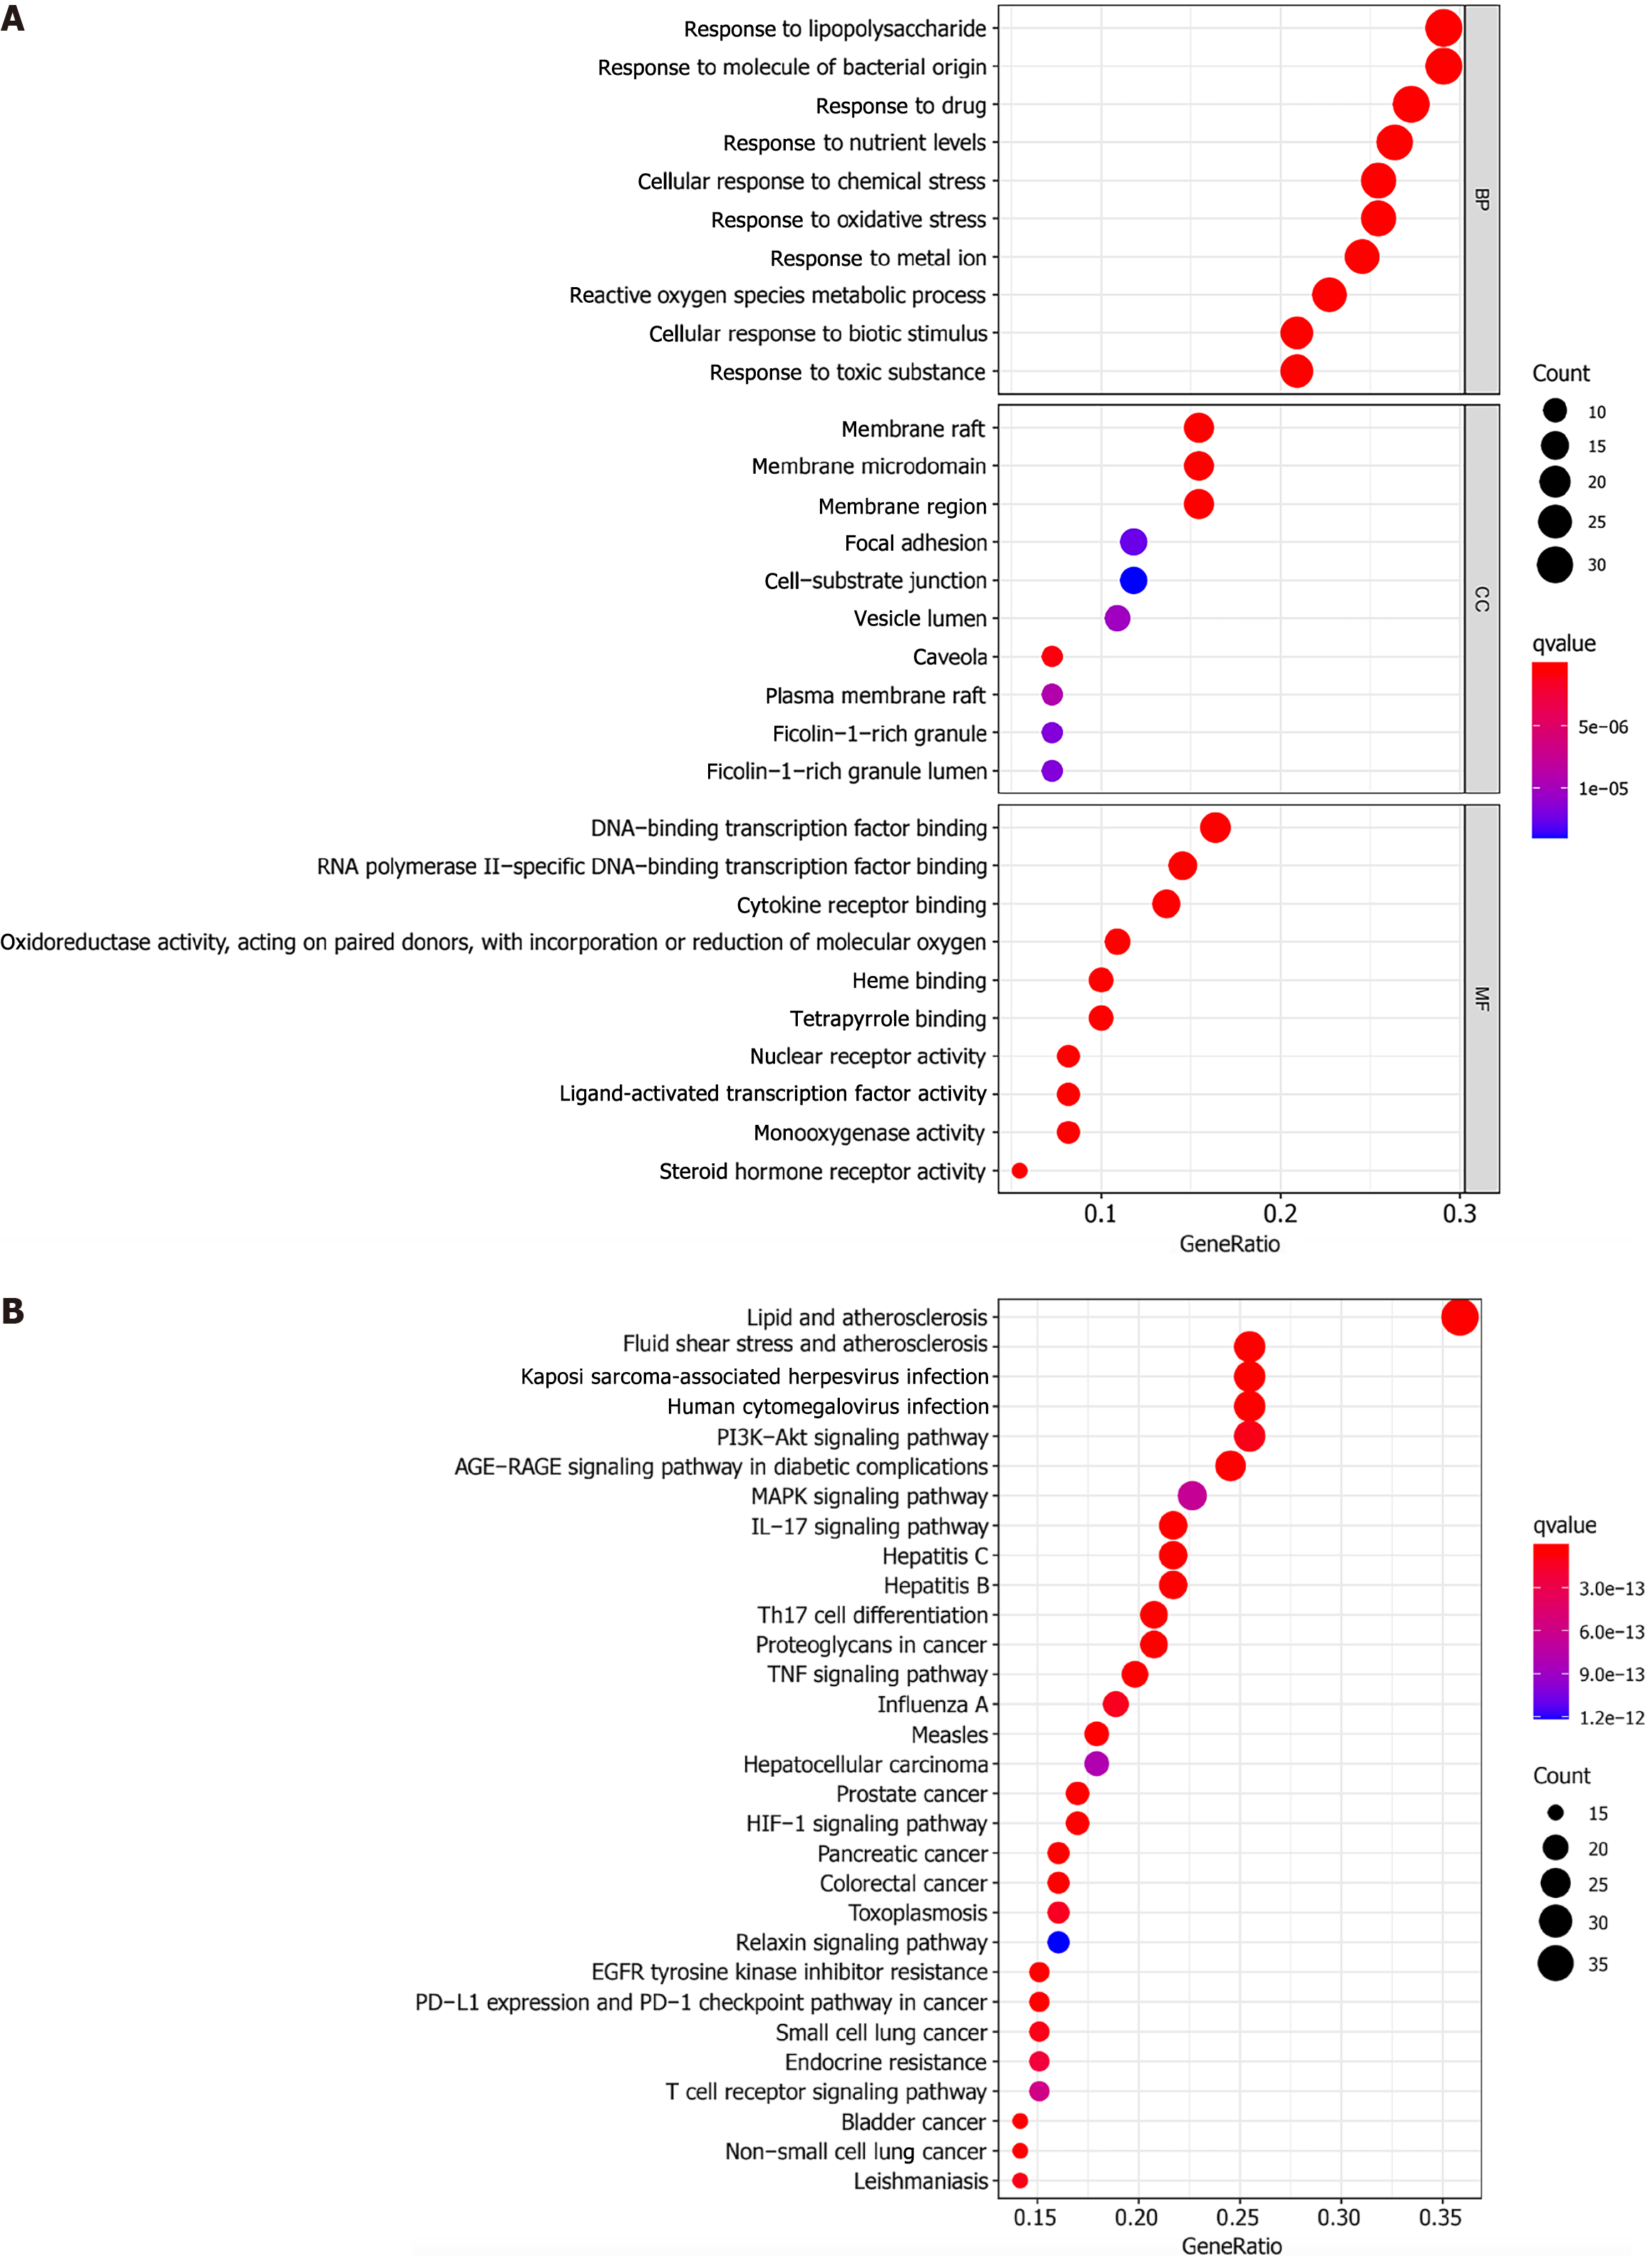
Figure 5 Enrichment analysis.
In the bubble chart, the ordinate is the name of the biological process or pathway, the abscissa is the proportion of genes, the size of the bubble represents the number of genes enriched in each gene ontology, and the color represents the significance of the enrichment. A: The Gene Ontology enrichment analysis indicates the biological response, gene distribution, and molecular function in which the target gene is mainly involved; B: The Kyoto Encyclopedia of Genes and Genomes enrichment analysis indicates the main pathway in which the target gene has a role. GO: Gene Ontology; KEGG: Kyoto Encyclopedia of Genes and Genomes; AGE-RAGE: Advanced glycation end products/receptor of AGE; TNF: Tumor necrosis factor; MAPK: Mitogen-activated protein kinase; HIF-1: Hypoxia-inducible factor 1; EGFR: Endothelial growth factor receptor; PD-L1: Programmed death-ligand 1; PD-1: Programmed cell death protein 1.
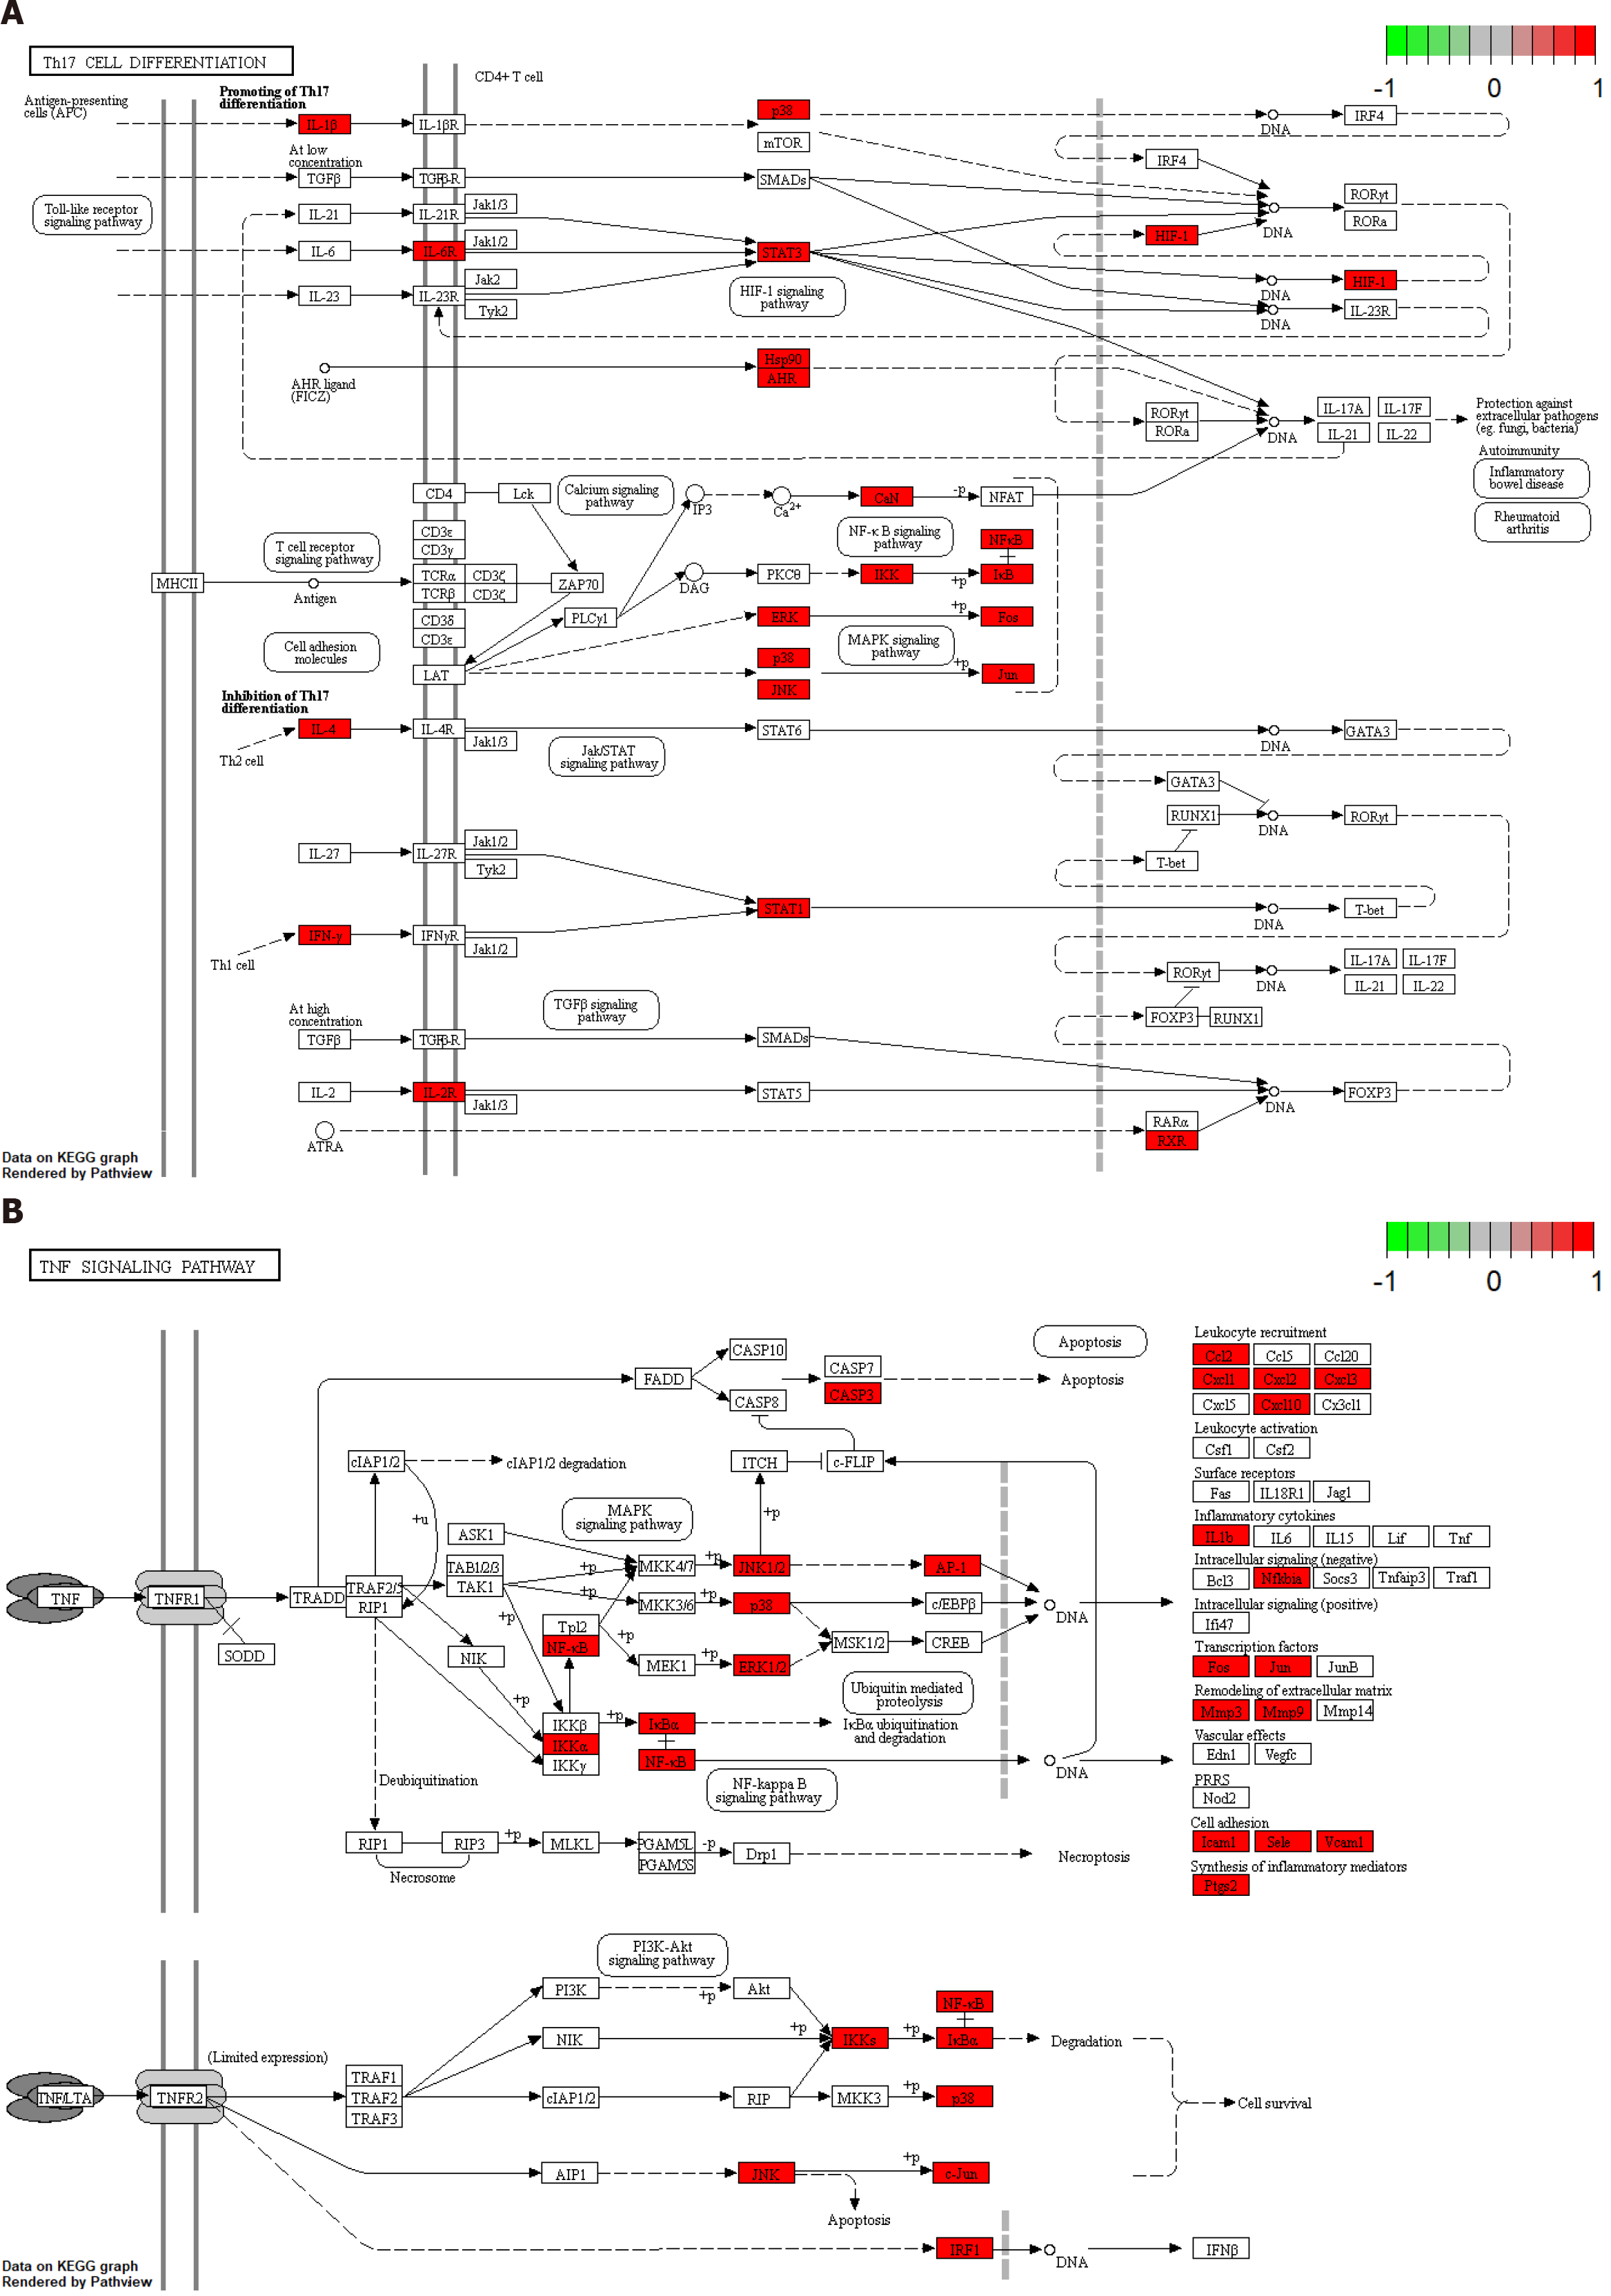
Figure 6 Pathway analysis of Biyu decoction-psoriasis intersection genes.
A: Pathway analysis of Th17 cell differentiation; B: Tumor necrosis factor signaling pathway potential target genes. PSO: Psoriasis; BYT: Biyu decoction; TNF: Tumor necrosis factor.
- Citation: Wang Z, Zhang HM, Guo YR, Li LL. Molecular mechanisms of Biyu decoction as treatment for psoriasis: A network pharmacology and molecular docking study. World J Clin Cases 2022; 10(21): 7224-7241
- URL: https://www.wjgnet.com/2307-8960/full/v10/i21/7224.htm
- DOI: https://dx.doi.org/10.12998/wjcc.v10.i21.7224


