Copyright
©The Author(s) 2022.
World J Clin Cases. Jul 16, 2022; 10(20): 6981-6990
Published online Jul 16, 2022. doi: 10.12998/wjcc.v10.i20.6981
Published online Jul 16, 2022. doi: 10.12998/wjcc.v10.i20.6981
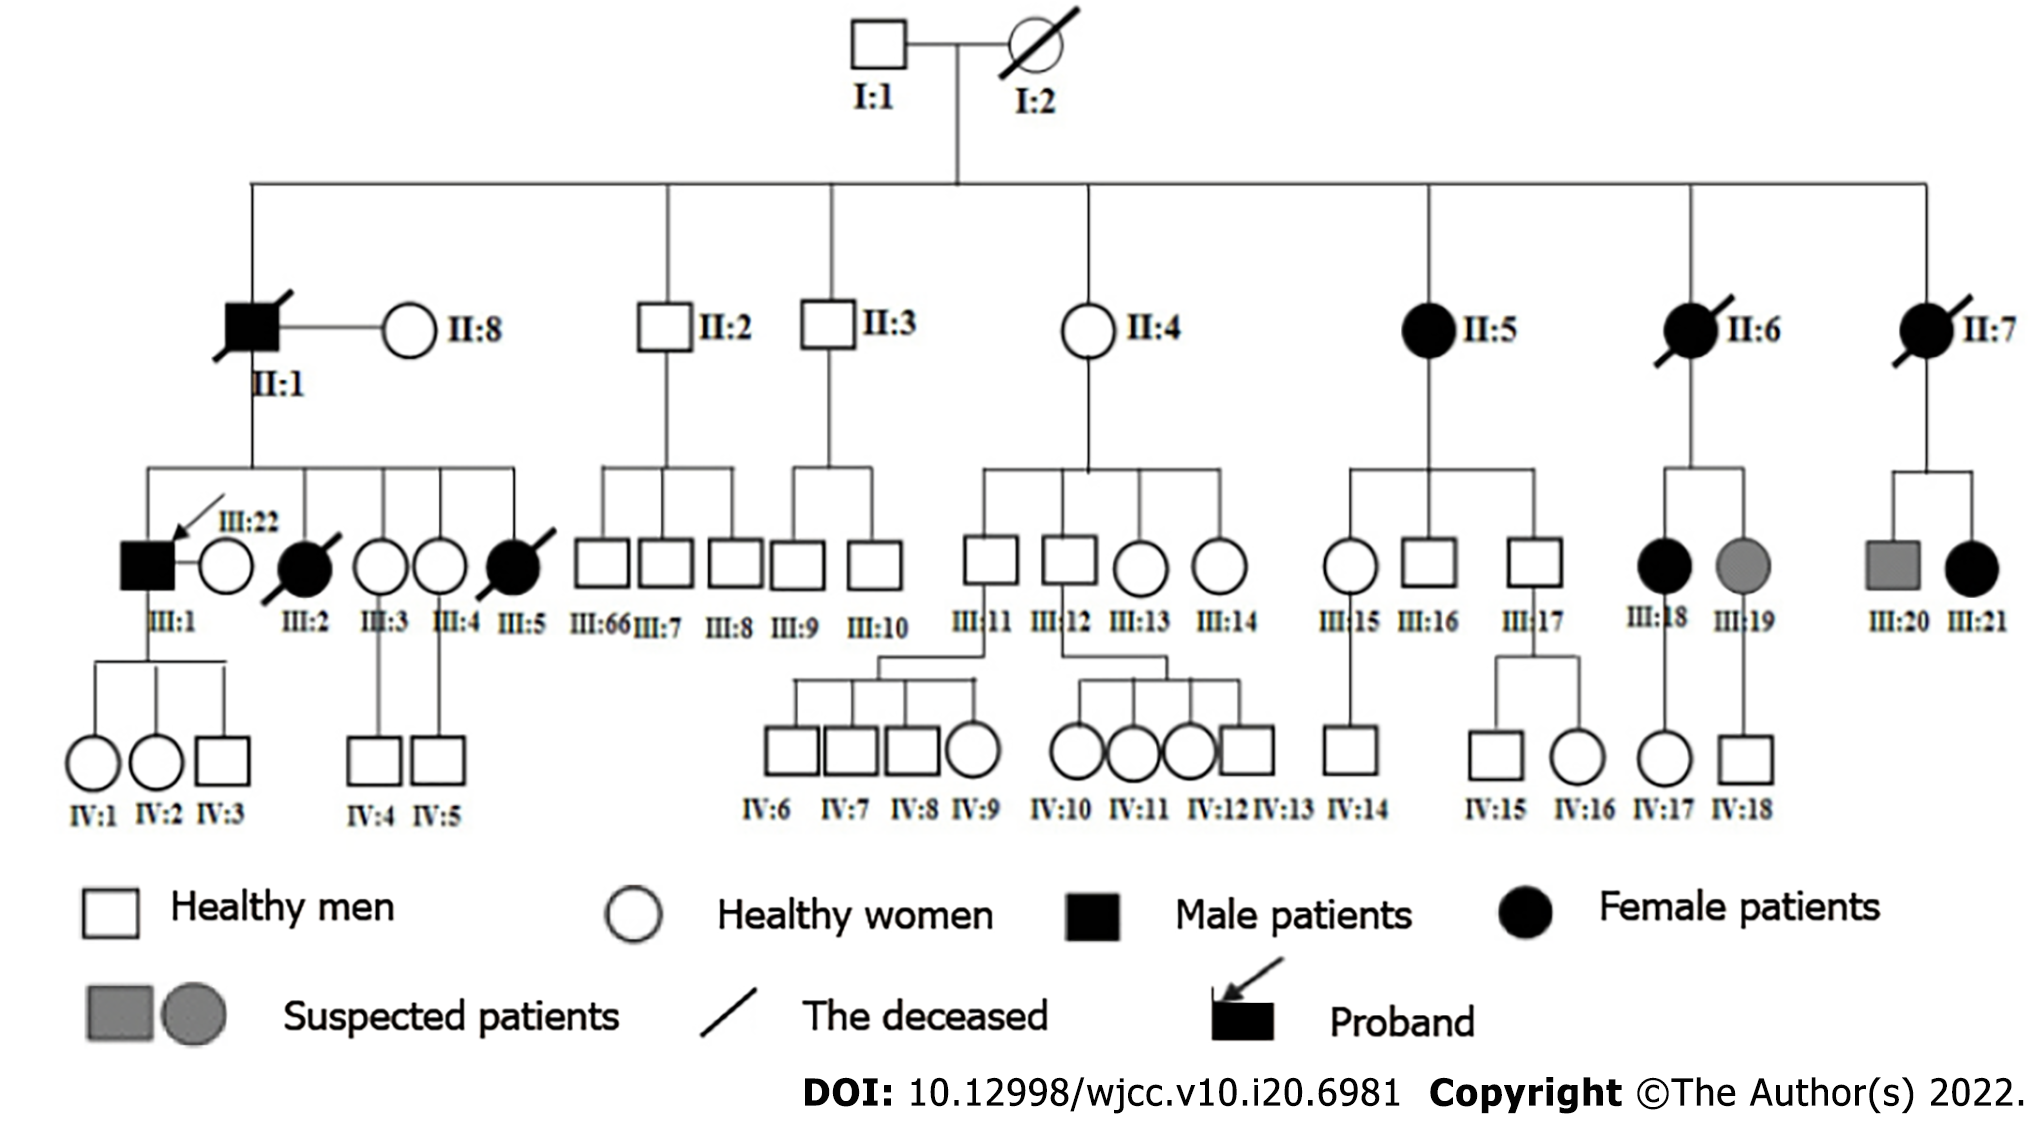
Figure 1 Family map of this patient with schwannoma disease.
This patient is listed as the proband (III: 1).
Figure 2 Magnetic resonance imaging scan results.
A: Cervical magnetic resonance imaging (MRI) scan; B: Thoracic MRI scan; C: Lumbar MRI scan; D: Pelvic MRI scan (Tumors are shown with arrows).
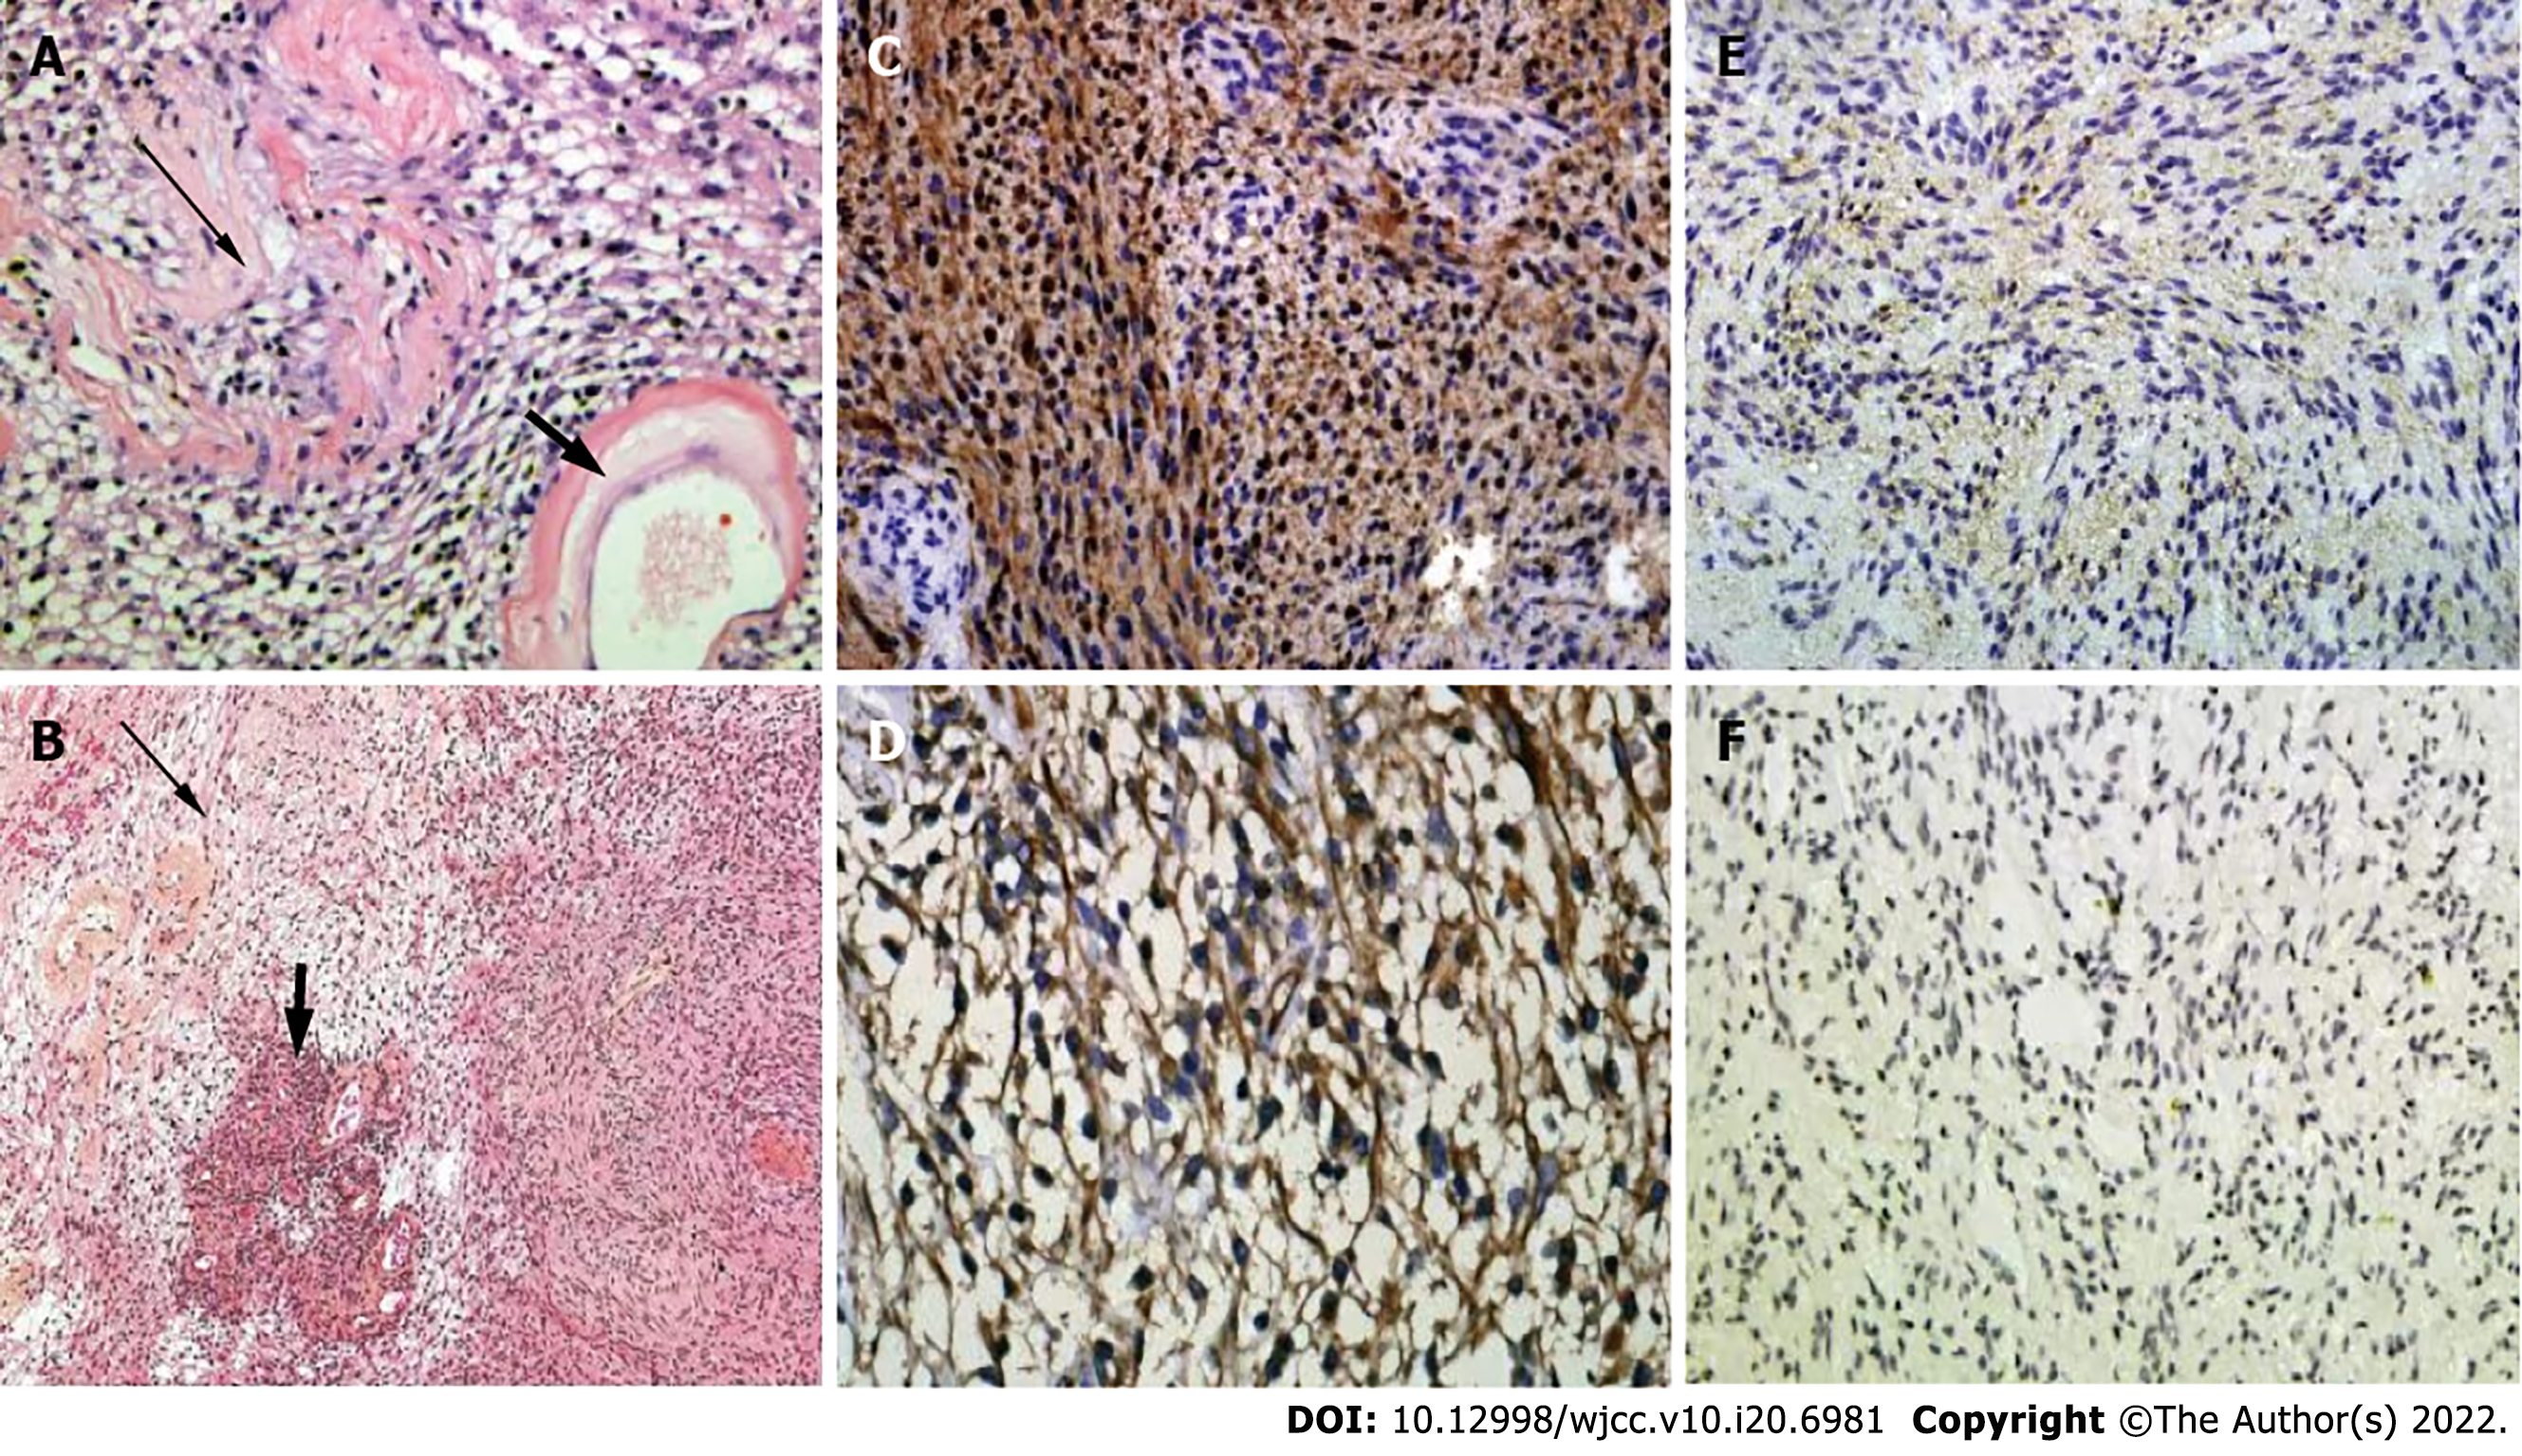
Figure 3 Immunohistochemical results of tumor.
A and B: HE-stained images, showing Antoni A region (thick short arrow) and Antoni B region (slender arrow), and Verocay corpuscle in Antoni A region; C and D: Strong S-100 positive staining and Vimentin positive staining, respectively; E: Strongly positive merlin protein staining; F: Mosaic-like INI1 protein staining.
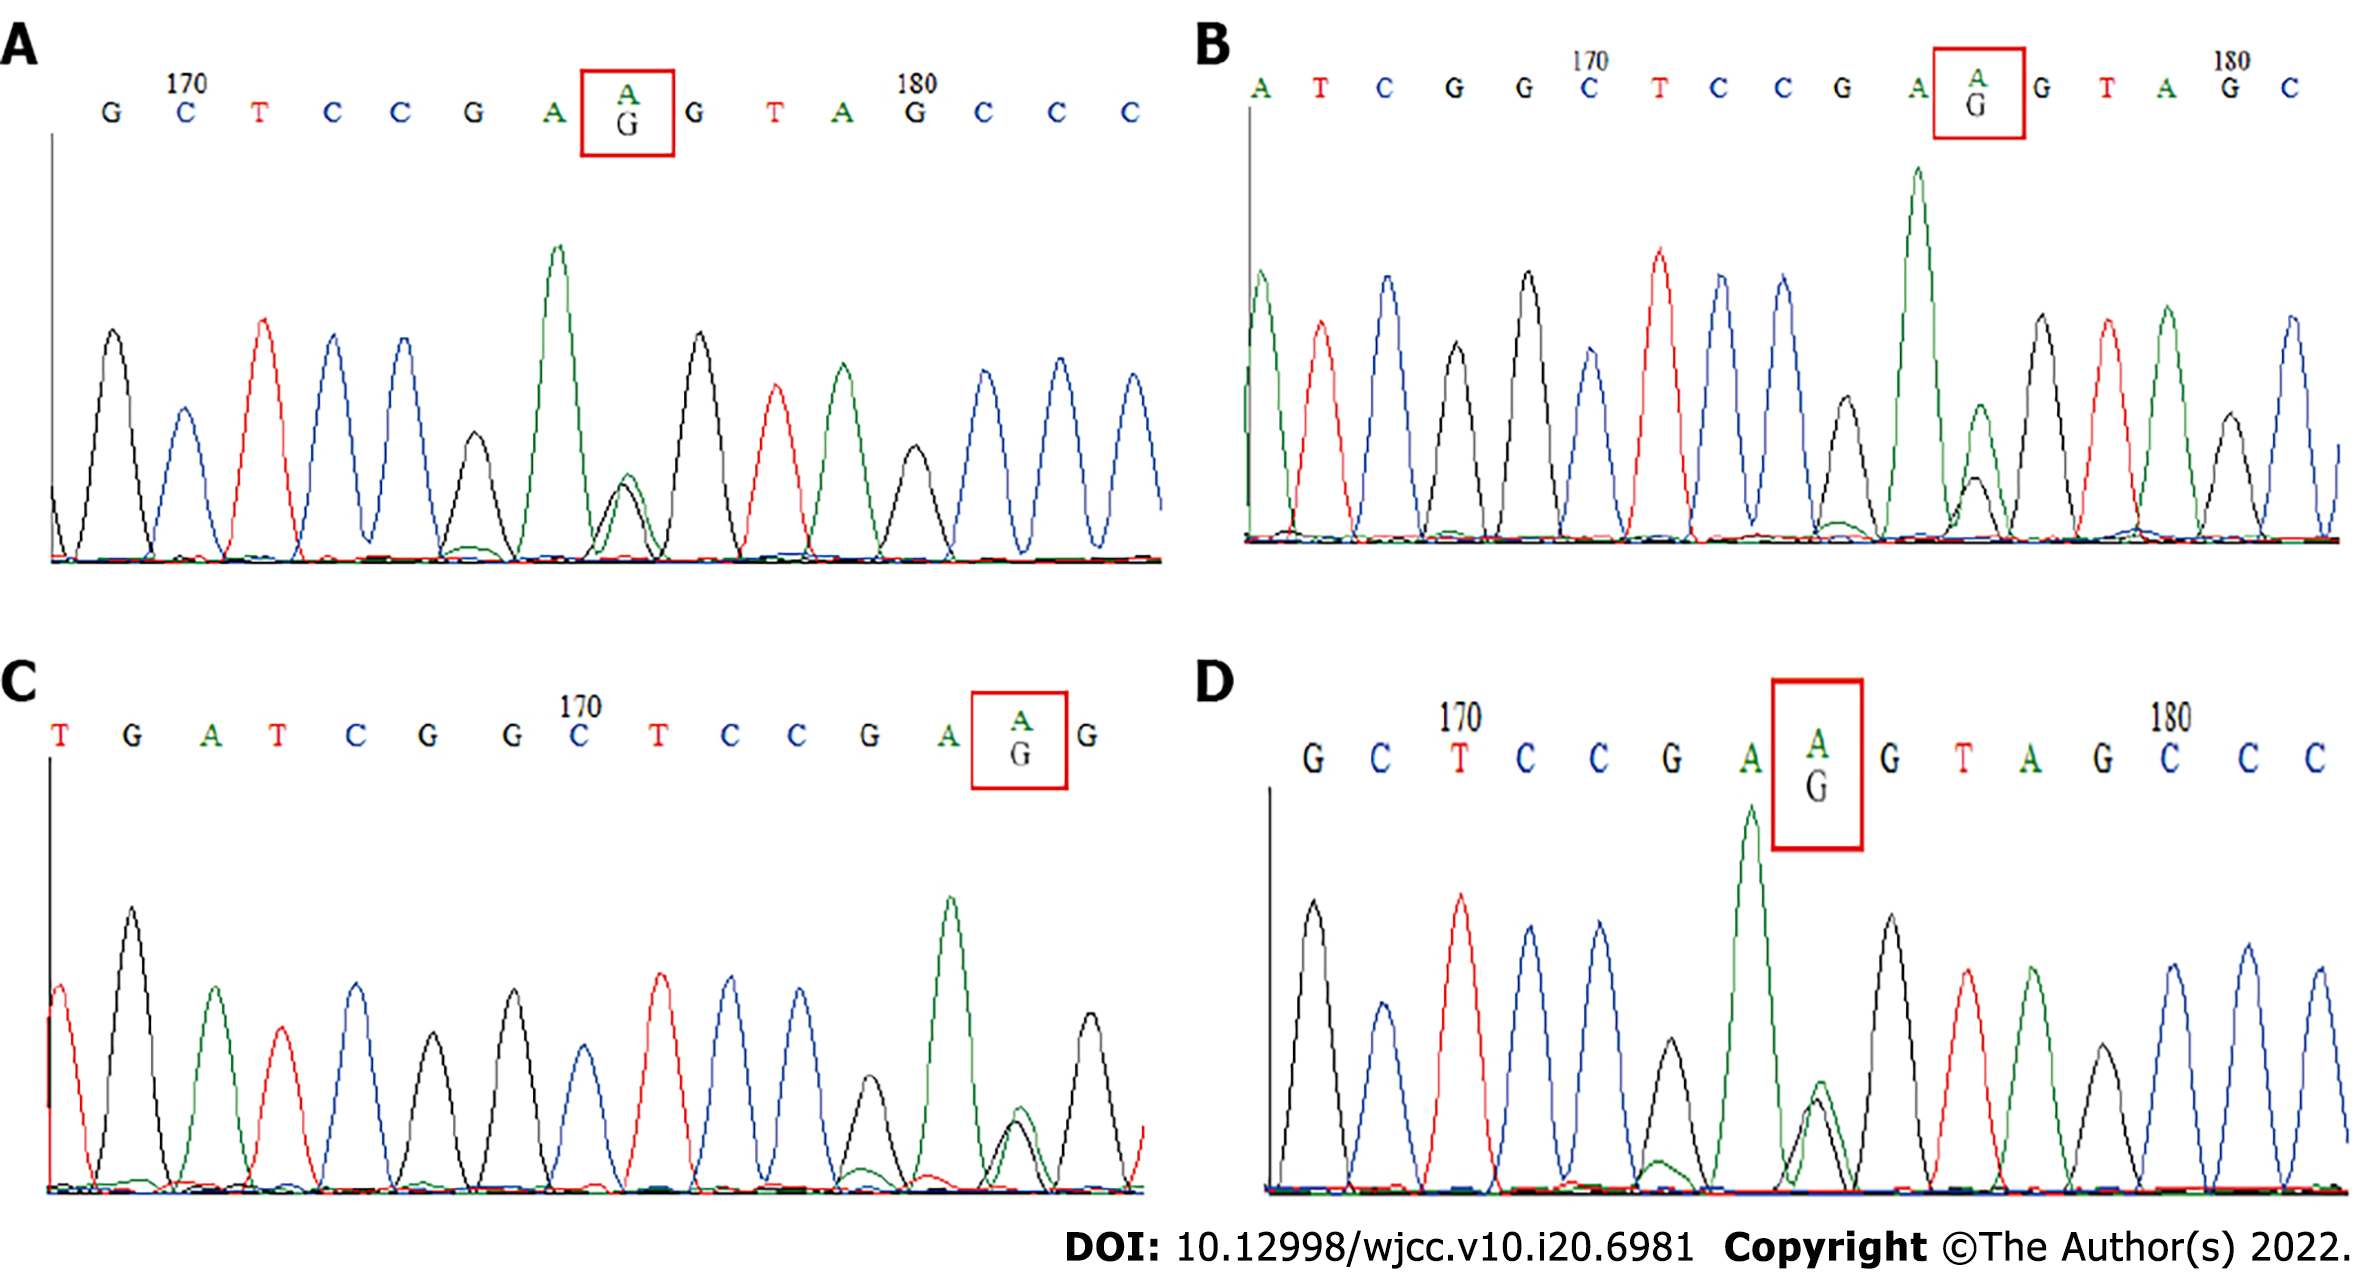
Figure 4 C.
93G→A mutation at codon 31 of exon 1 of the SMARCB1 gene in patients. A-D: Results of blood, cevical spinal tumor, thoracic spinal tumor and pelvic tumor samples, respectively.
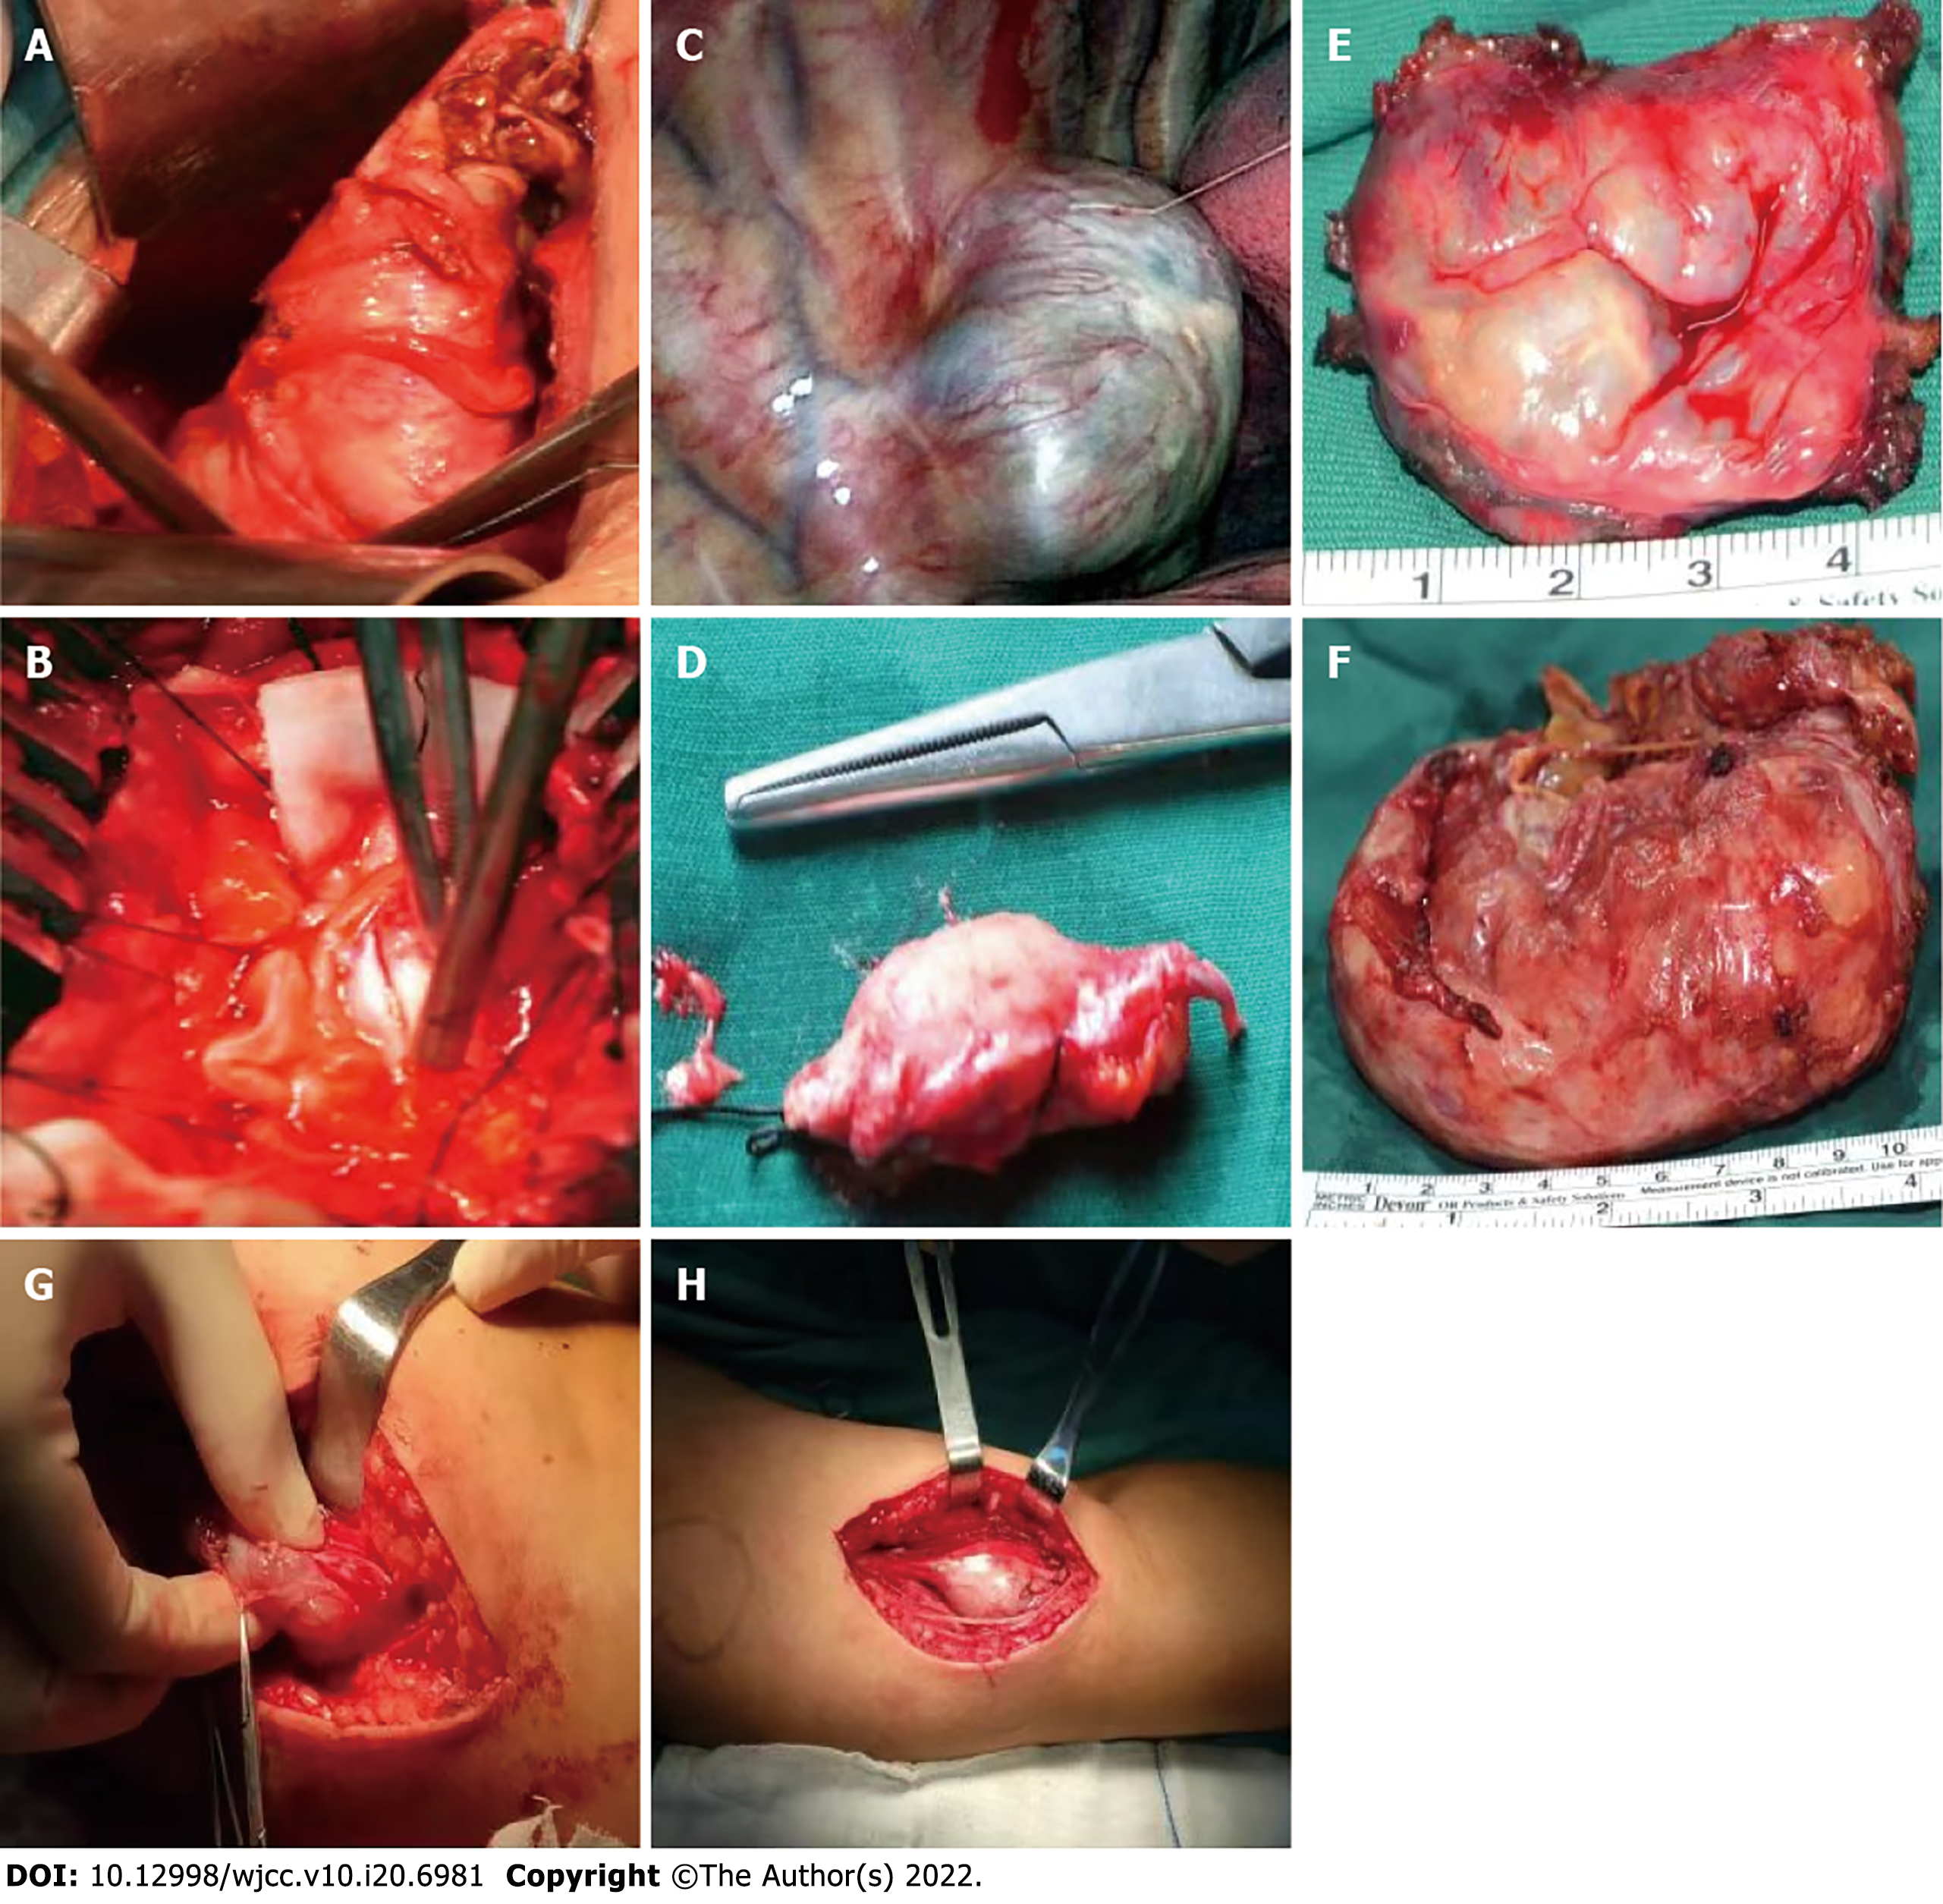
Figure 5 Intraoperative images.
A-F: Intraoperative images from previous surgeries. A-C: Schwannoma exposed during the operation; D: Schwannoma tissue removed during lumbar spinal surgery; E: Schwannoma tissue removed during thoracic spinal surgery; F: Large schwannoma tissue specimen removed during pelvic surgery. G-H: Intraoperative images from recent surgeries, schwannoma exposed in the left forearm of this patient.
- Citation: Li K, Liu SJ, Wang HB, Yin CY, Huang YS, Guo WT. Schwannomatosis patient who was followed up for fifteen years: A case report. World J Clin Cases 2022; 10(20): 6981-6990
- URL: https://www.wjgnet.com/2307-8960/full/v10/i20/6981.htm
- DOI: https://dx.doi.org/10.12998/wjcc.v10.i20.6981


