Copyright
©The Author(s) 2022.
World J Clin Cases. Jul 16, 2022; 10(20): 6900-6914
Published online Jul 16, 2022. doi: 10.12998/wjcc.v10.i20.6900
Published online Jul 16, 2022. doi: 10.12998/wjcc.v10.i20.6900
Figure 1
Based on the intersection of drug and disease targets, we obtained 115 genes, which means that these genes could play a major role in Sanqi and Huangjing treatment for diabetes mellitus.
Figure 2 The active ingredients of Sanqi and Huangjing and the 115 targets were obtained using Cytoscape 3.
8.2.
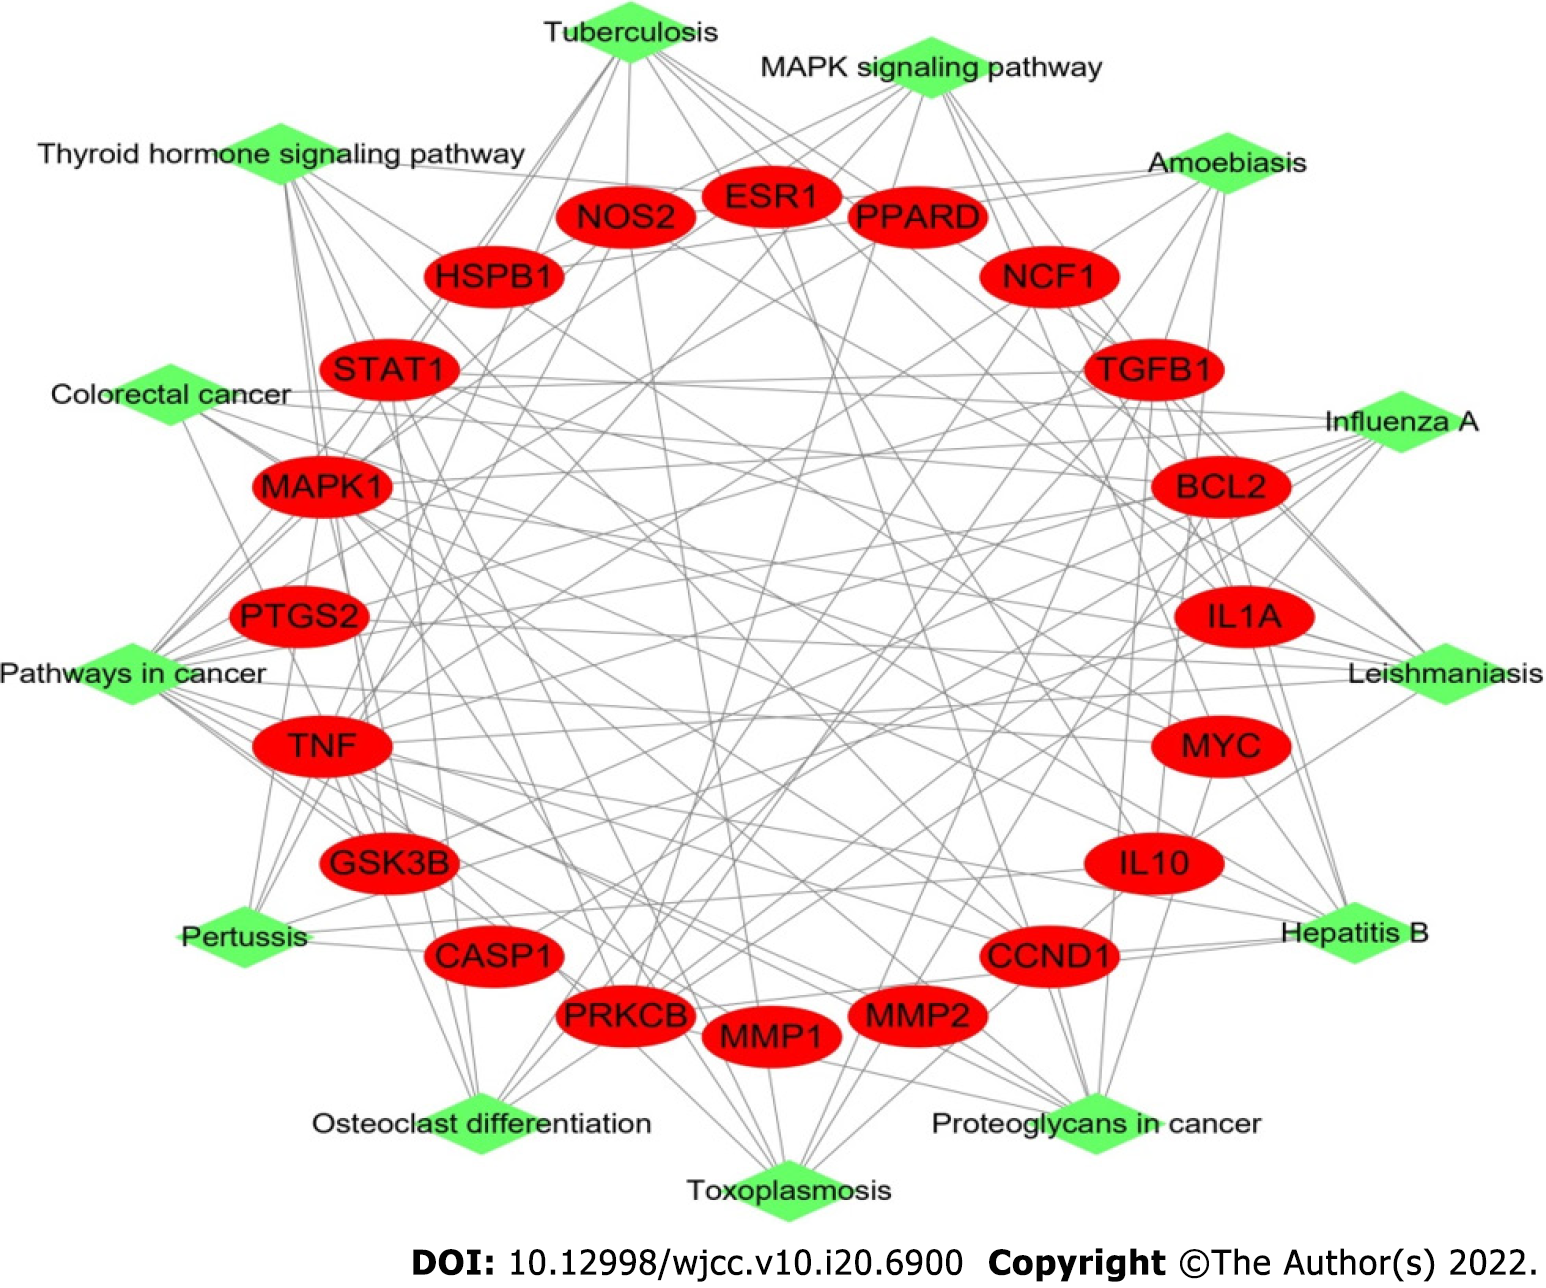
Figure 3 Target-pathway network in Sanqi and Huangjing-diabetes mellitus.
This network shows the relationship between the enriched 13 pathways and 20 genes. The green nodes represent the pathway of Sanqi and Huangjing in the treatment of diabetes mellitus. The red nodes represent the target genes. The edges represent the interaction between the red and green nodes.
Figure 4 Protein-protein interaction network.
A: The protein-protein interaction (PPI) network of 115 overlapping genes of Sanqi and Huangjing and diabetes mellitus; B: Top 10 hub genes in the PPI network. AKT1: RAC-alpha serine/threonine-protein kinase; IL6: Interleukin 6; TNF: Tumor necrosis factor; TP53: Cellular tumor antigen p53; CASP3: Caspase-3; JUN: Transcription factor AP-1; MAPK1: Mitogen-activated protein kinase 1; MMP9: Matrix metallopeptidase-9; PTGS2: Prostaglandin G/H synthase 2; EGFR: Epidermal growth factor receptor.
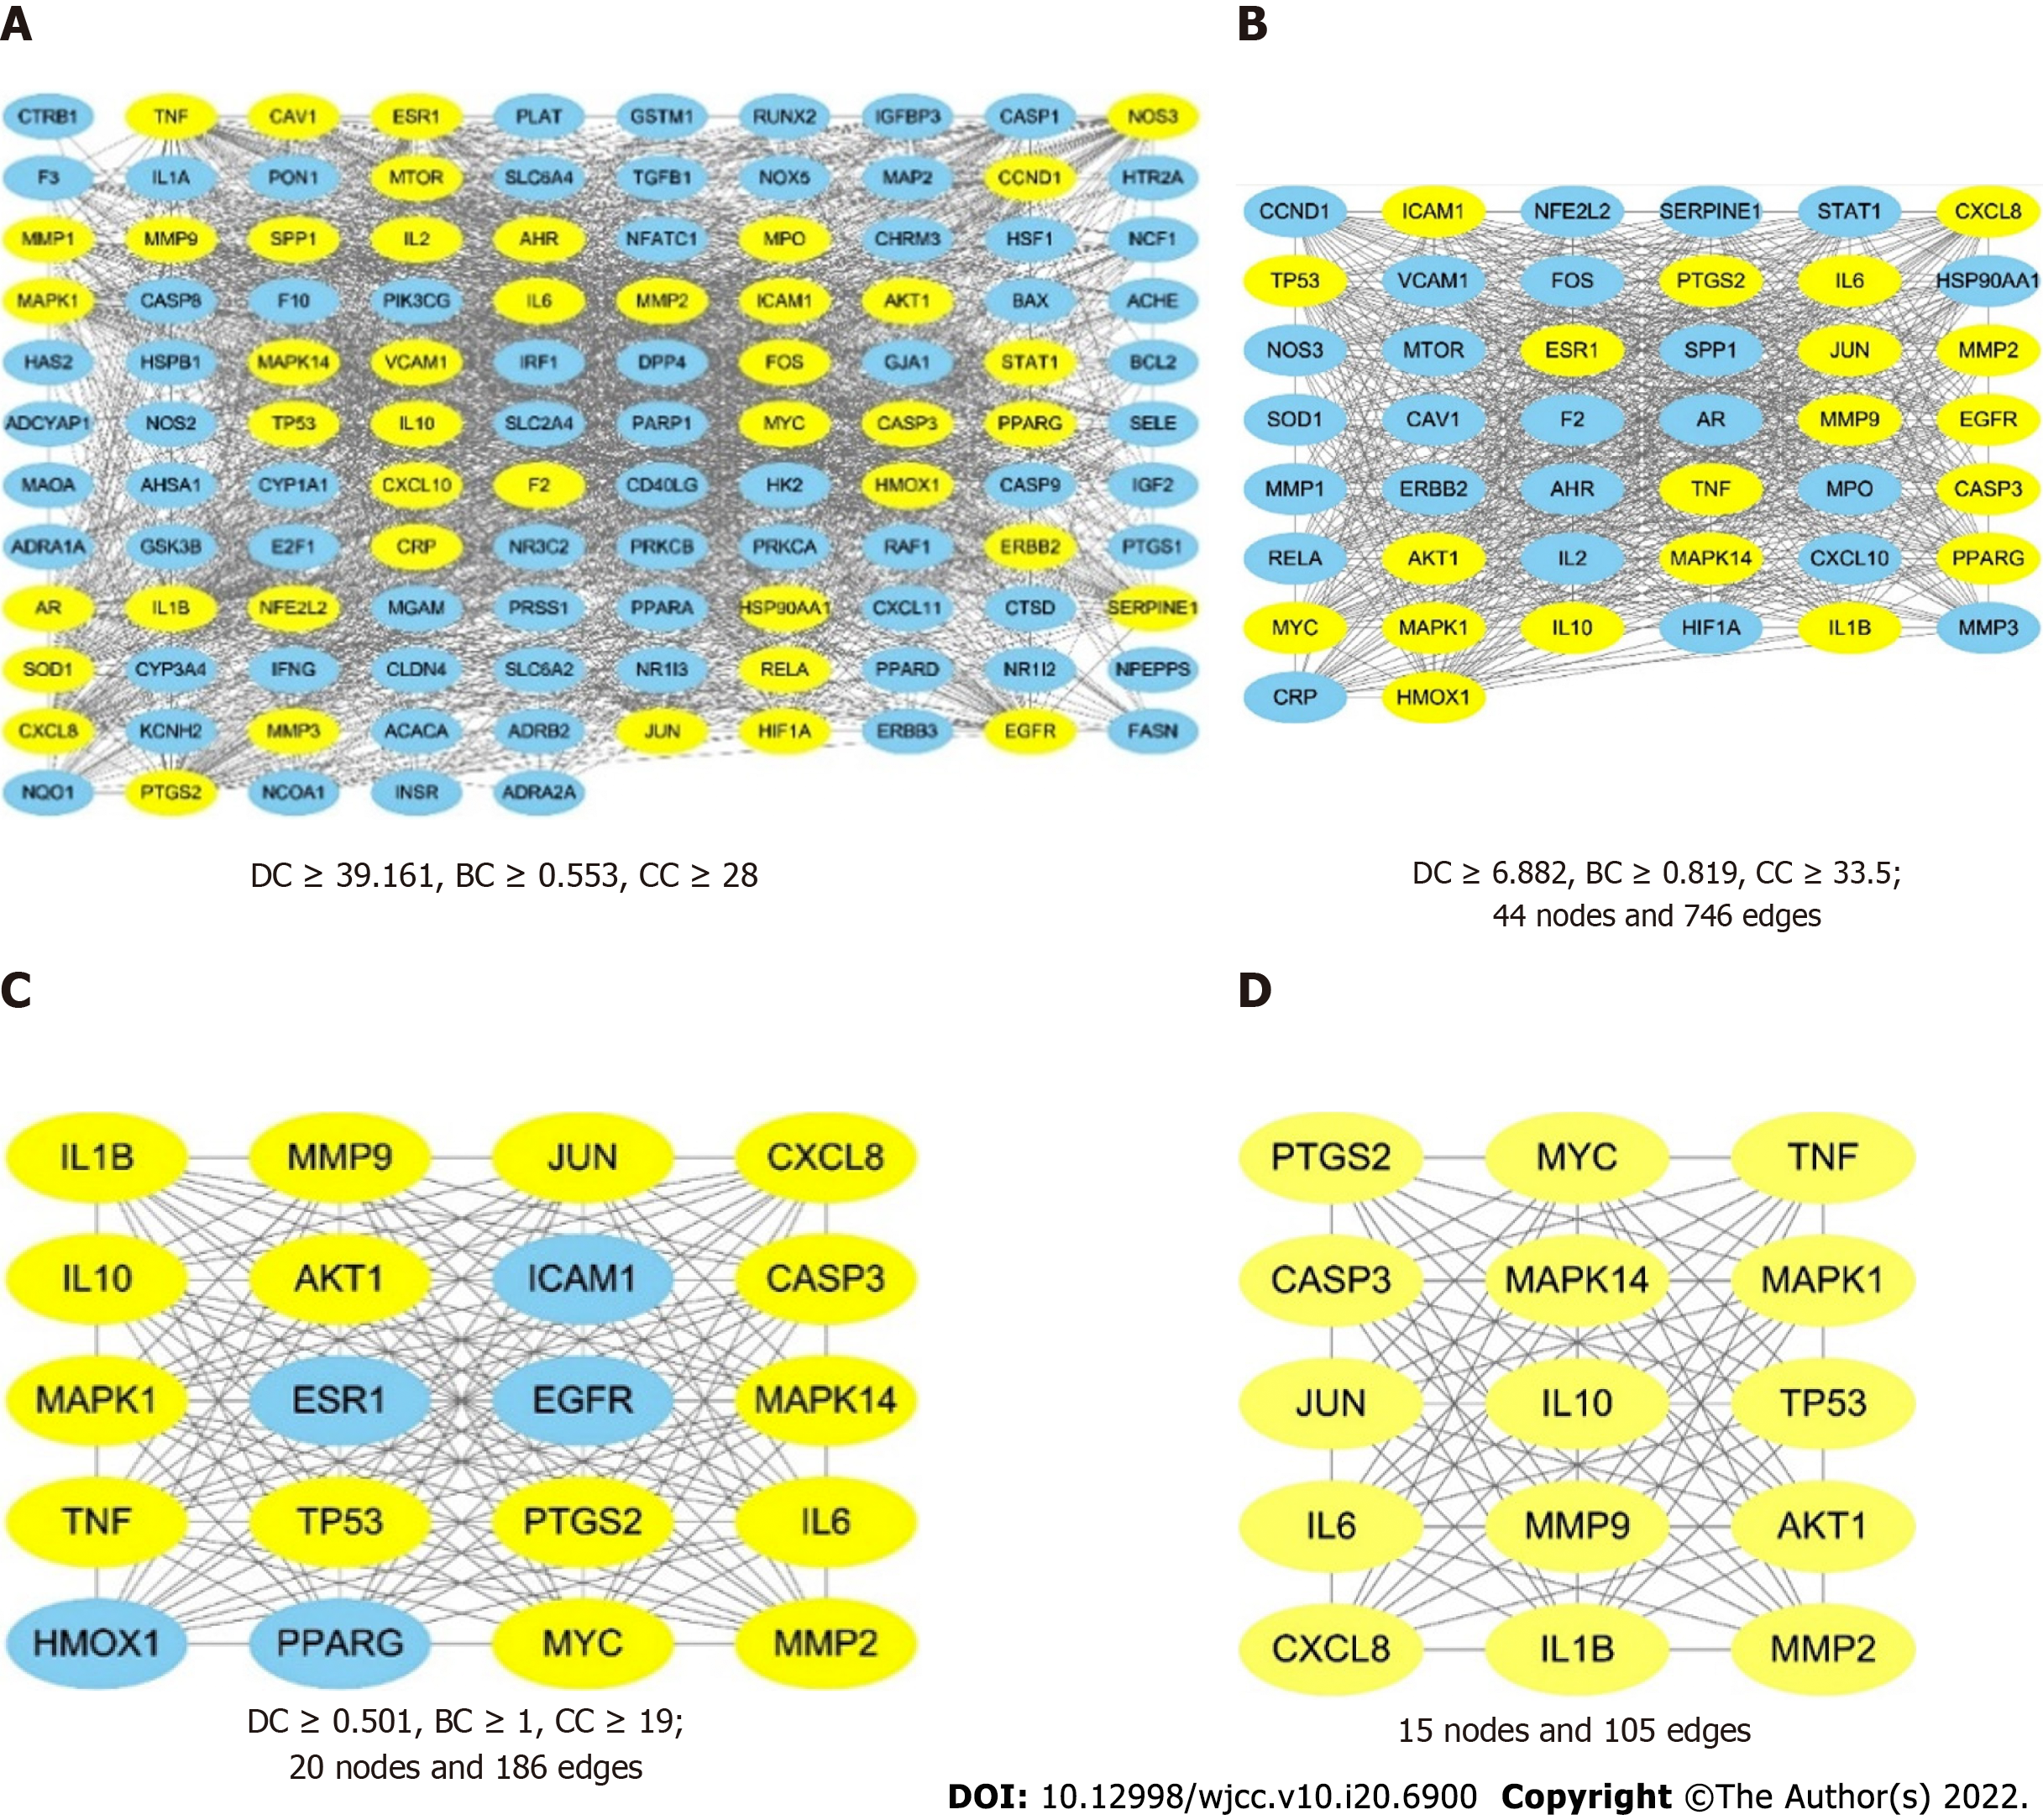
Figure 5 The process of topological screening for the protein-protein interaction network.
The yellow nodes represent the core targets and the blue nodes represent the noncore targets. A: The combined protein-protein interaction (PPI) network of the overlapping targets; B: PPI network with important targets extracted from (A); C: PPI network with important targets extracted from (B); D: PPI network with core targets extracted from (C).
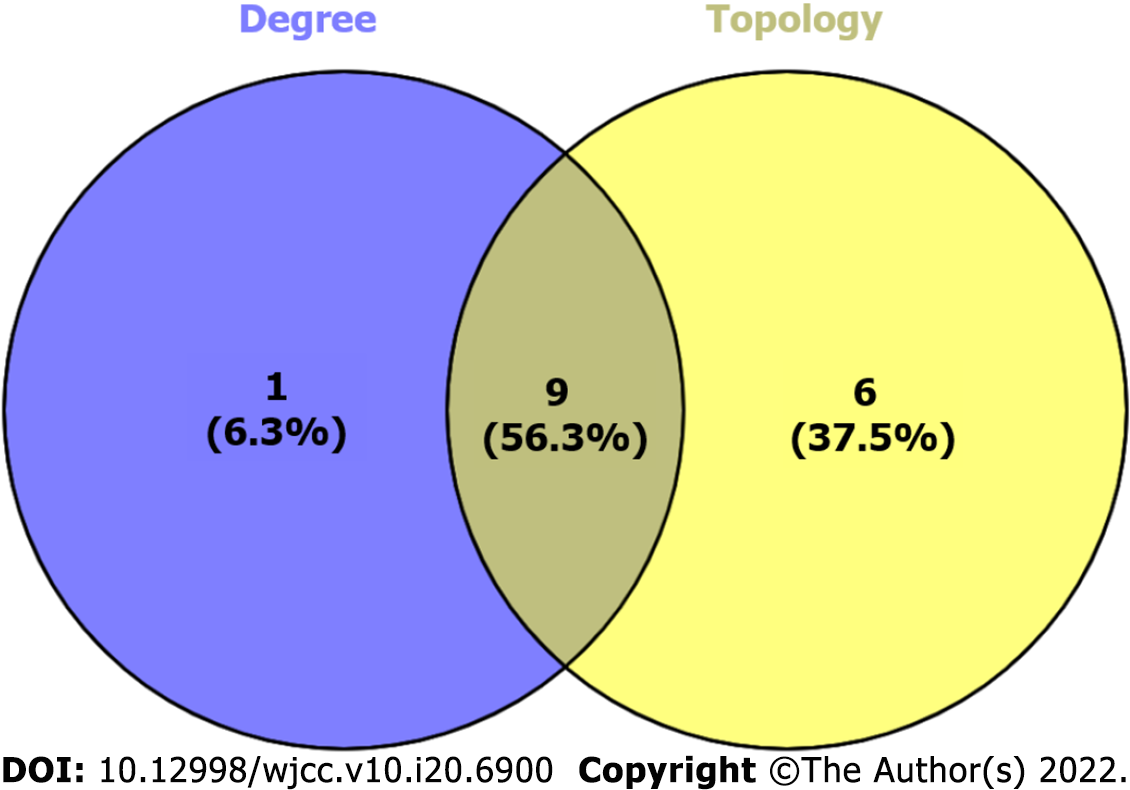
Figure 6 The Venn diagram of cytoHubba and CytoNCA-related targets.
1 cytoHubba non-intersection targets (left), 9 cytoHubba and CytoNCA intersection targets (middle) and 6 CytoNCA non-intersection targets (right).
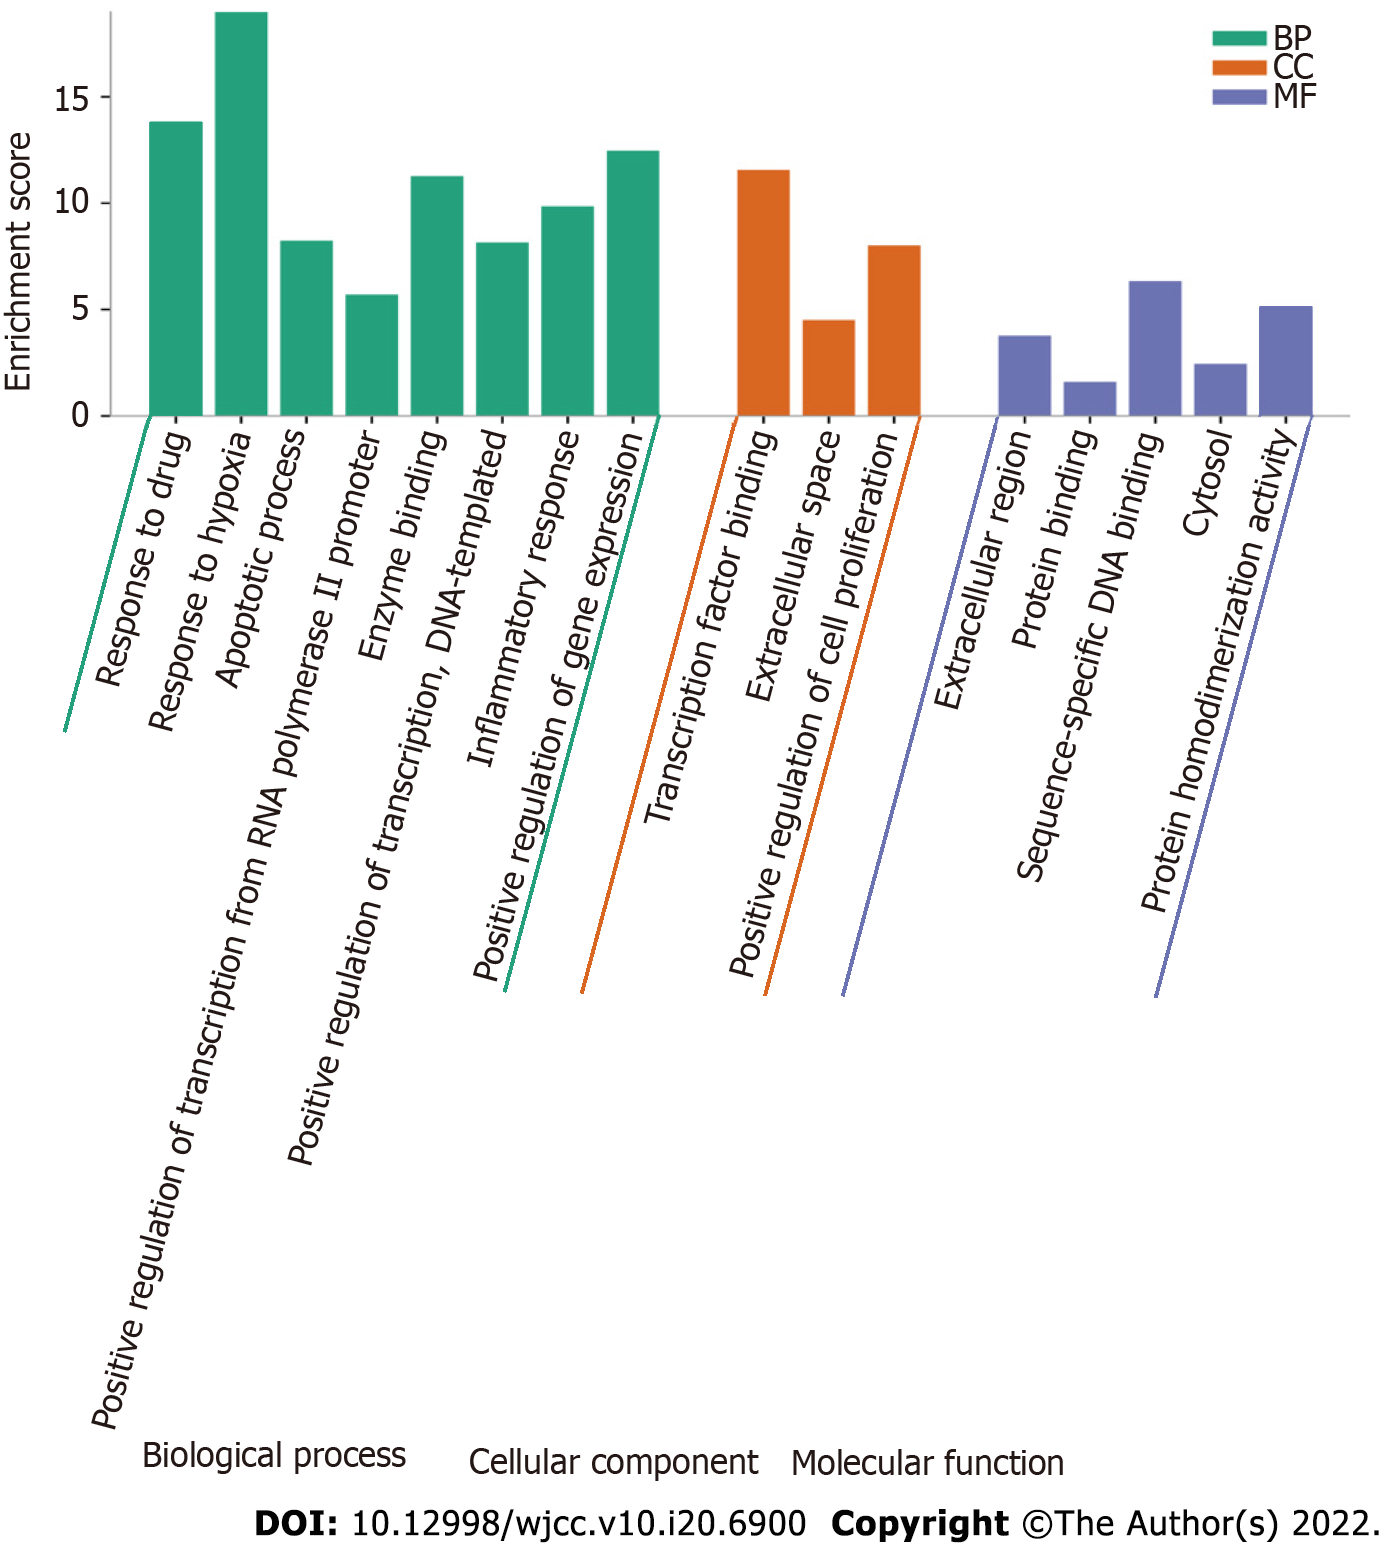
Figure 7 Gene Ontology enrichment analysis of 115 overlapping genes.
The top Gene Ontology enriched terms with P < 0.001 and count > 5 were screened. The X-axis is the enrichment gene ratio, and the Y-axis is the molecular function or biological process. CC: Cellular component; BP: Biological process; MF: Molecular function.
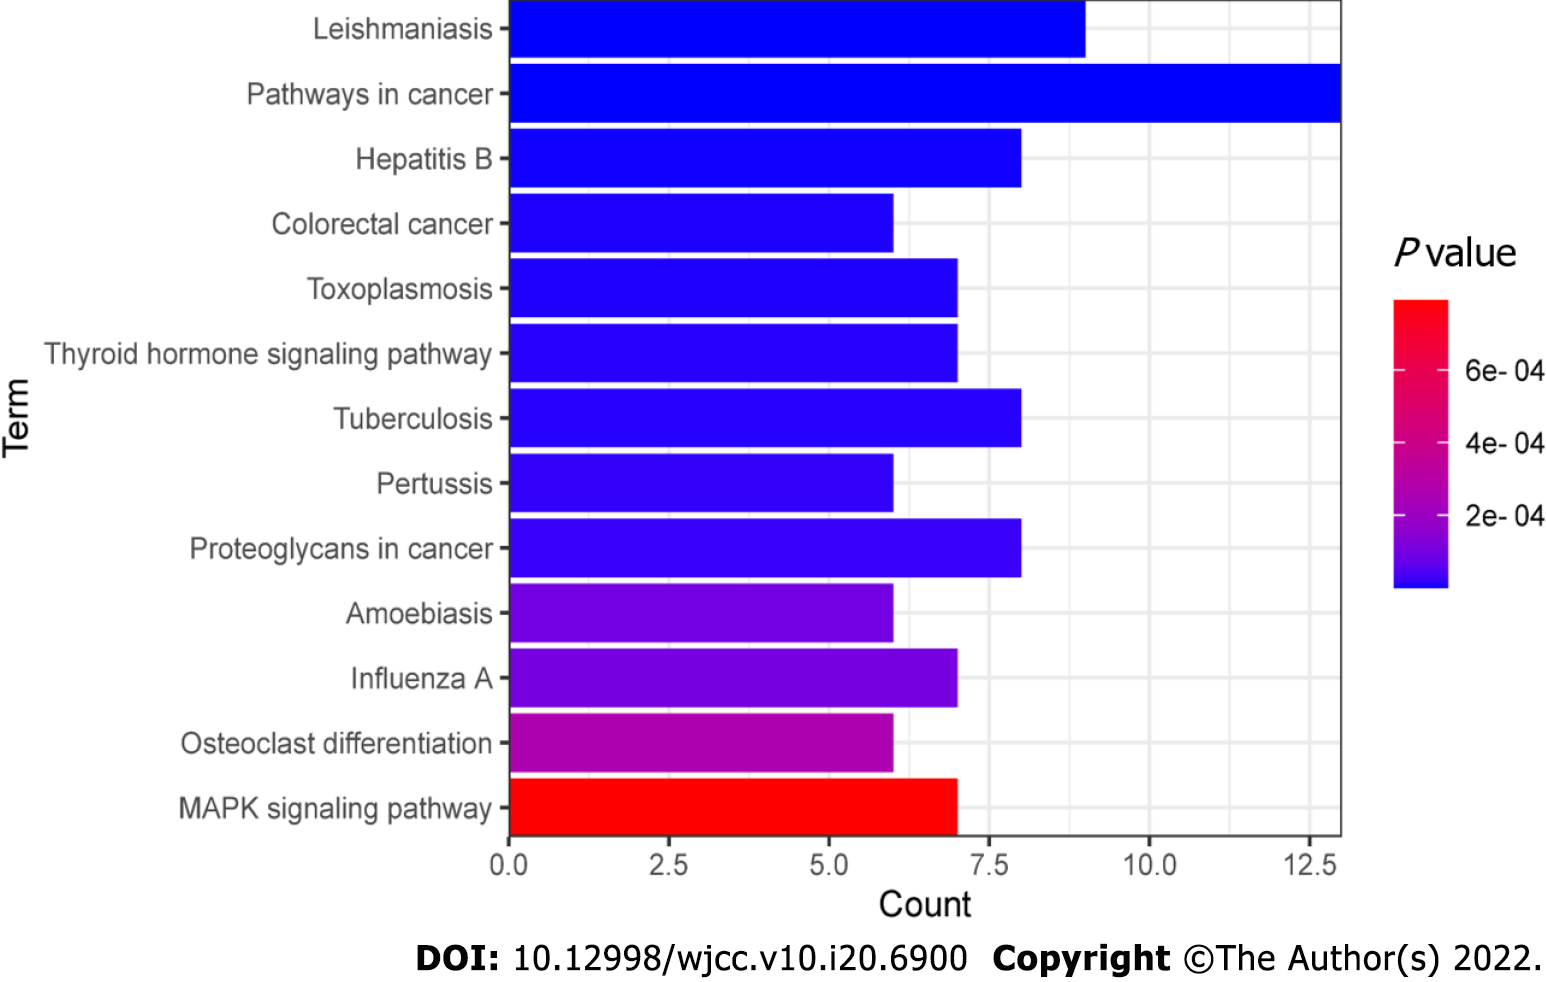
Figure 8 Kyoto encyclopedia of genes and genomes pathway enrichment analysis of 115 overlapping genes.
P < 0.001 and count > 5. The X-axis is the enrichment gene count, the Y-axis is the Kyoto Encyclopedia of Genes and Genomes pathway, and the color of bar chart represents the adjusted P value.
- Citation: Cui XY, Wu X, Lu D, Wang D. Network pharmacology-based strategy for predicting therapy targets of Sanqi and Huangjing in diabetes mellitus. World J Clin Cases 2022; 10(20): 6900-6914
- URL: https://www.wjgnet.com/2307-8960/full/v10/i20/6900.htm
- DOI: https://dx.doi.org/10.12998/wjcc.v10.i20.6900


