Copyright
©The Author(s) 2022.
World J Clin Cases. Jul 16, 2022; 10(20): 6876-6889
Published online Jul 16, 2022. doi: 10.12998/wjcc.v10.i20.6876
Published online Jul 16, 2022. doi: 10.12998/wjcc.v10.i20.6876
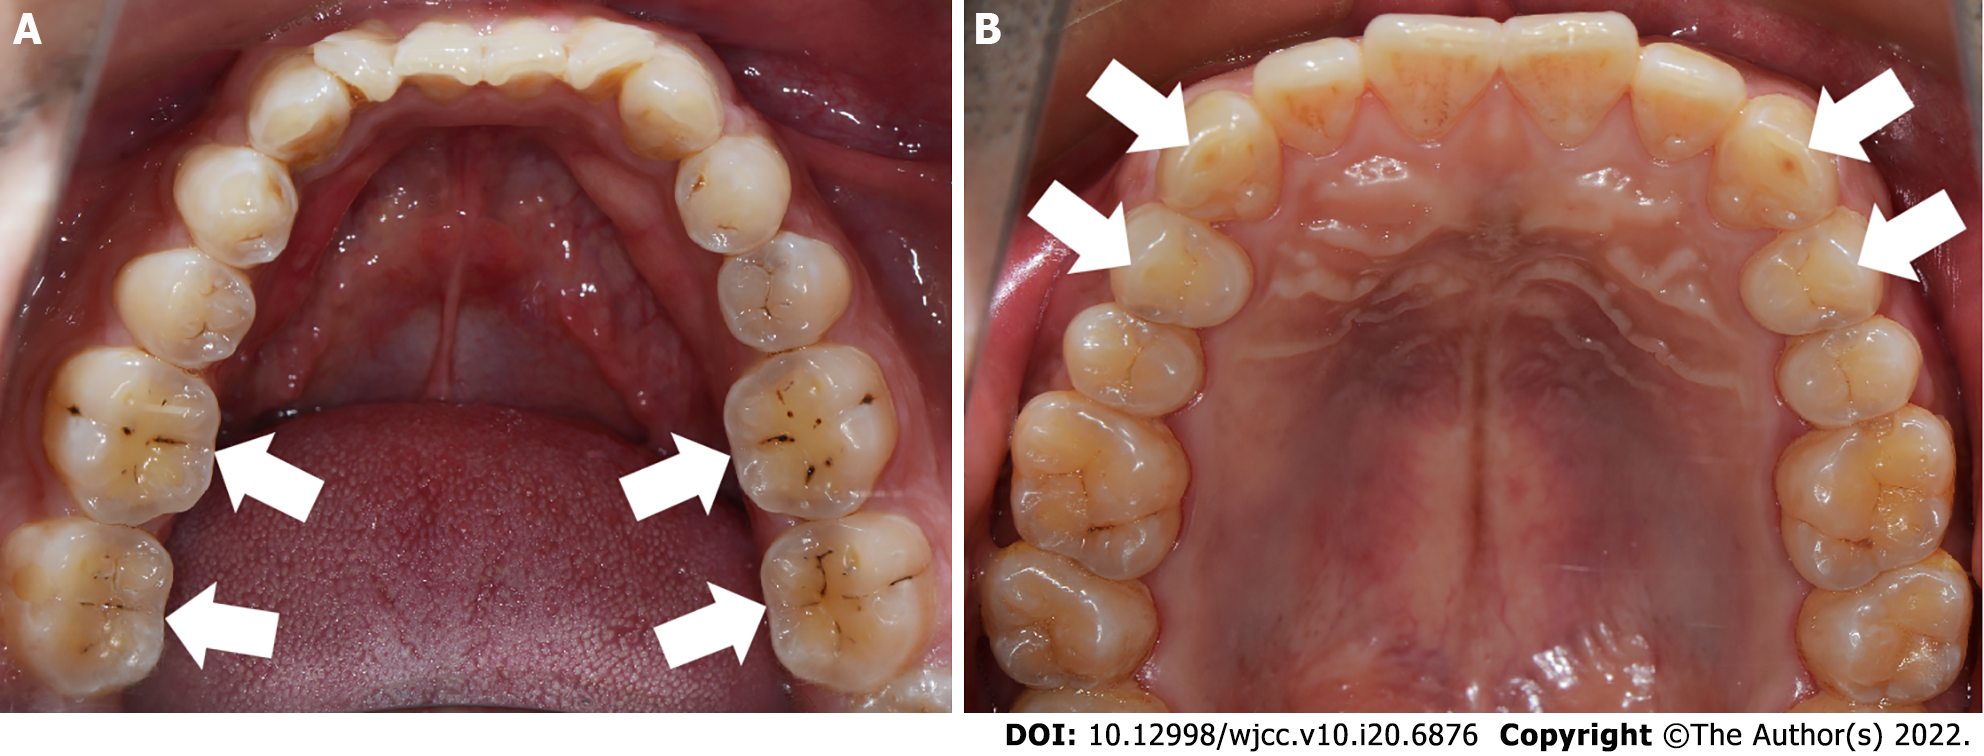
Figure 1 Tooth wear characteristics of patients with different types of bruxism.
A: "Cup"-shaped tooth wear in the central fossa of the posterior teeth in a patient with centric bruxism; B: Horizontal tooth wear associated with the canine and guide cusps of the posterior teeth in a patient with eccentric bruxism. White arrows indicate sites of wear.
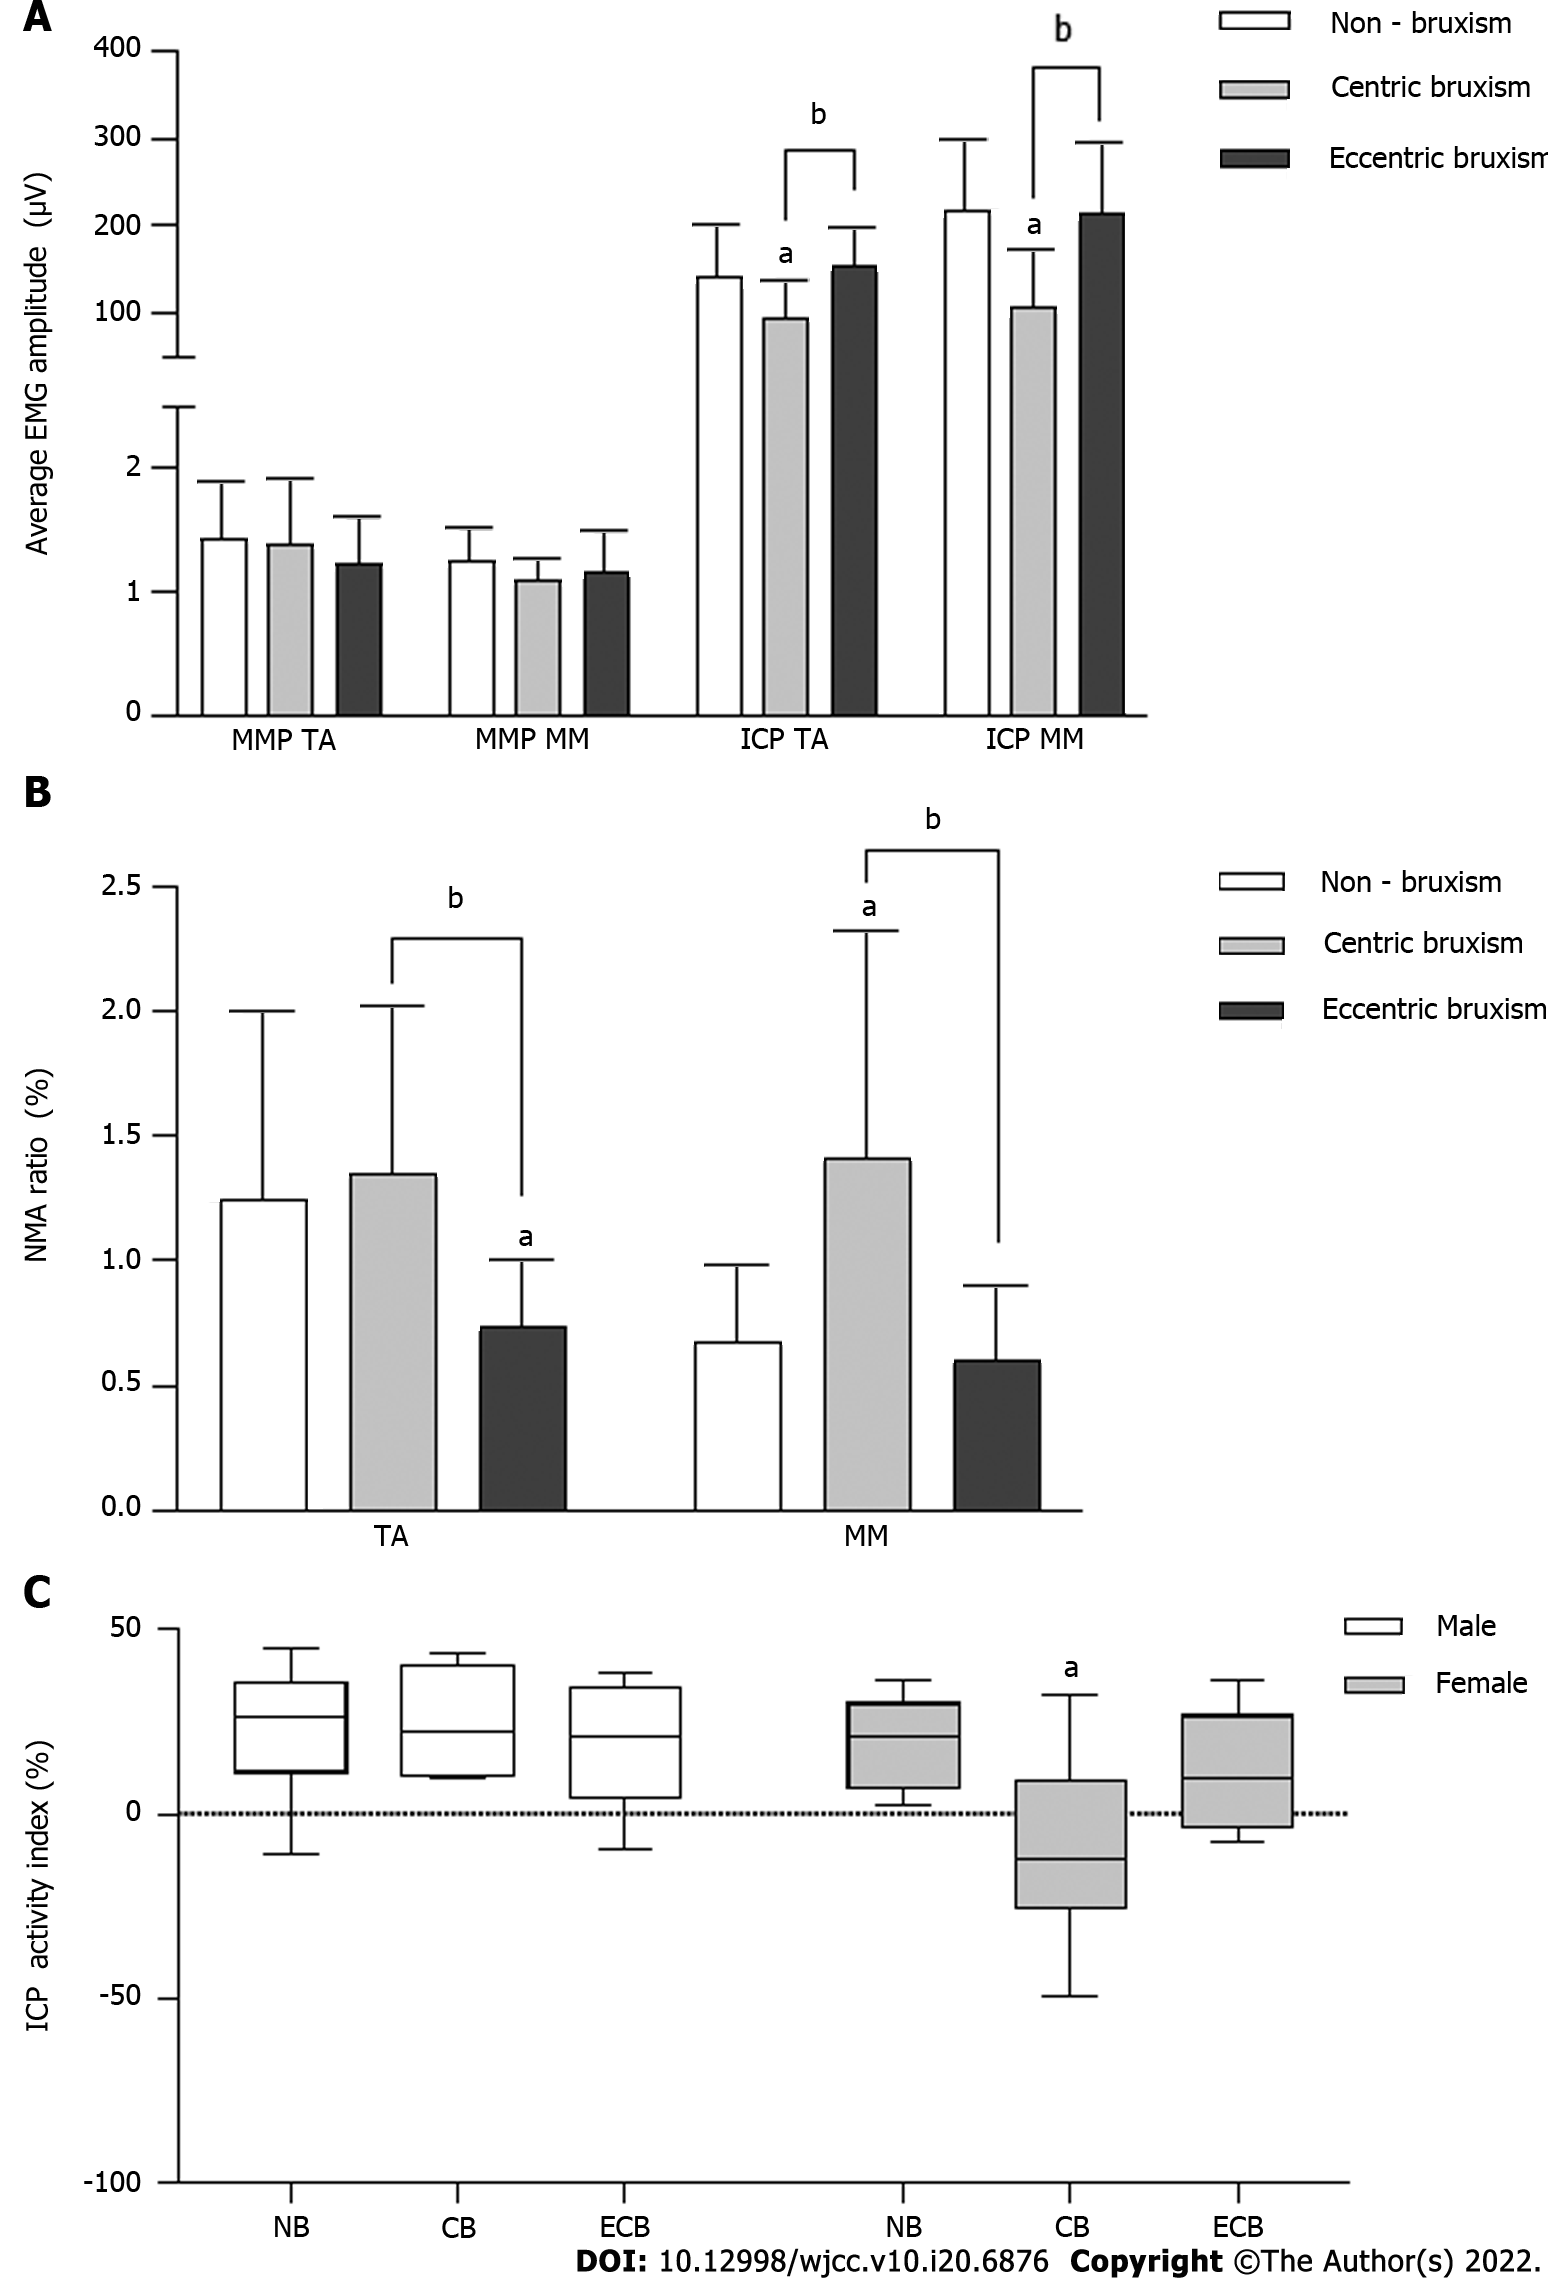
Figure 2 Comparison of the electromyography activity (mean ± SD) of the temporalis anterior and masseter muscle in the mandibular postural position and the intercuspal position maximal voluntary clenching.
A: Comparison of the average electromyography amplitudes in the mandibular postural position and intercuspal position maximal voluntary clenching; B: Comparison of the normalized muscle activity ratio in the mandibular postural position; C: Comparison of the intercuspal position activity index. aComparison to the NB group, P < 0.05; bComparison to the CB group, P < 0.05. CB: Centric bruxism; ECB: Eccentric bruxism; NB: Non-bruxism; TA: Temporalis anterior; MM: Masseter muscle; NMA: Normalized muscle activity.
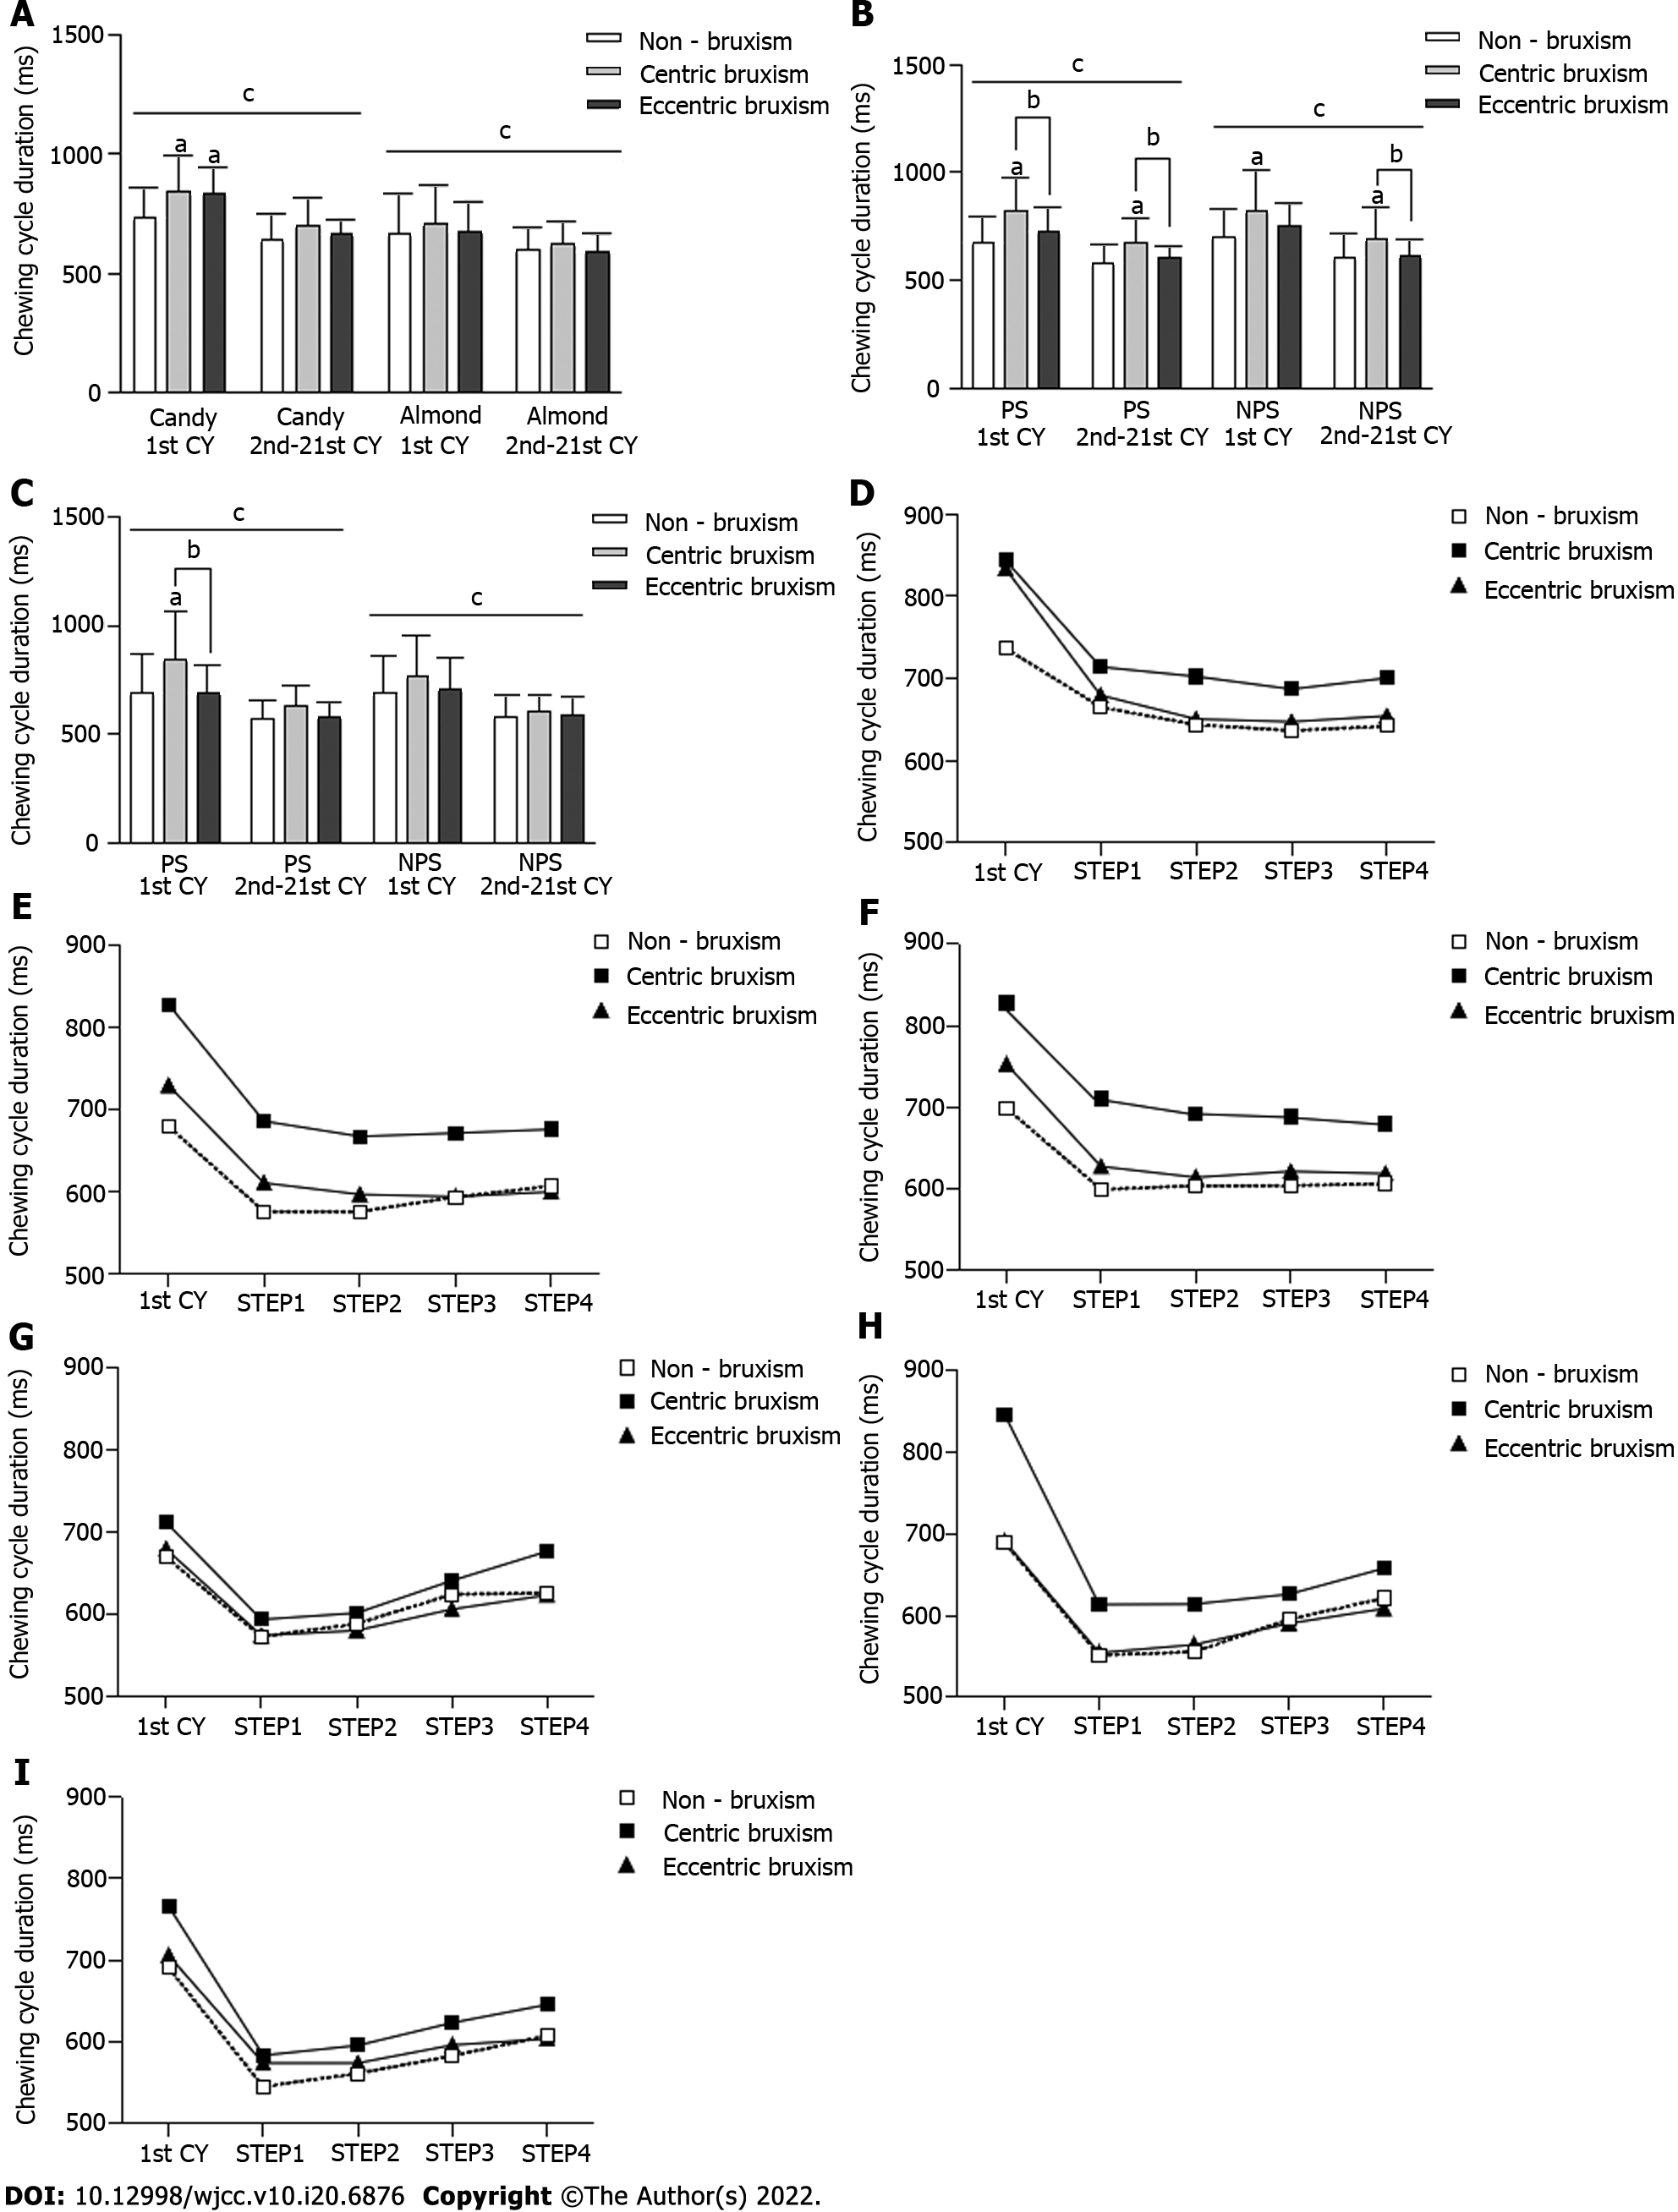
Figure 3 Comparison of the average duration (mean ± SD) of the chewing cycle.
A: Comparison of the duration of the chewing cycle for free chewing of food; B: Comparison of the duration of the chewing cycle for unilateral chewing of candy; C: Comparison of the duration of the chewing cycle for unilateral chewing of almond; D: Free chewing candy process; E: Unilateral chewing candy process on the preferred side (PS); F: Unilateral chewing candy process on the non-preferred side (NPS); G: Free chewing almond process; H: Unilateral chewing almond process on the PS; I: Unilateral chewing almond process on the NPS. aComparison to the non-bruxism group, P < 0.05; bComparison to the centric bruxism group, P <0.05; cComparison of the duration of the first chewing cycle and the subsequent total 20 chewing cycles within each group, P < 0.05. CB: Centric bruxism; ECB: Eccentric bruxism; NB: Non-bruxism; CY: Chewing cycle.
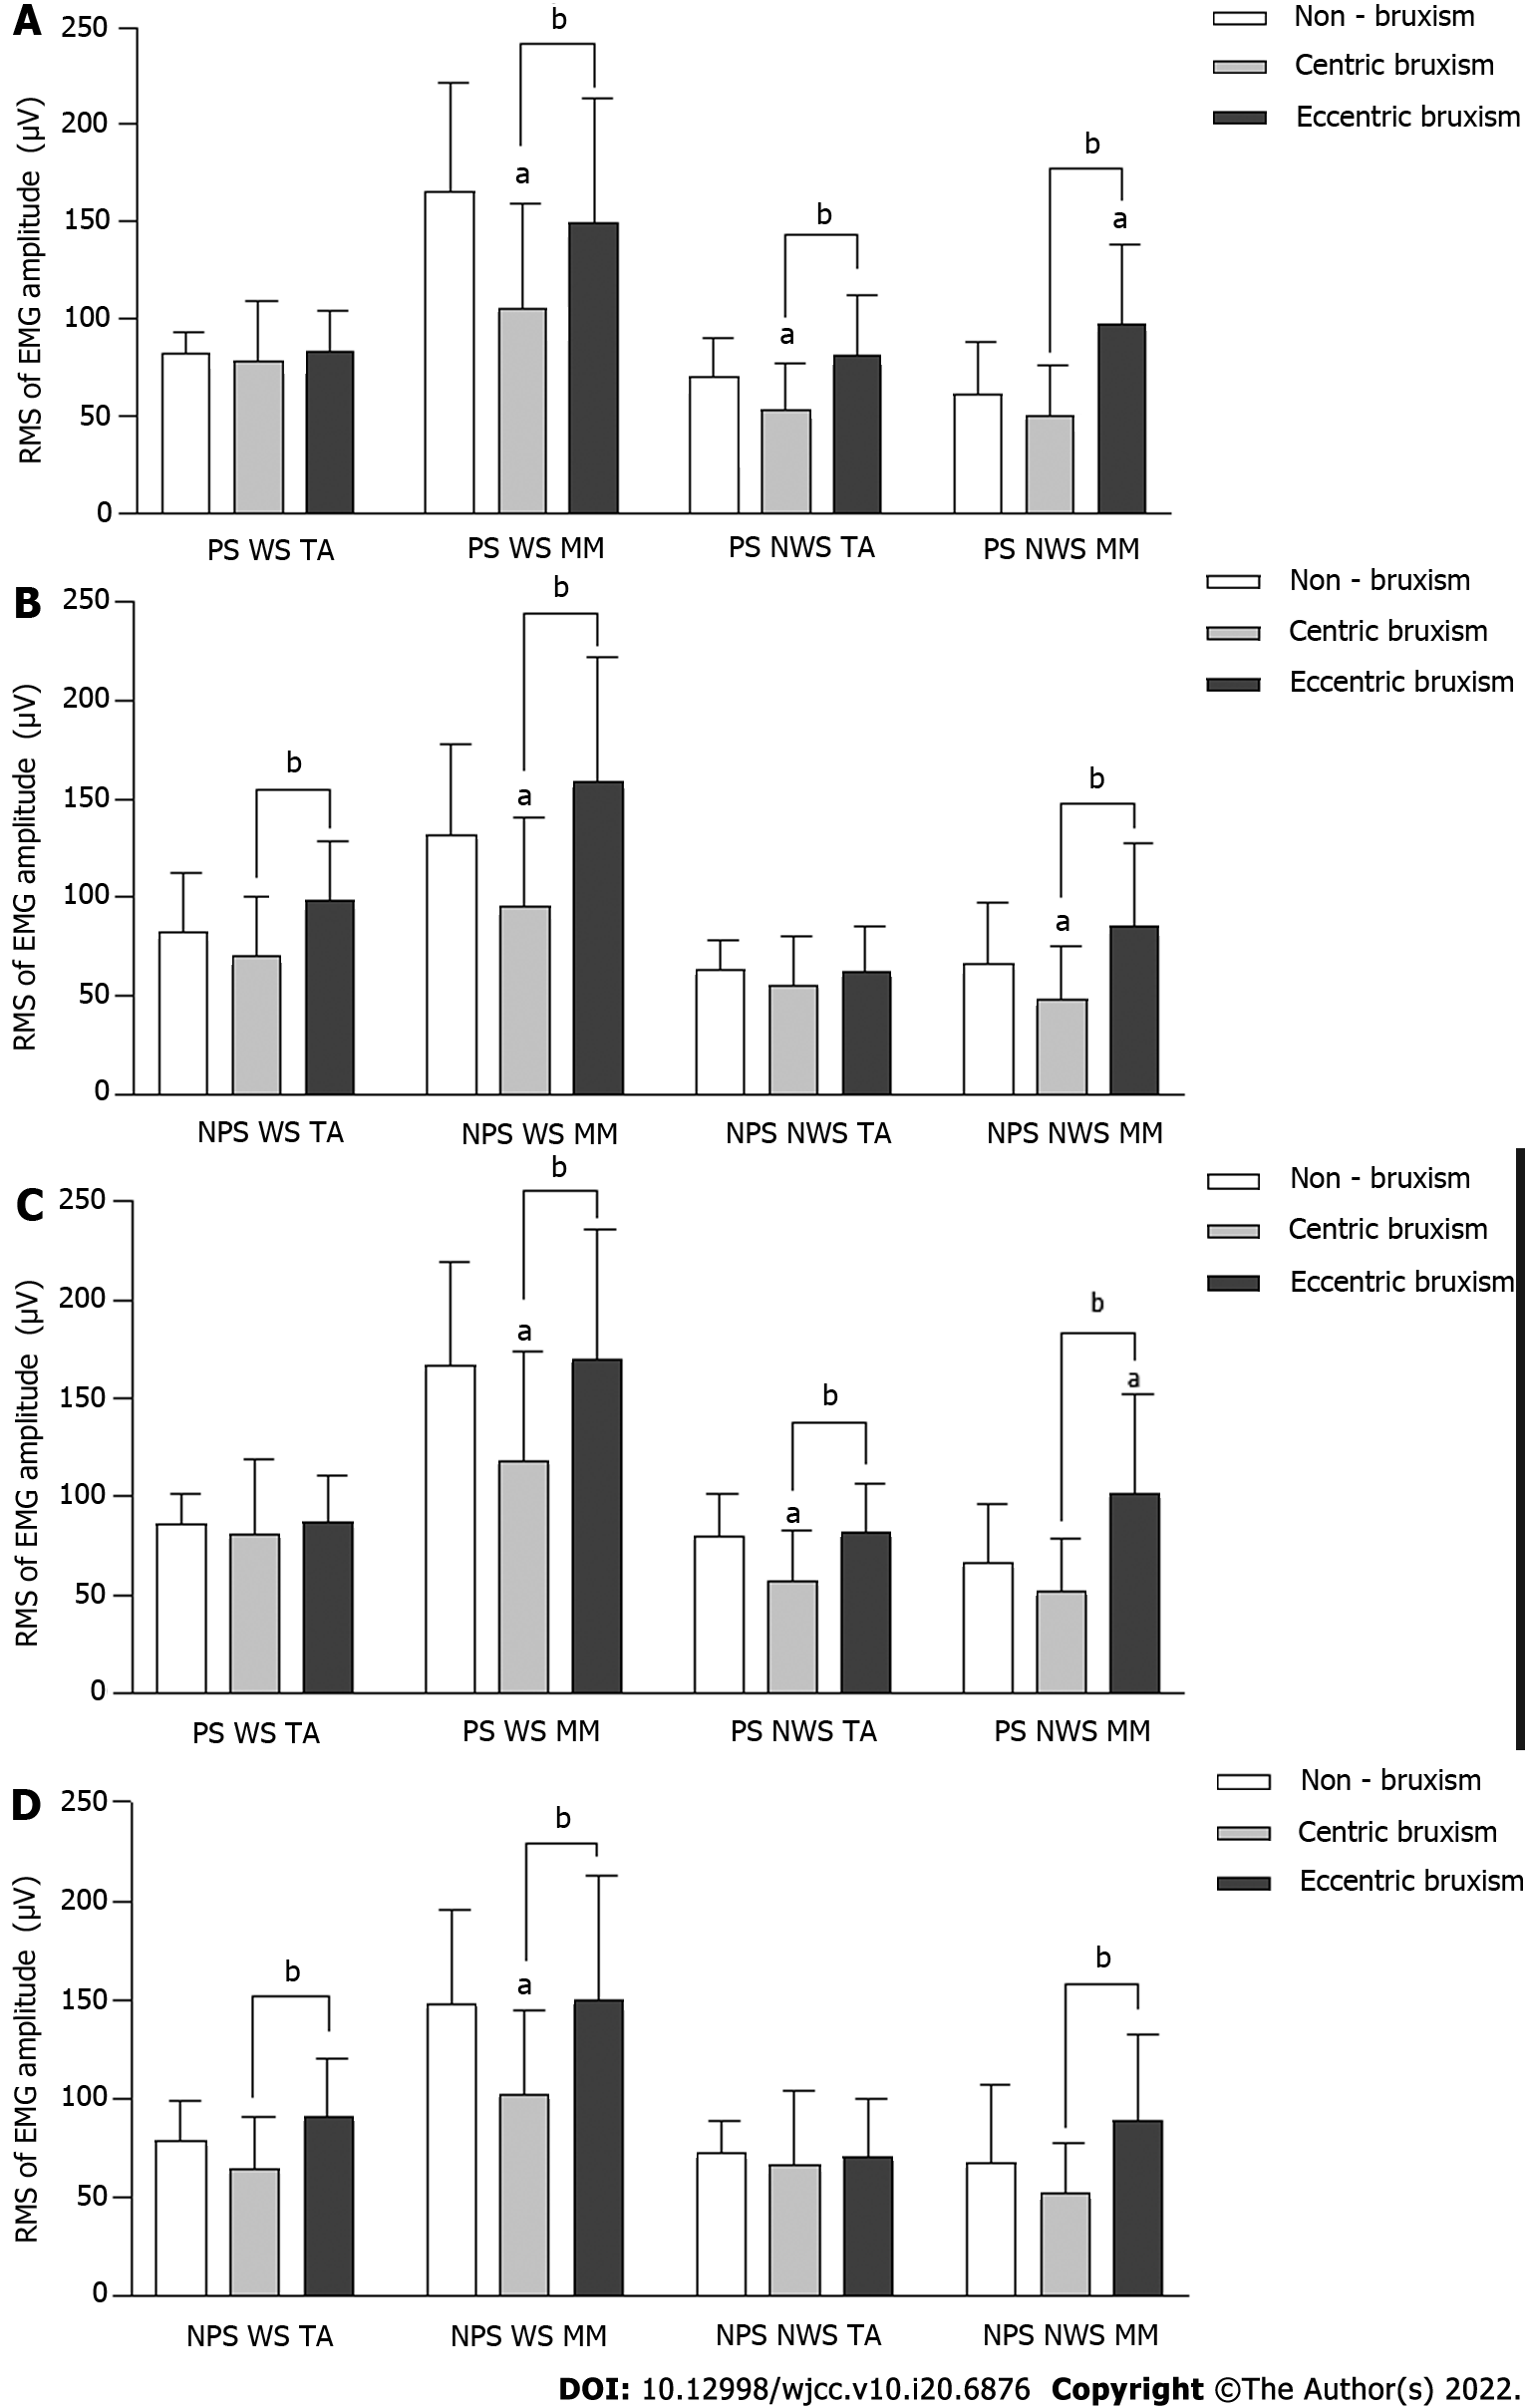
Figure 4 Comparison of the electromyography activity (mean ± SD) during unilateral chewing.
A: Comparison of the root mean square (RMS) of electromyography amplitudes of unilateral chewing of candy on the preferred side (PS); B: Comparison of the RMS of electromyography amplitudes of unilateral chewing of candy on the non-PS (NPS); C: Comparison of the RMS of electromyography (EMG) amplitudes of unilateral chewing of almond on the PS; D: Comparison of the RMS of EMG amplitudes of unilateral chewing of almond on the NPS. aComparison to the non-bruxism group, P < 0.05; bComparison to centric bruxism group, P < 0.05. WS: Working side; NWS: Non-working side; TA: Temporalis anterior; MM: Masseter muscle.
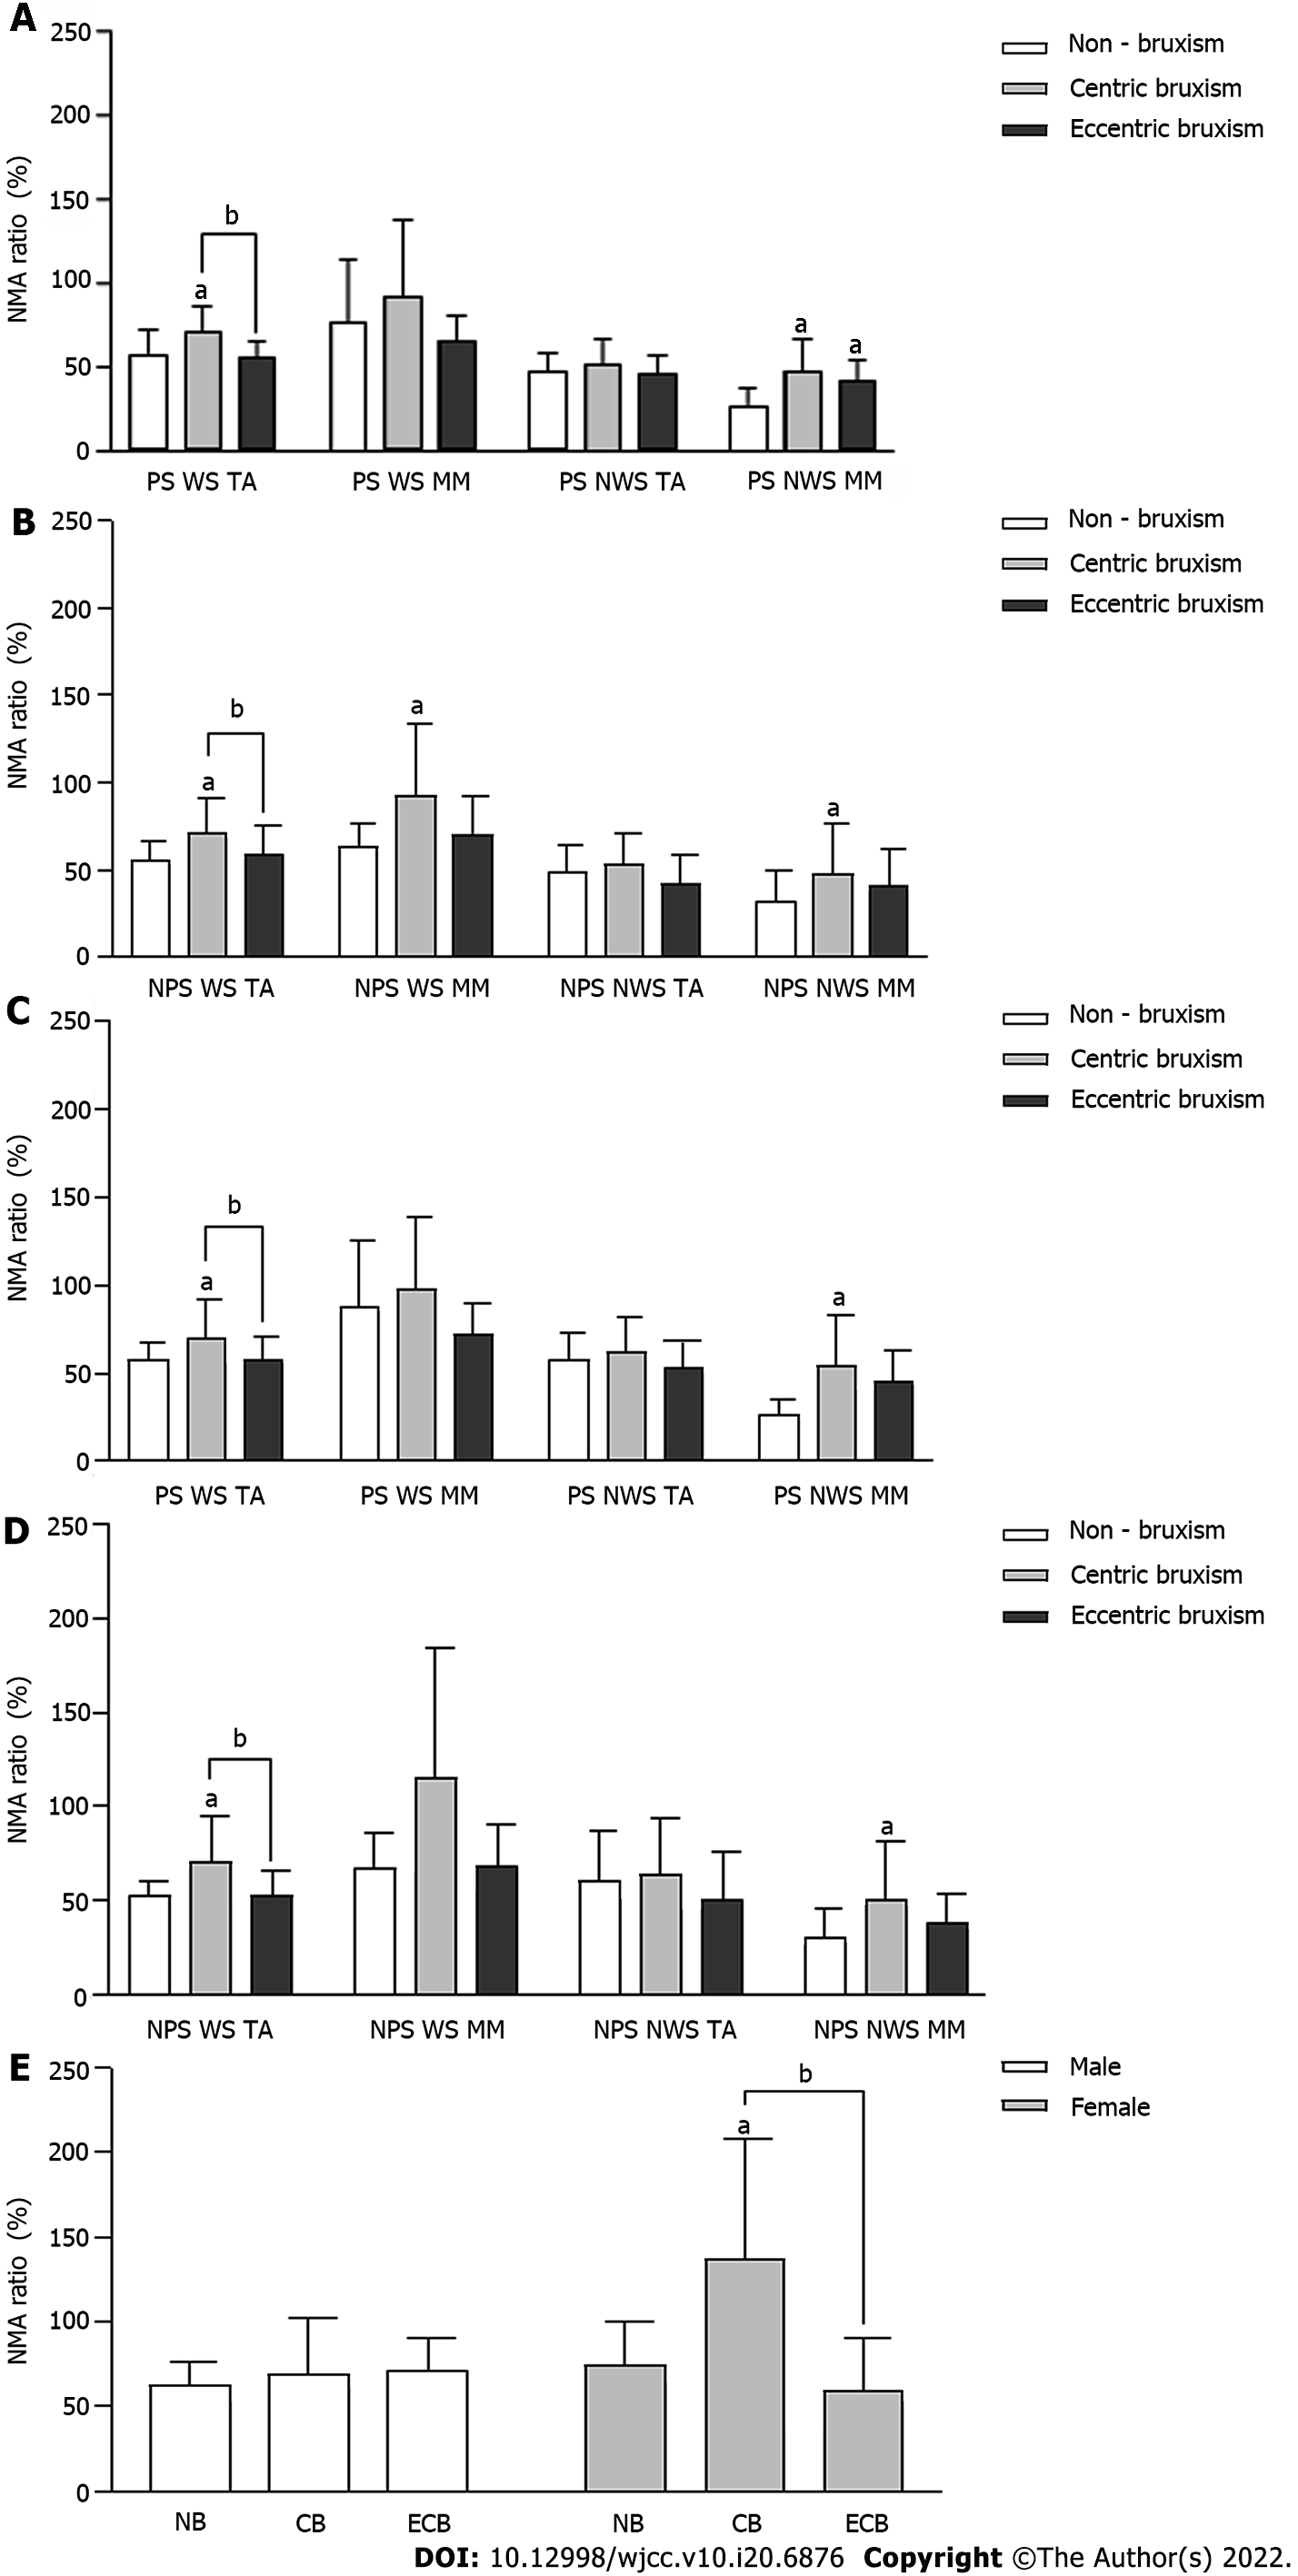
Figure 5 Comparison of the normalized muscle activity ratio (mean ± SD) during unilateral chewing.
A: Comparison of the normalized muscle activity (NMA) ratio during unilateral chewing of candy on the preferred side (PS); B: Comparison of the NMA ratio during unilateral chewing of candy on the non-PS (NPS); C: Comparison of the NMA ratio during unilateral chewing of almond on the PS; D: Comparison of the NMA ratio during unilateral chewing of almond on the NPS; E: Comparison of the masseter muscle NMA ratio on the working side of NPS unilateral chewing of almond. aComparison to the non-bruxism group, P < 0.05; bComparison to the centric bruxism group, P < 0.05. CB: Centric bruxism; ECB: Eccentric bruxism; NB: Non-bruxism; WS: Working side; NWS: Non-working side; TA: Temporalis anterior; MM: Masseter muscle.
- Citation: Lan KW, Jiang LL, Yan Y. Comparative study of surface electromyography of masticatory muscles in patients with different types of bruxism. World J Clin Cases 2022; 10(20): 6876-6889
- URL: https://www.wjgnet.com/2307-8960/full/v10/i20/6876.htm
- DOI: https://dx.doi.org/10.12998/wjcc.v10.i20.6876


