Copyright
©The Author(s) 2022.
World J Clin Cases. Jul 6, 2022; 10(19): 6563-6570
Published online Jul 6, 2022. doi: 10.12998/wjcc.v10.i19.6563
Published online Jul 6, 2022. doi: 10.12998/wjcc.v10.i19.6563
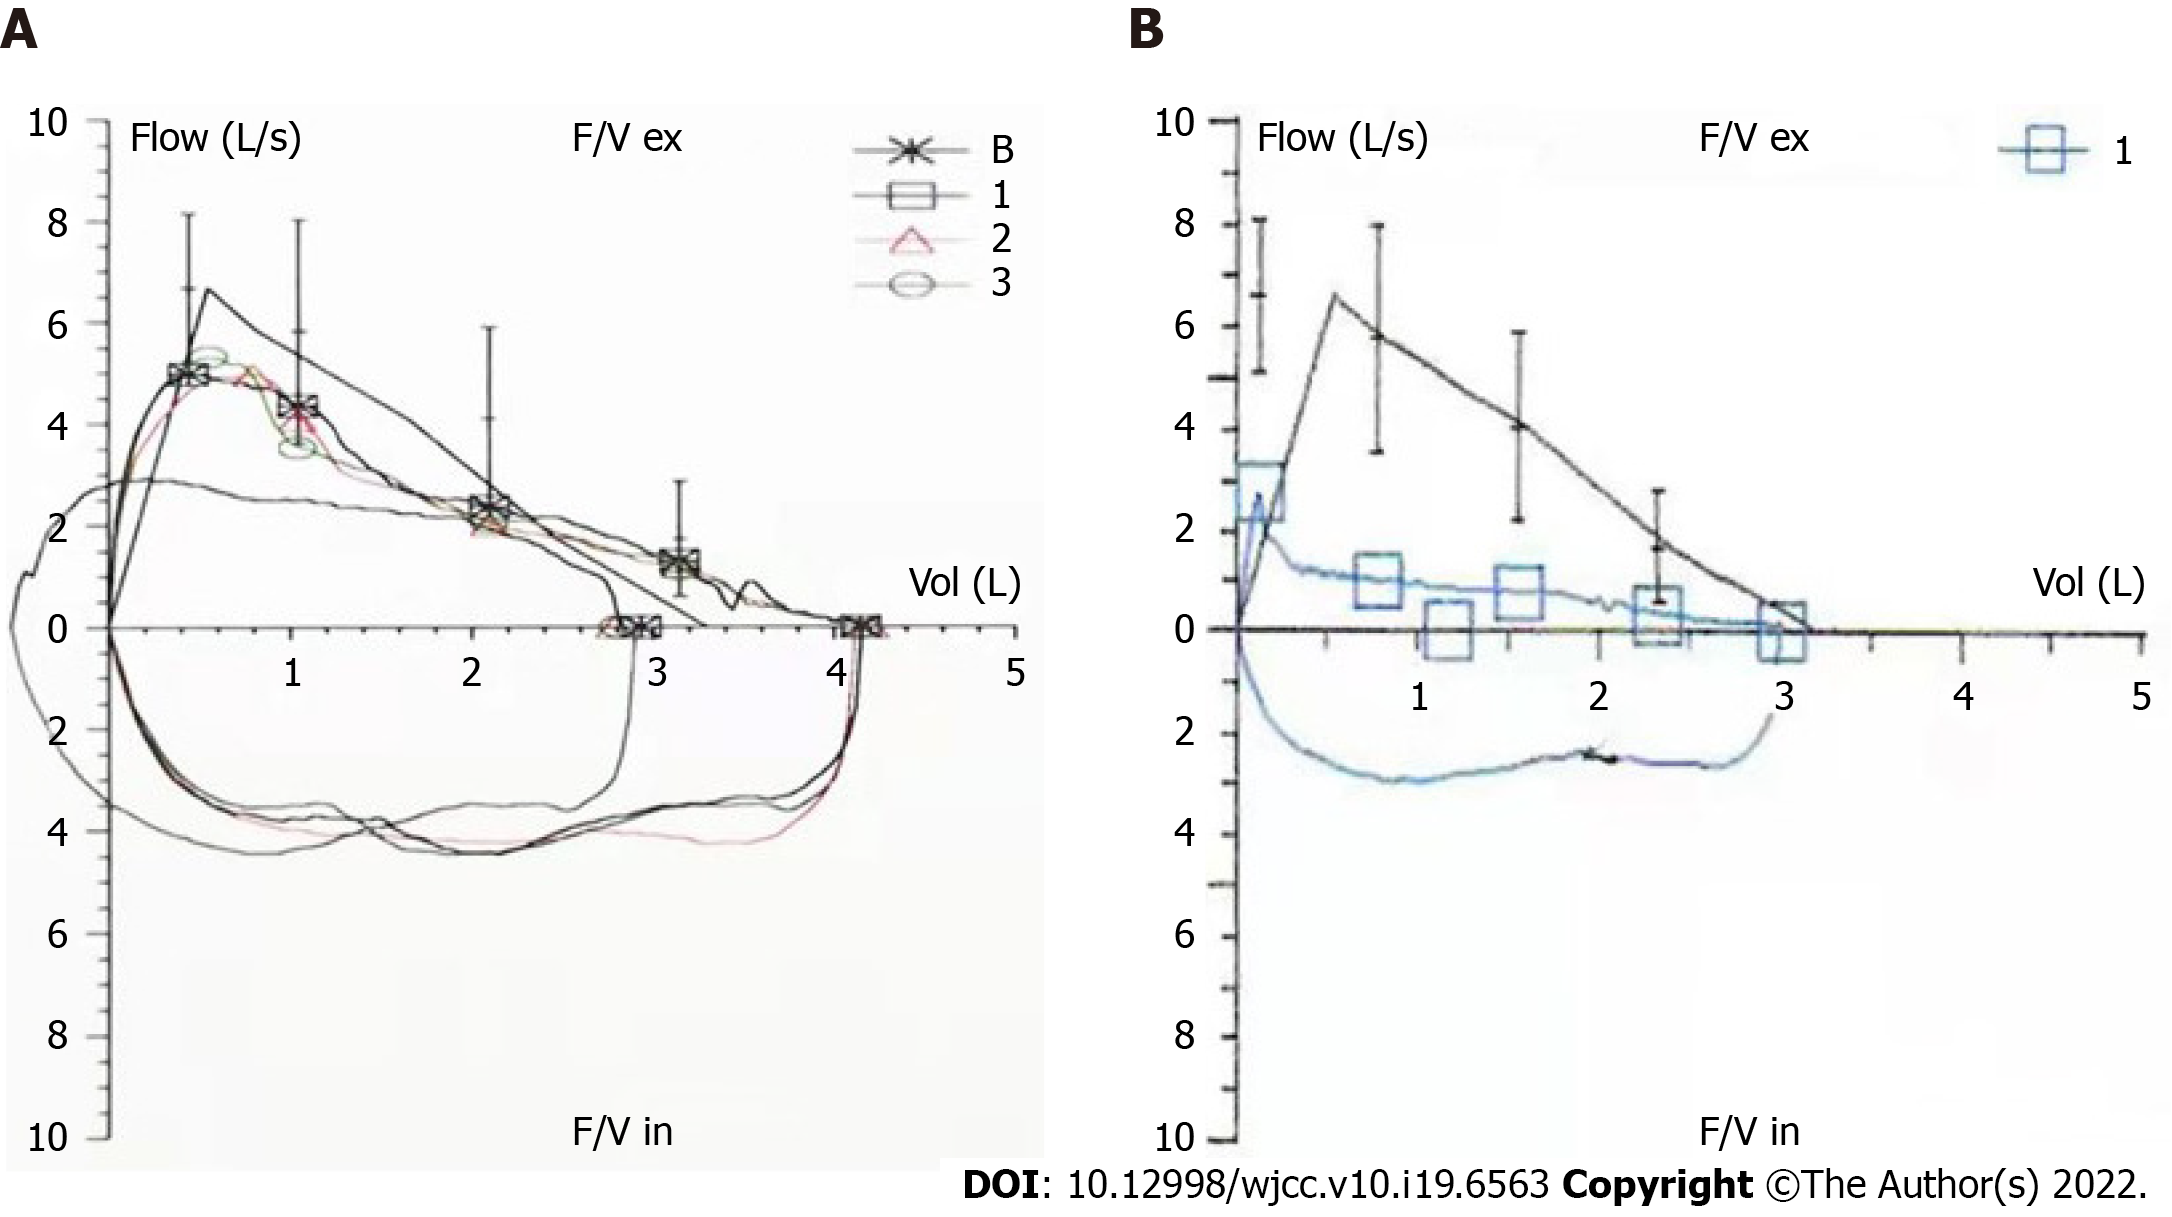
Figure 1 Respiratory function tests.
A: December, 2018; B: May, 2020. Compared with previous measurements, the expiratory flow was impaired and exhibited a platform-like change, suggestive of variable intrathoracic (upper airway) obstruction.
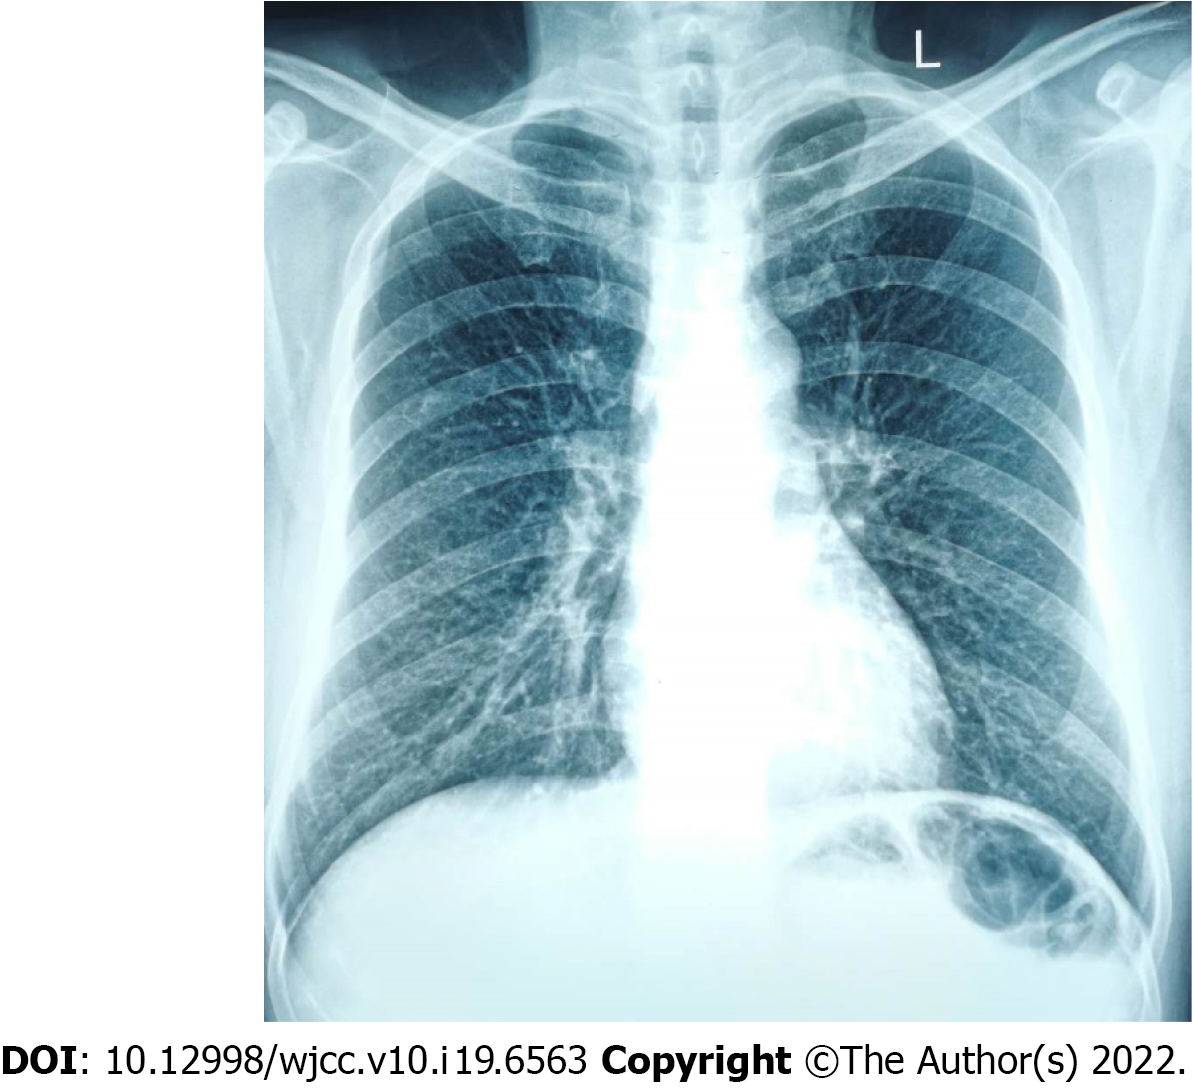
Figure 2 Chest X-ray.
The trachea is in the centre and the textures of both lungs are enhanced.
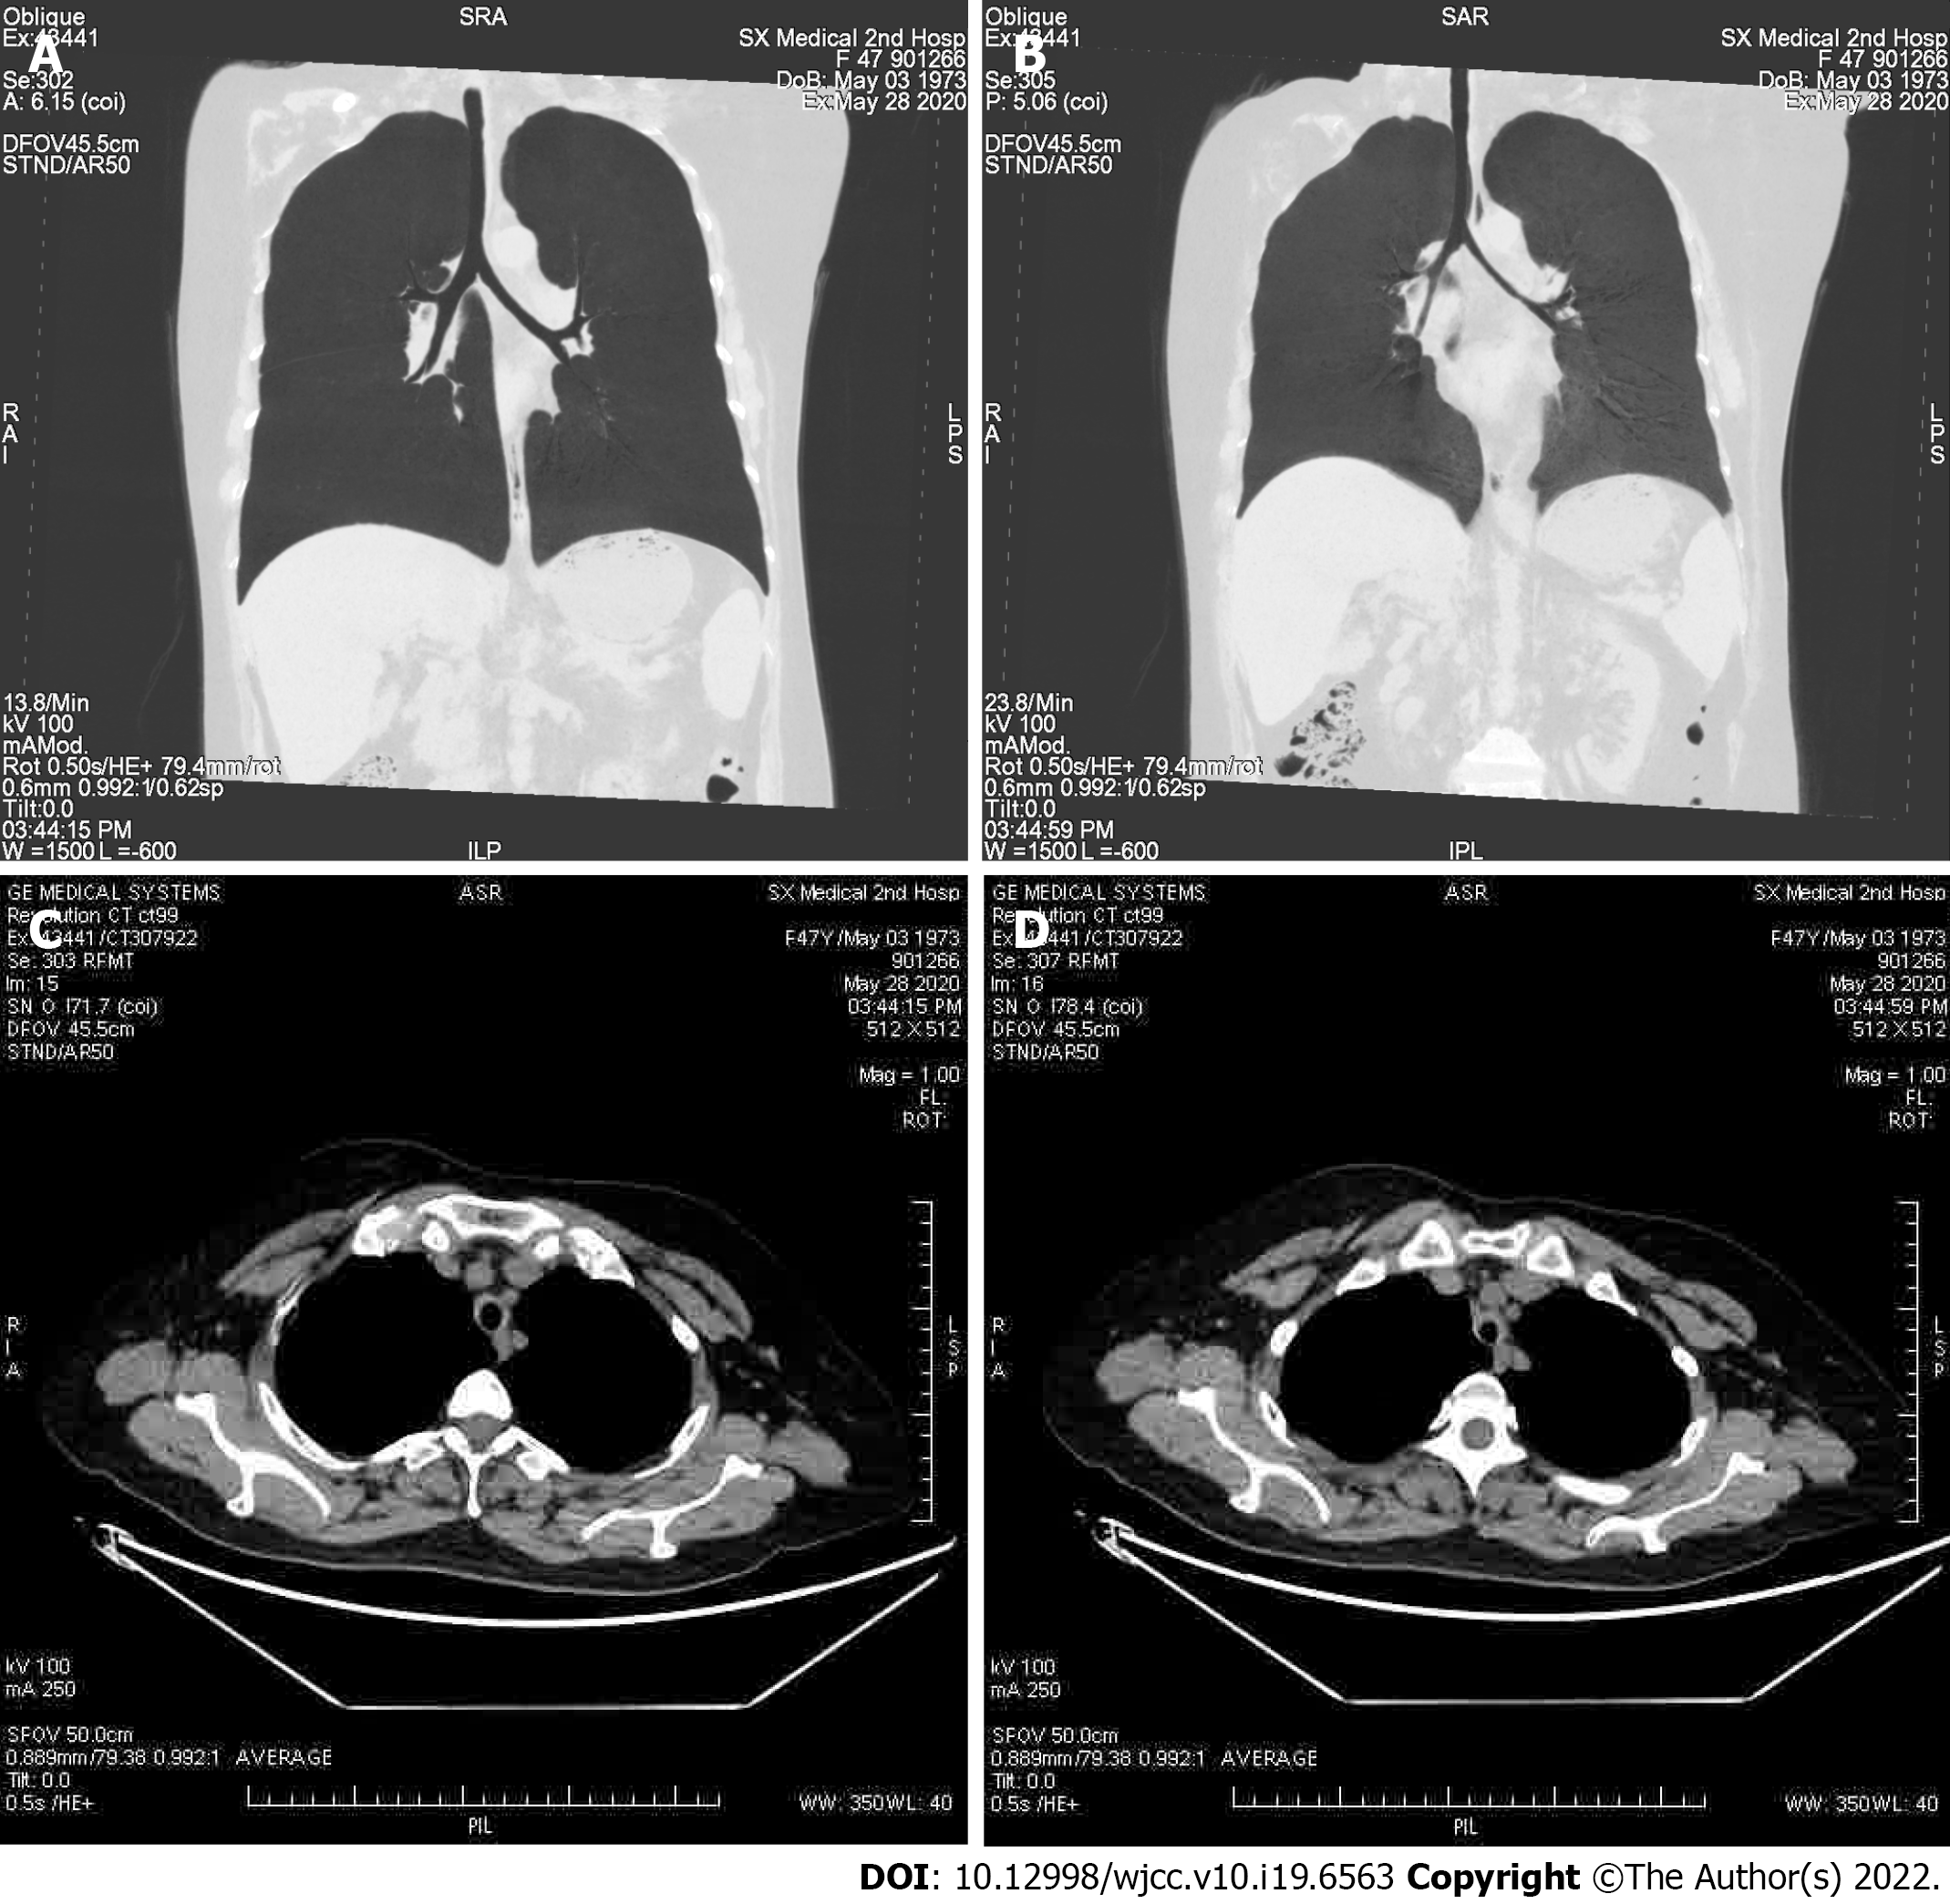
Figure 3 Computed tomography analysis.
A and B: The diameters of the trachea and bilateral bronchi show narrowing in the expiratory phase (B) compared to the inspiratory phase (A); C and D: The axial computed tomography image of mediastinal field for inspiration (C) and expiration (D).
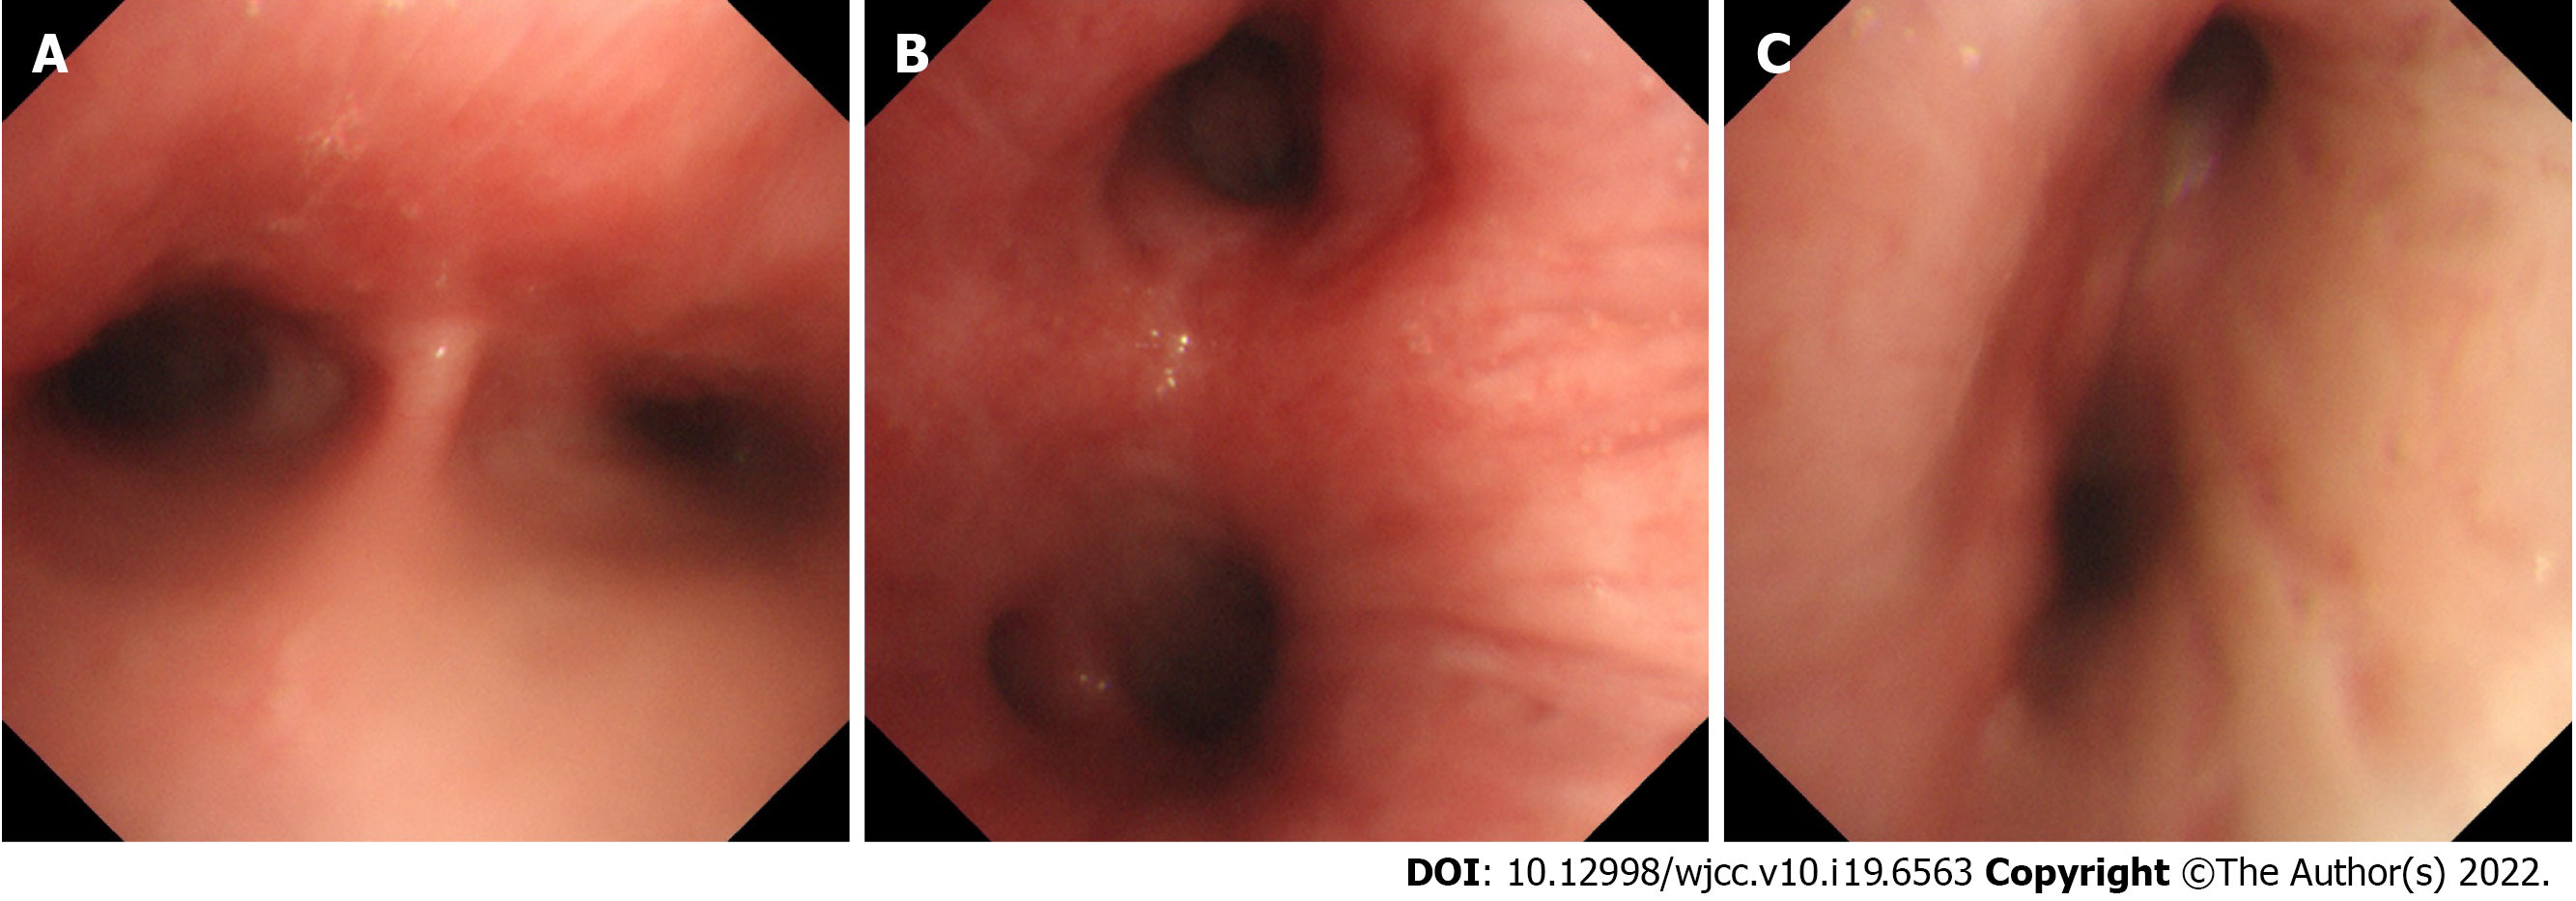
Figure 4 Bronchoscopy.
The tracheal cartilage ring appears blurred and the tracheal mucosa evidences swelling. A: Tracheal juga; B: Left principal bronchus; and C: Right primary bronchus.
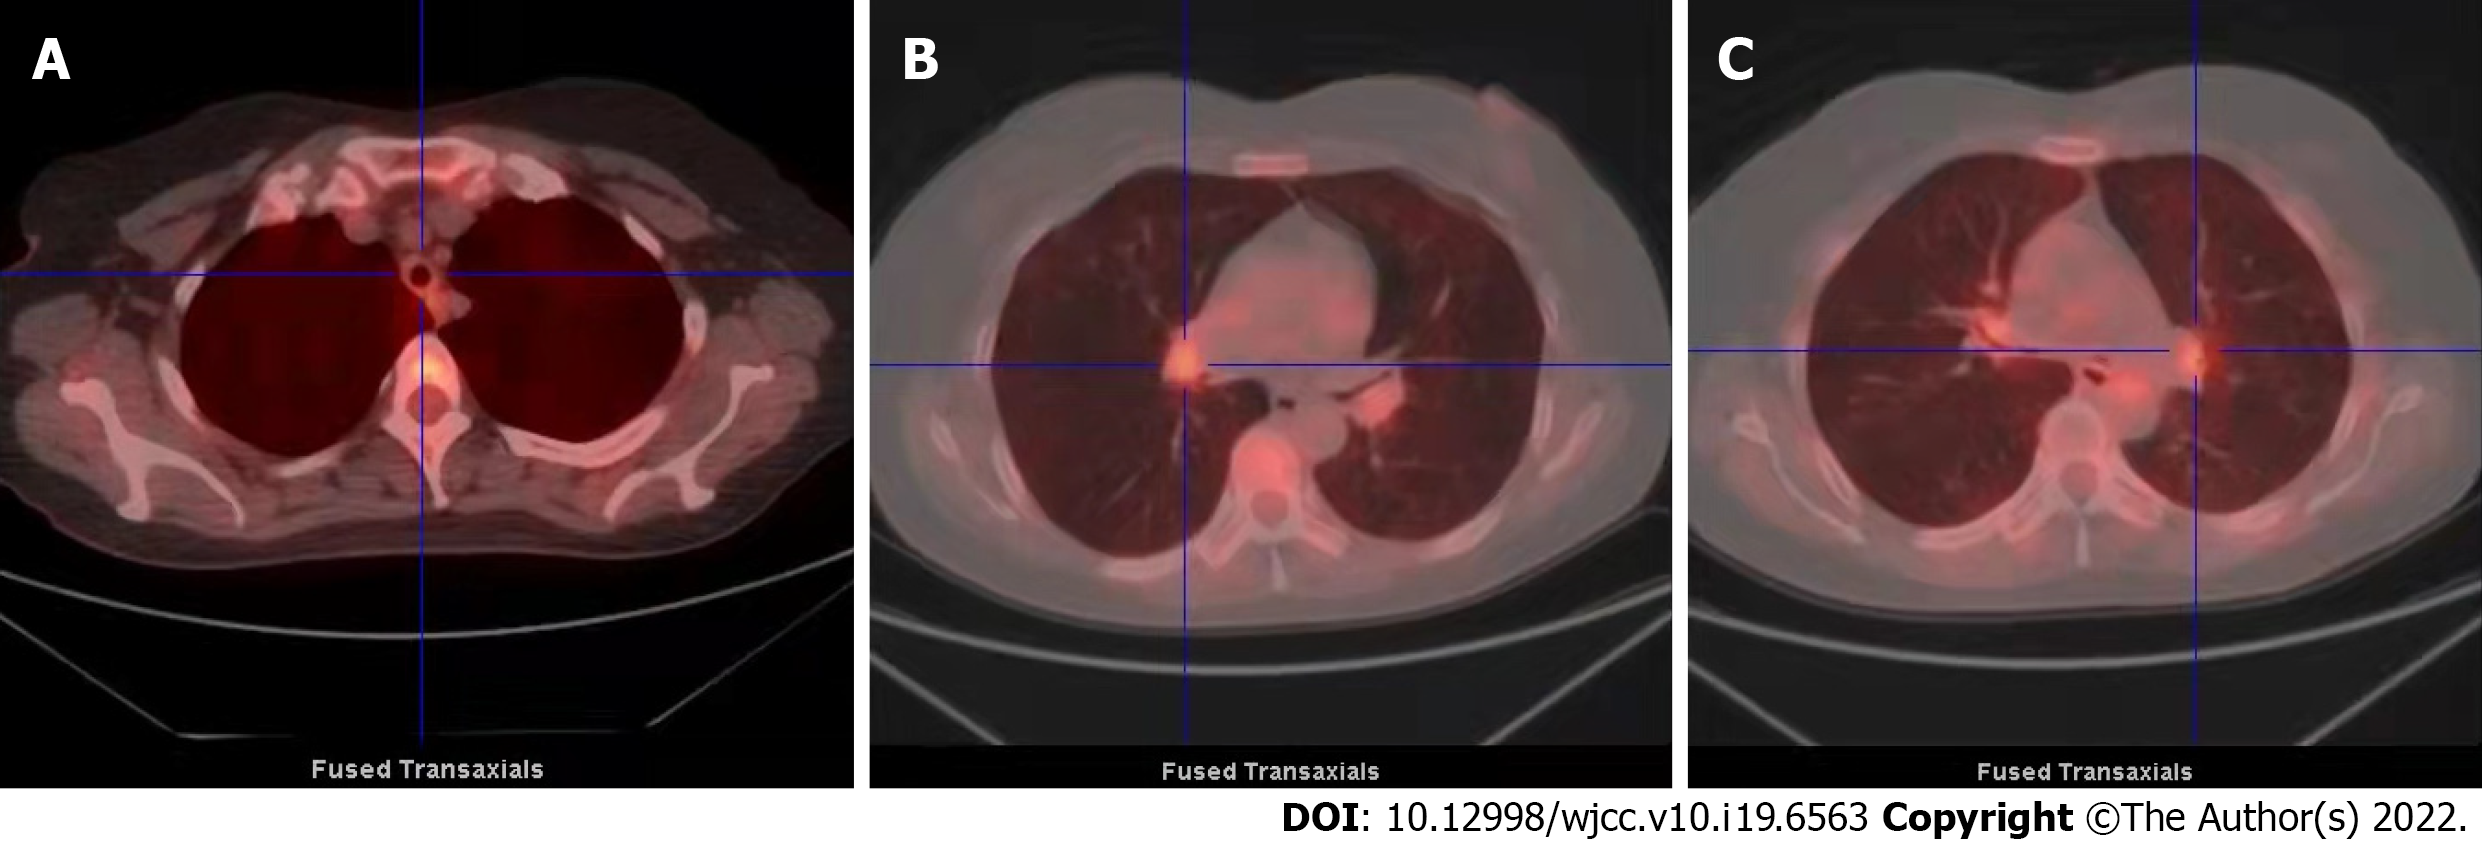
Figure 5 Fluorodeoxyglucose positron emission tomography/computed tomography imaging.
A-C: The walls of the trachea and left and right main bronchi show even thickening (with obvious thickening of the tracheal cartilage). Metabolic activities in these structures are slightly to moderately enhanced, especially near the hilum. The metabolic distributions were figure-eight- or strip-shaped. SUVmax = 2.91.
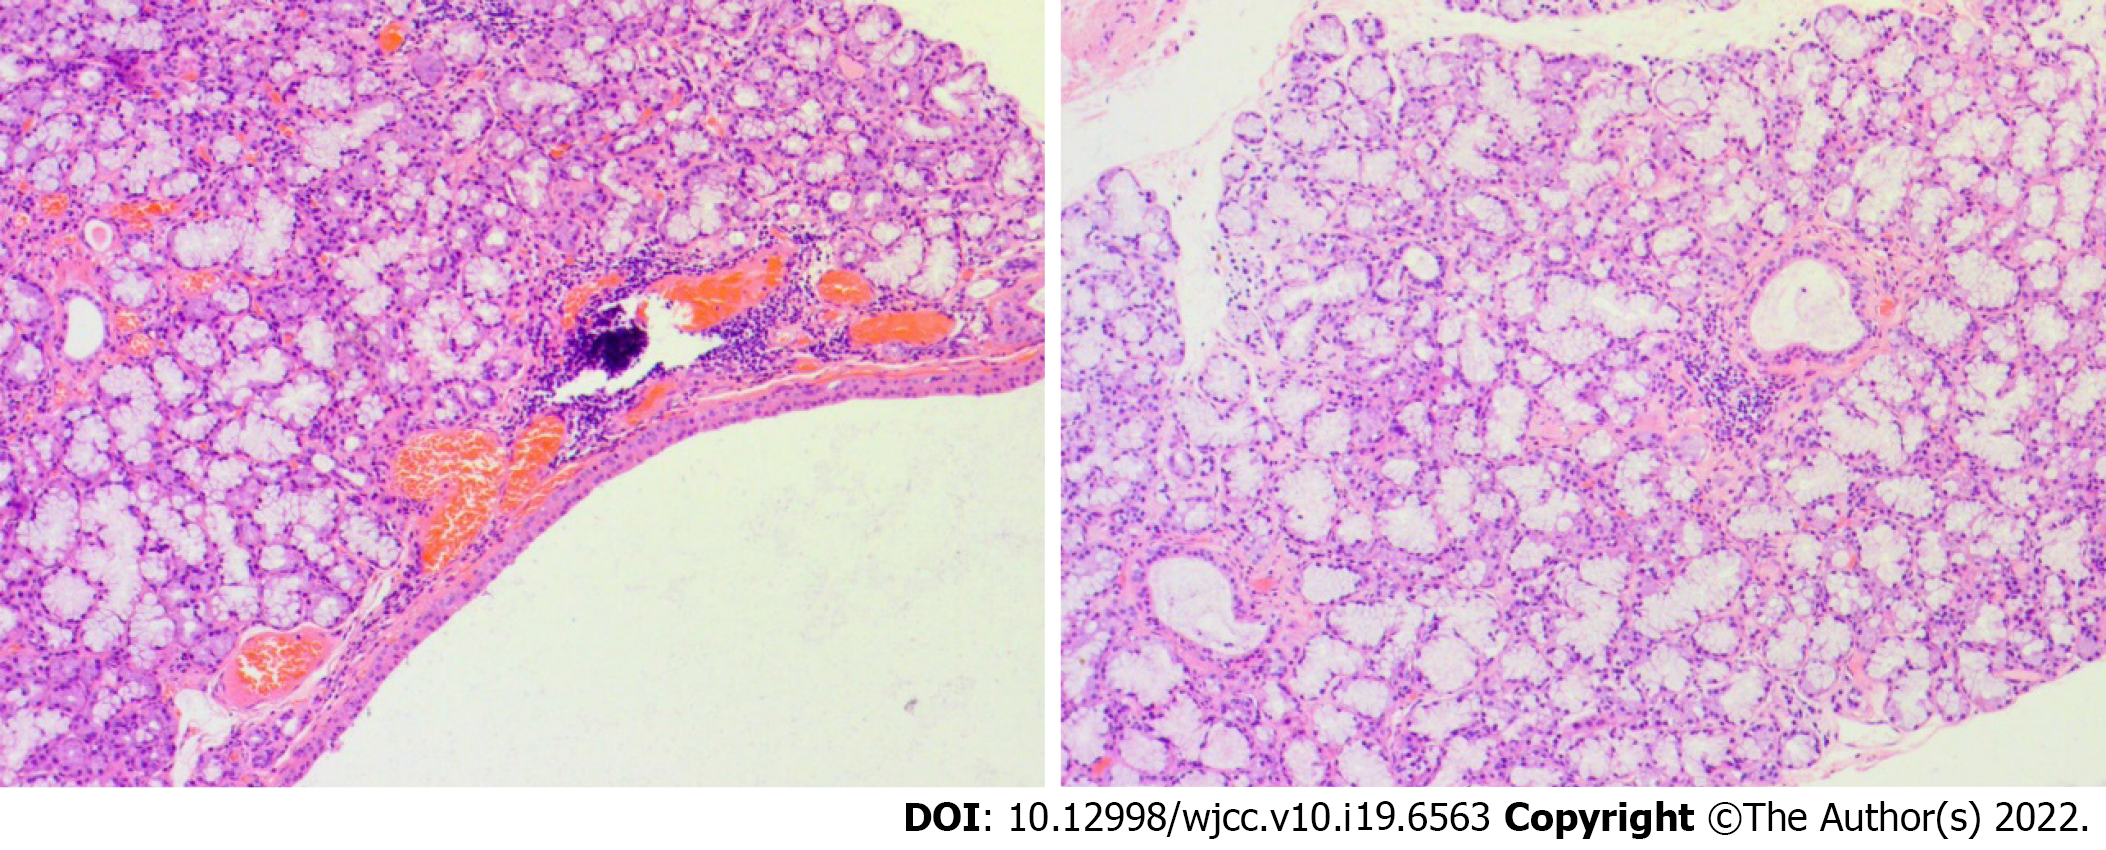
Figure 6 Lower lip’s salivary gland tissue biopsy (magnification, 200 ×).
A focal region with > 50 lymphocytes is depicted.
- Citation: Chen JY, Li XY, Zong C. Relapsing polychondritis with isolated tracheobronchial involvement complicated with Sjogren's syndrome: A case report. World J Clin Cases 2022; 10(19): 6563-6570
- URL: https://www.wjgnet.com/2307-8960/full/v10/i19/6563.htm
- DOI: https://dx.doi.org/10.12998/wjcc.v10.i19.6563


