Copyright
©The Author(s) 2022.
World J Clin Cases. Jul 6, 2022; 10(19): 6456-6463
Published online Jul 6, 2022. doi: 10.12998/wjcc.v10.i19.6456
Published online Jul 6, 2022. doi: 10.12998/wjcc.v10.i19.6456
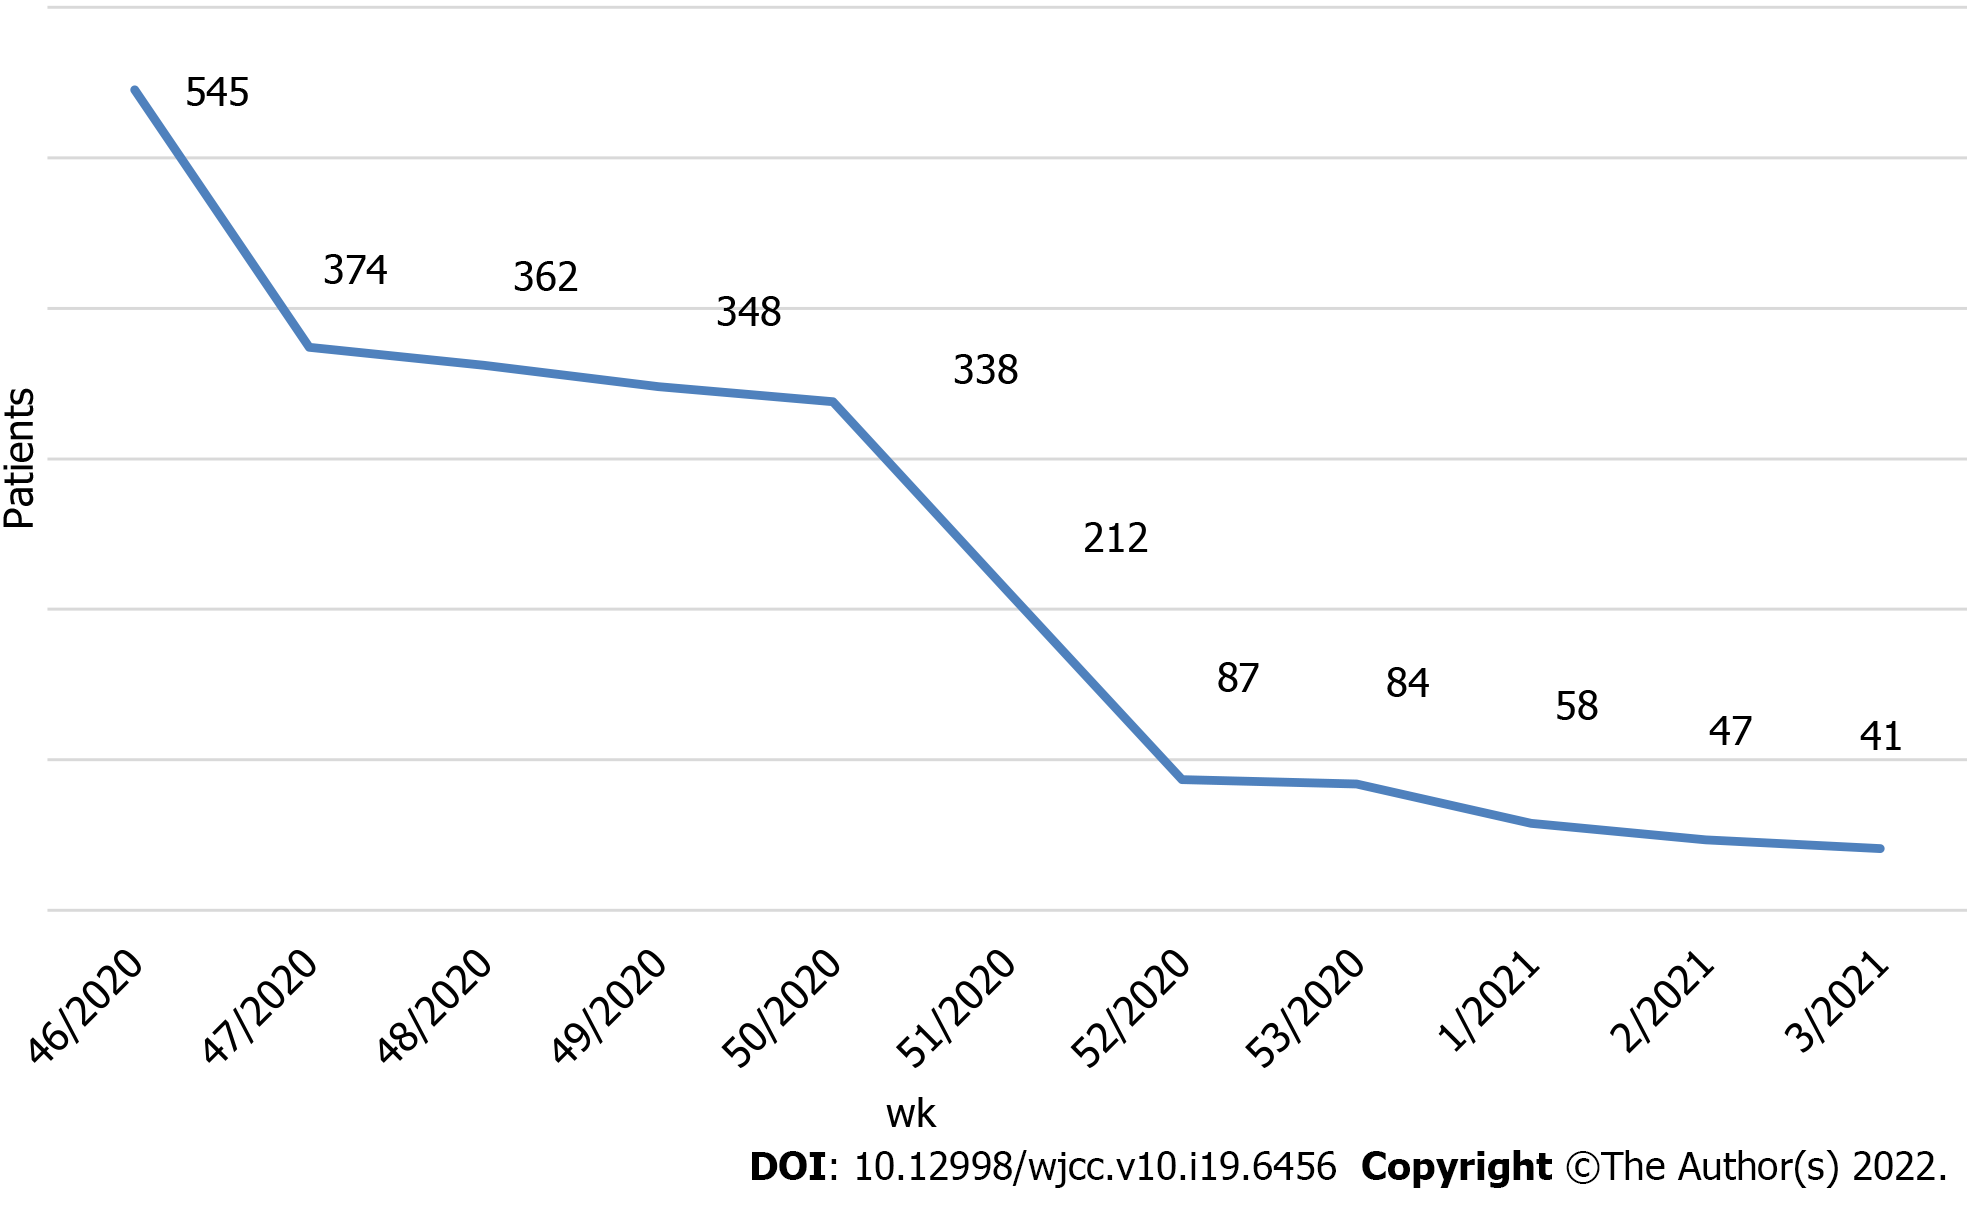
Figure 1 Weekly number of symptomatic patients tested by rapid antigen-detection tests.
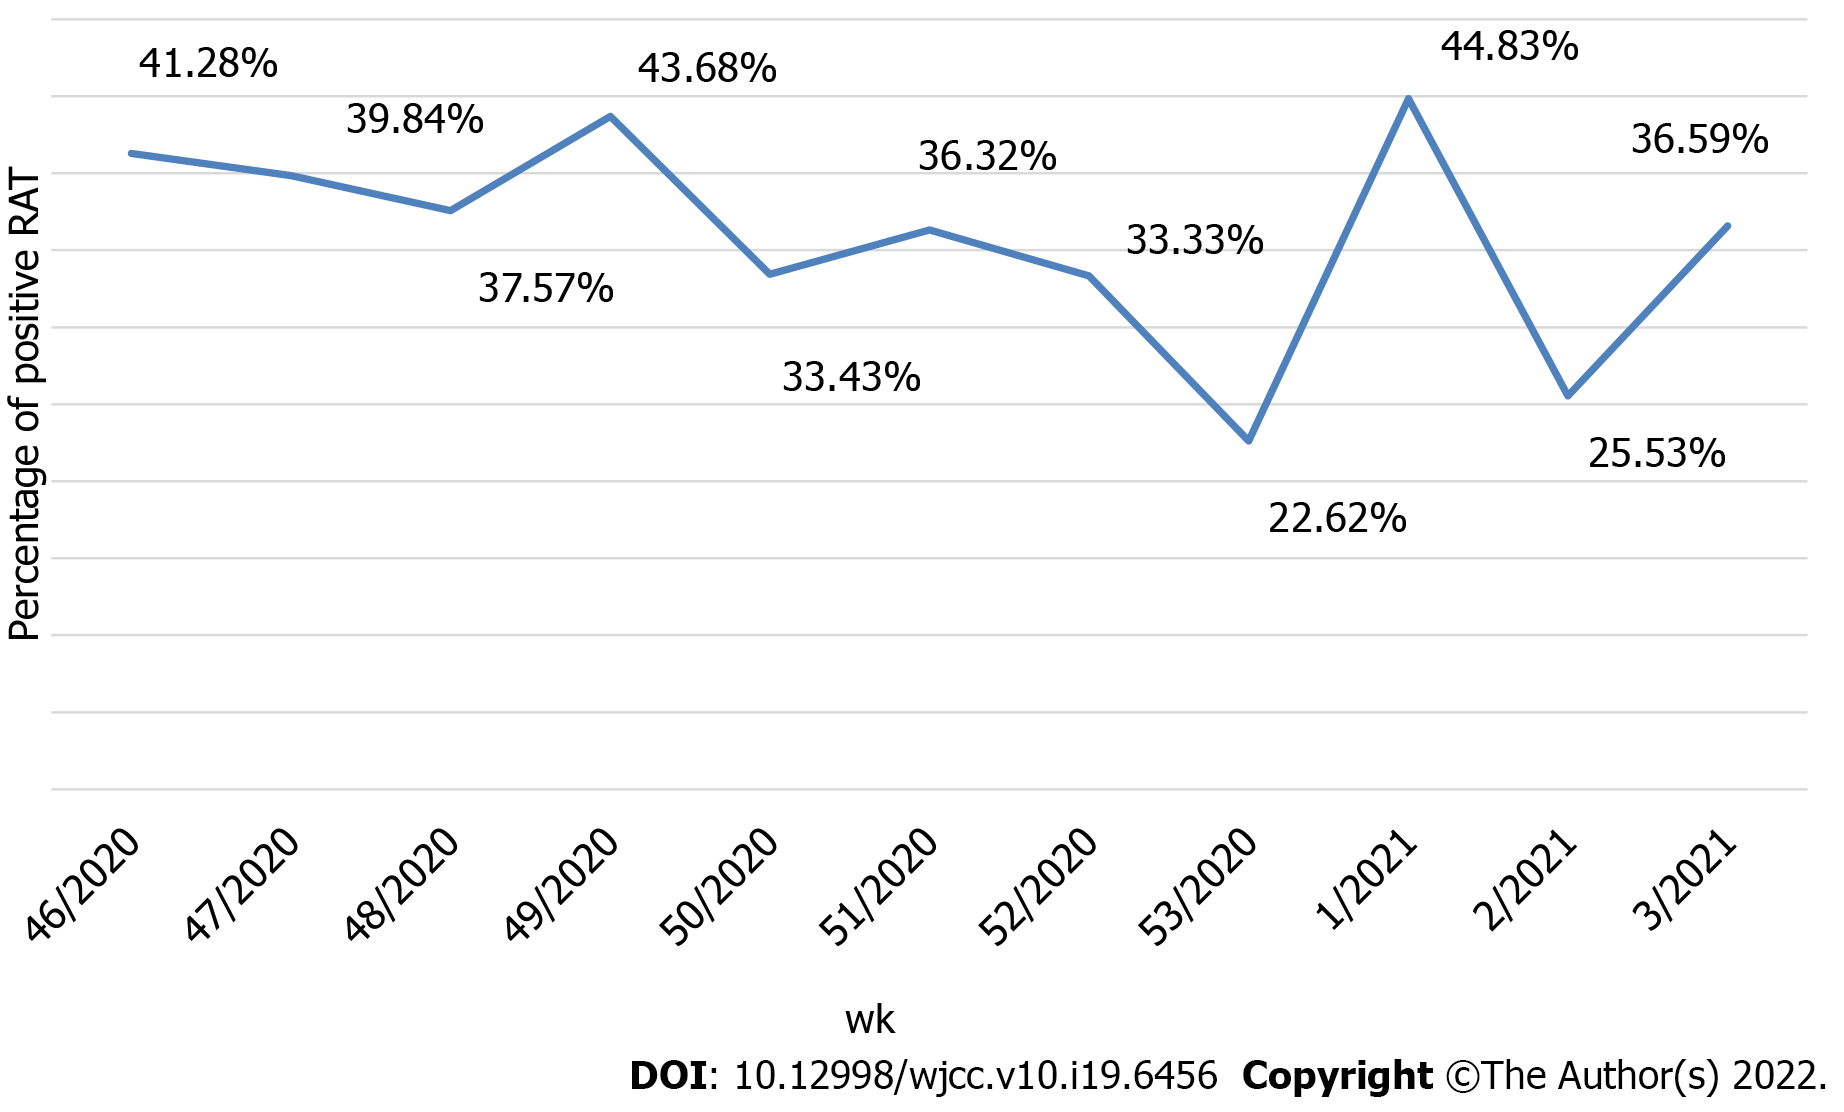
Figure 2 Ratio of positive rapid antigen-detection tests results by week.
RAT: Rapid antigen.
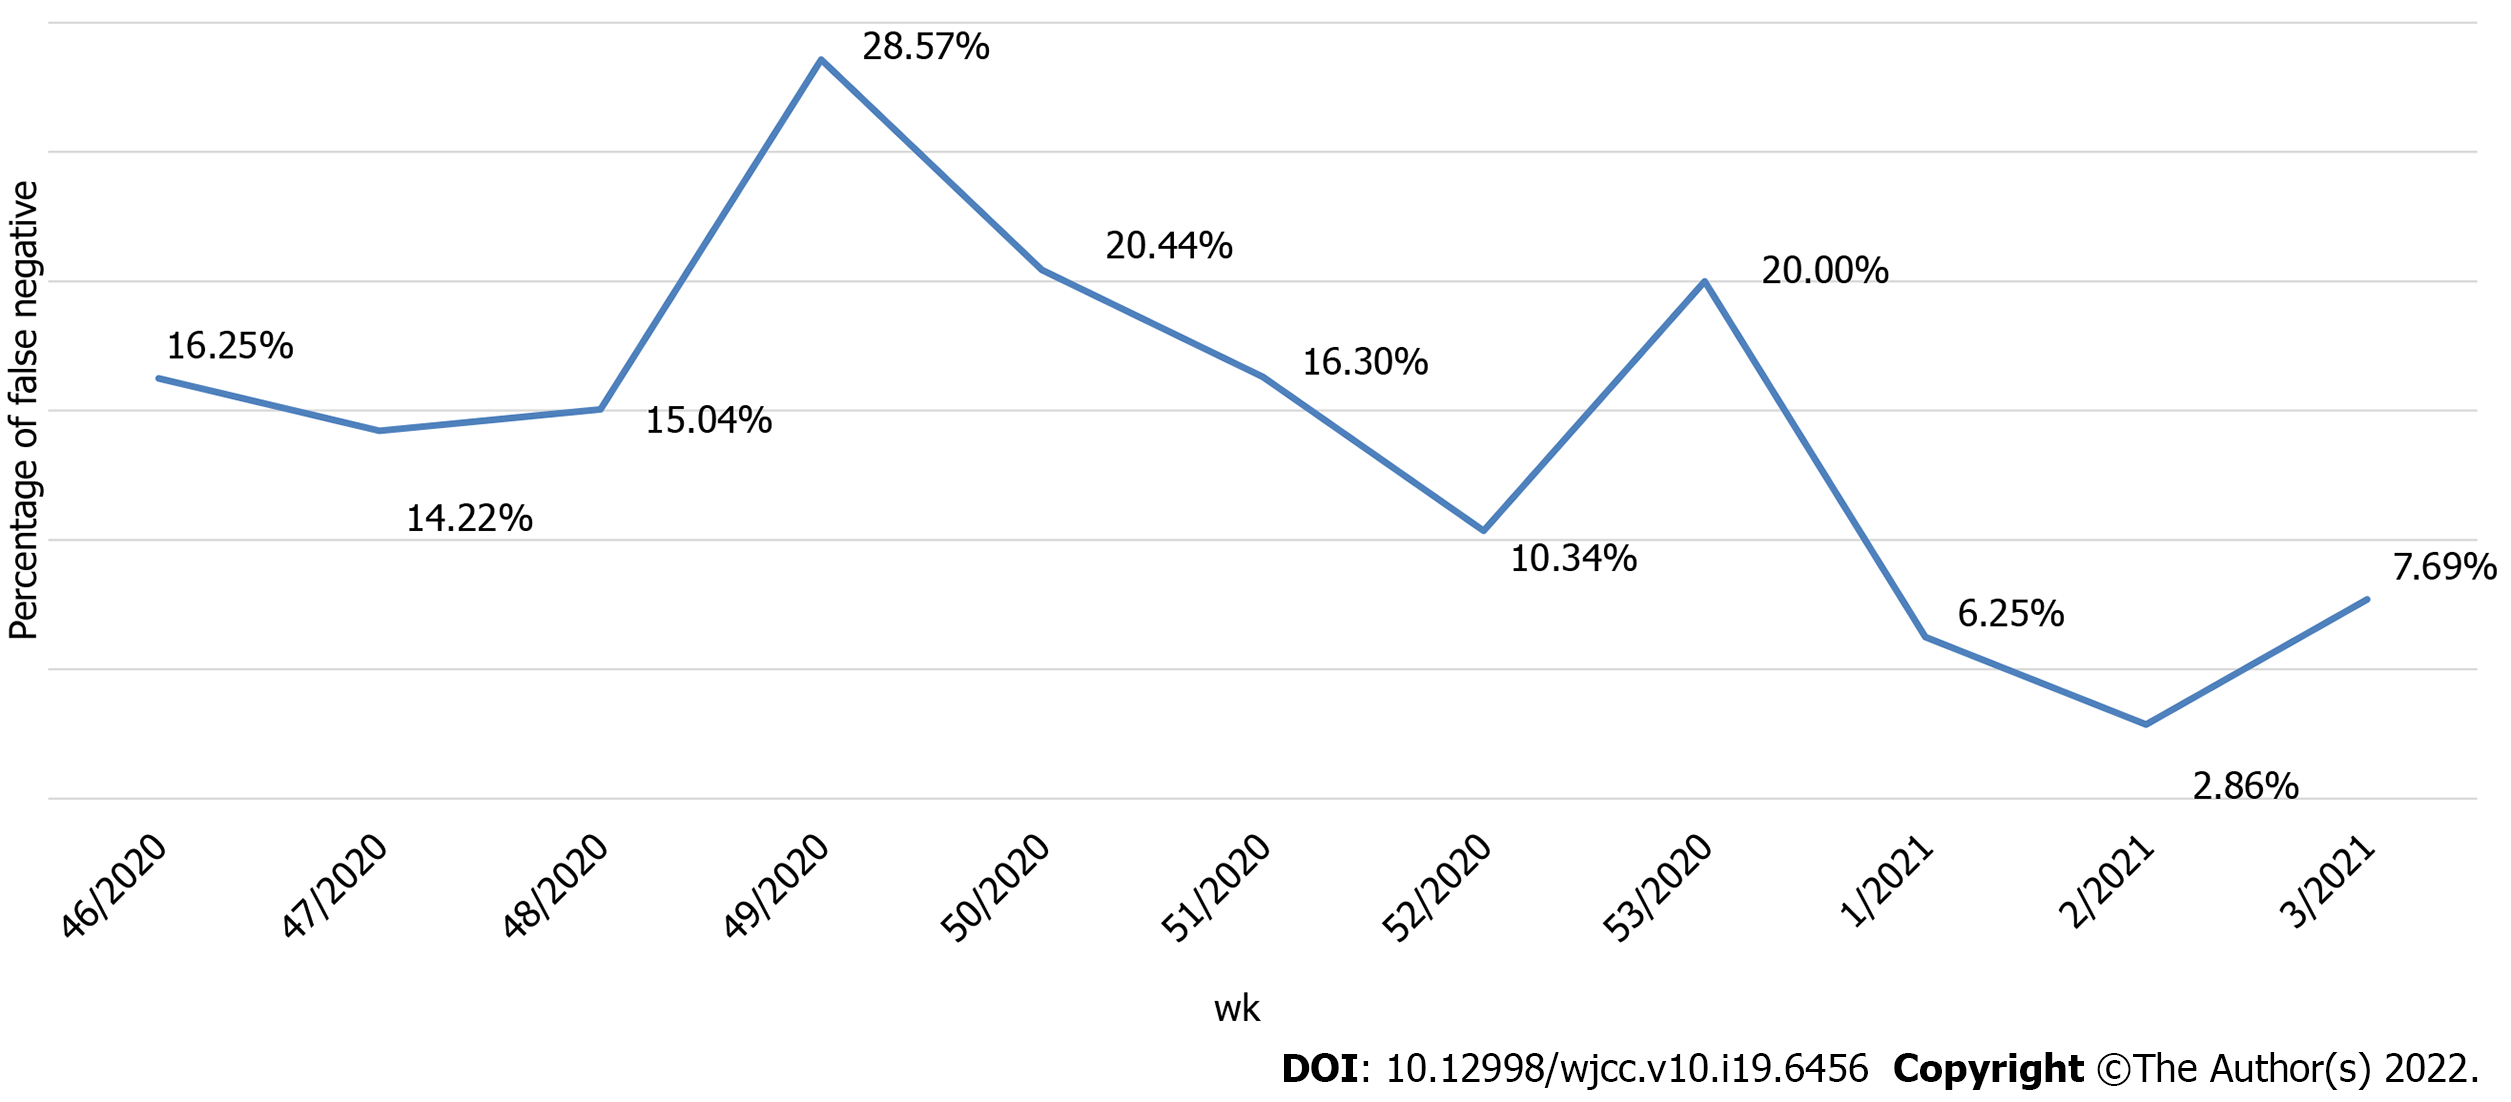
Figure 3 Ratio of false-negative rapid antigen-detection tests results by week.
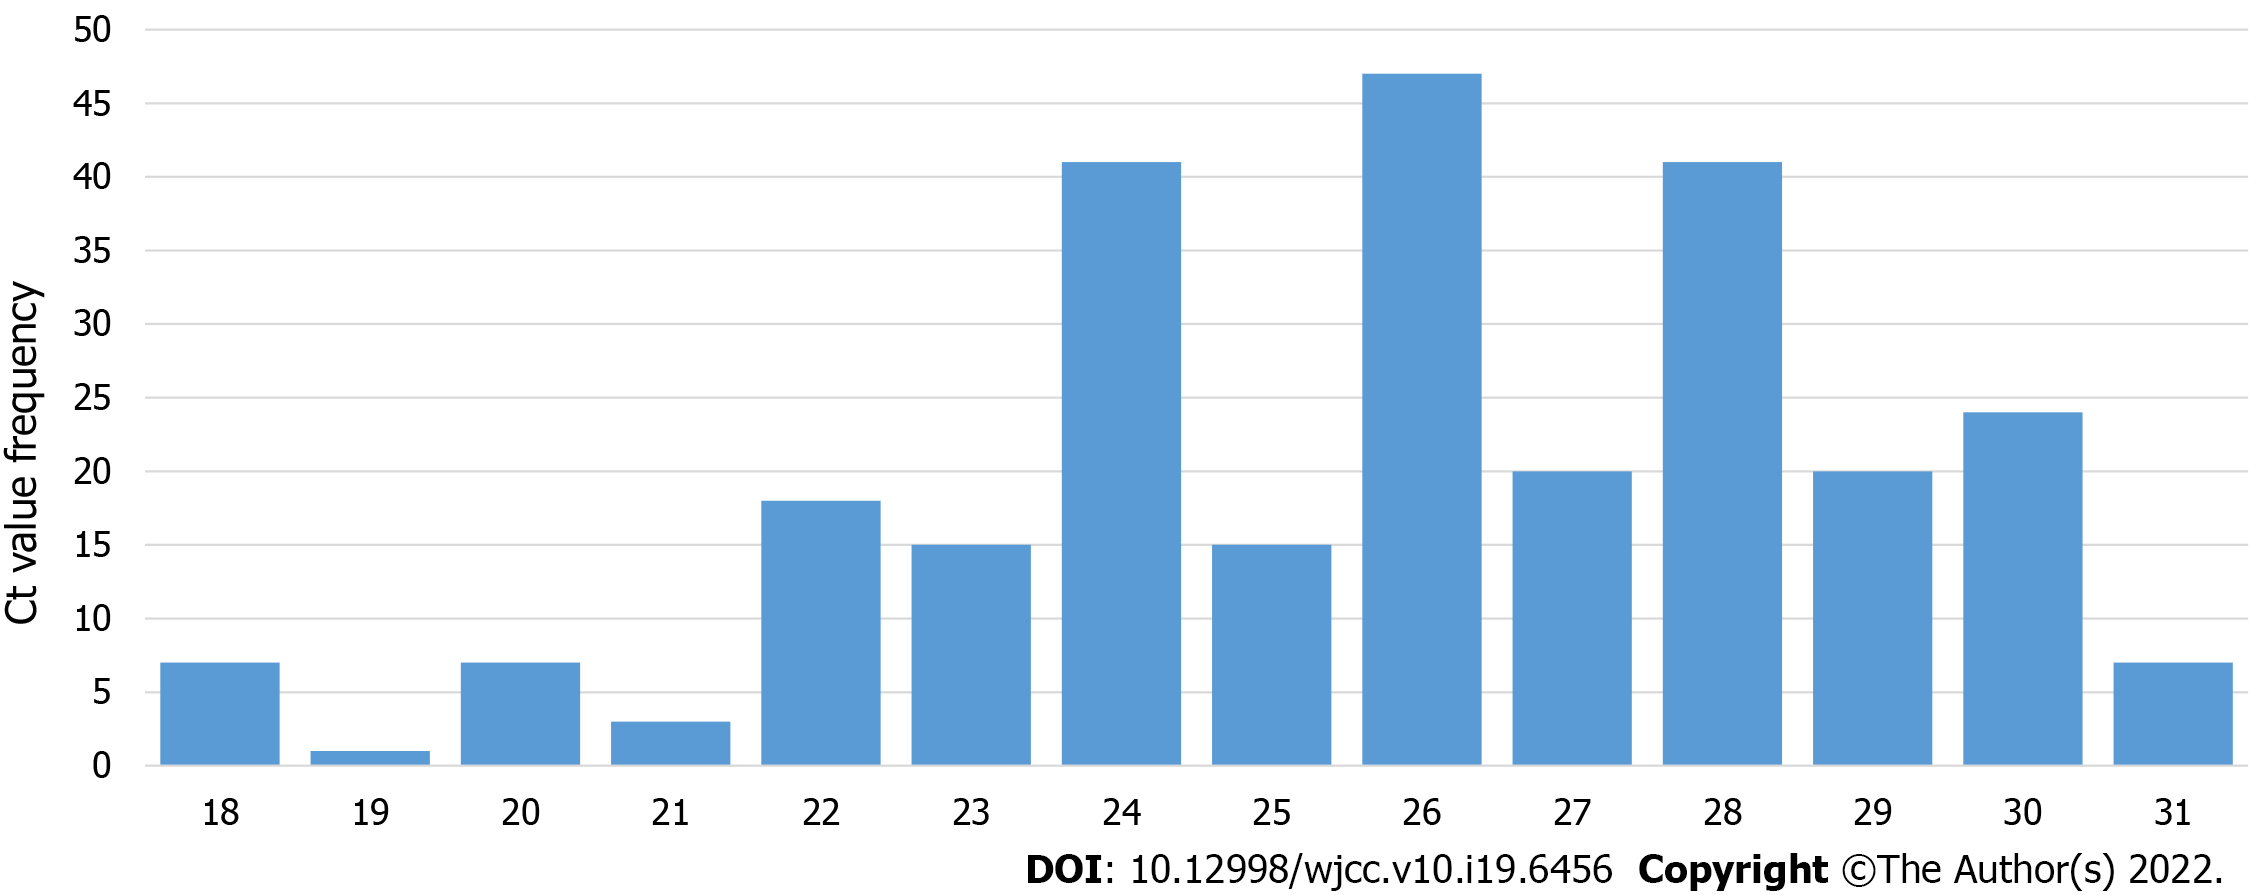
Figure 4 Number of rapid antigen-detection tests false-negative patients testing positive per each reverse transcription-polymerase chain reaction cycle.
Ct: Reverse transcription-polymerase chain reaction cycle.
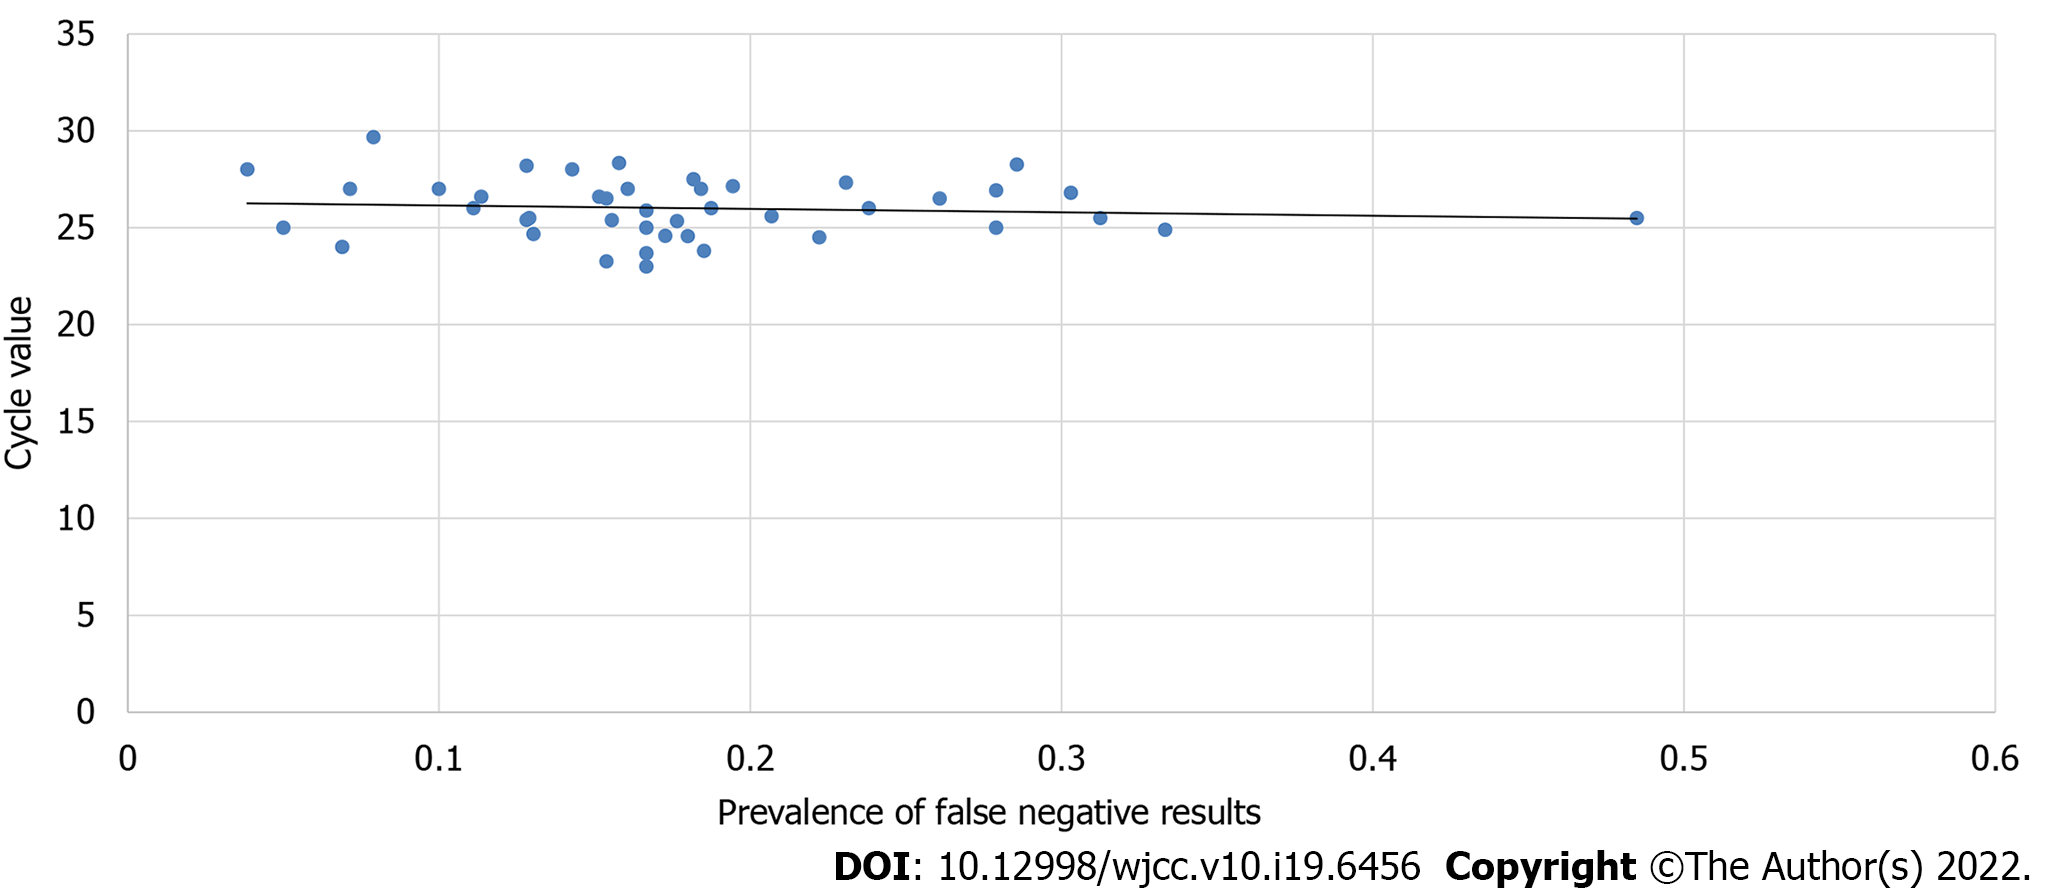
Figure 5 Correlation between reverse transcription-polymerase chain reaction cycle values and prevalence of false-negative results.
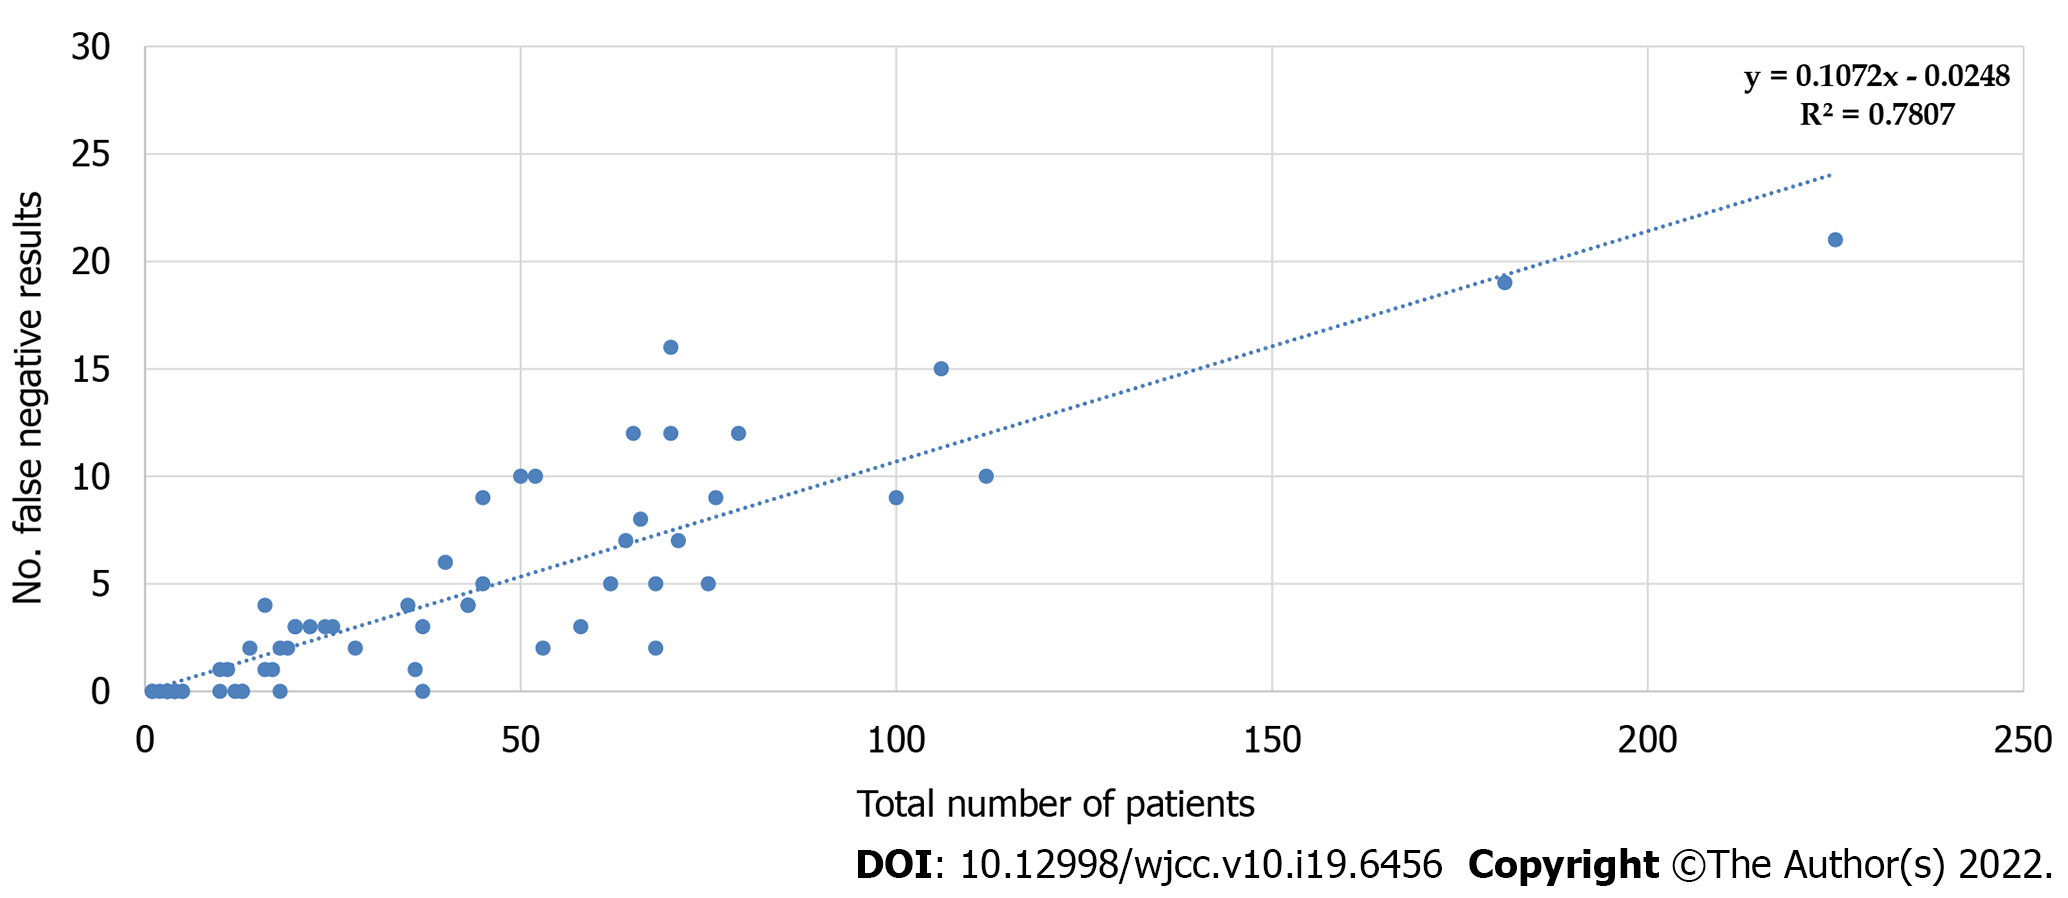
Figure 6 Predictive model of correlation between the total number of patients and the number of false negatives.
- Citation: Tabain I, Cucevic D, Skreb N, Mrzljak A, Ferencak I, Hruskar Z, Misic A, Kuzle J, Skoda AM, Jankovic H, Vilibic-Cavlek T. Field evaluation of COVID-19 rapid antigen test: Are rapid antigen tests less reliable among the elderly? . World J Clin Cases 2022; 10(19): 6456-6463
- URL: https://www.wjgnet.com/2307-8960/full/v10/i19/6456.htm
- DOI: https://dx.doi.org/10.12998/wjcc.v10.i19.6456


