Copyright
©The Author(s) 2022.
World J Clin Cases. Jul 6, 2022; 10(19): 6385-6398
Published online Jul 6, 2022. doi: 10.12998/wjcc.v10.i19.6385
Published online Jul 6, 2022. doi: 10.12998/wjcc.v10.i19.6385
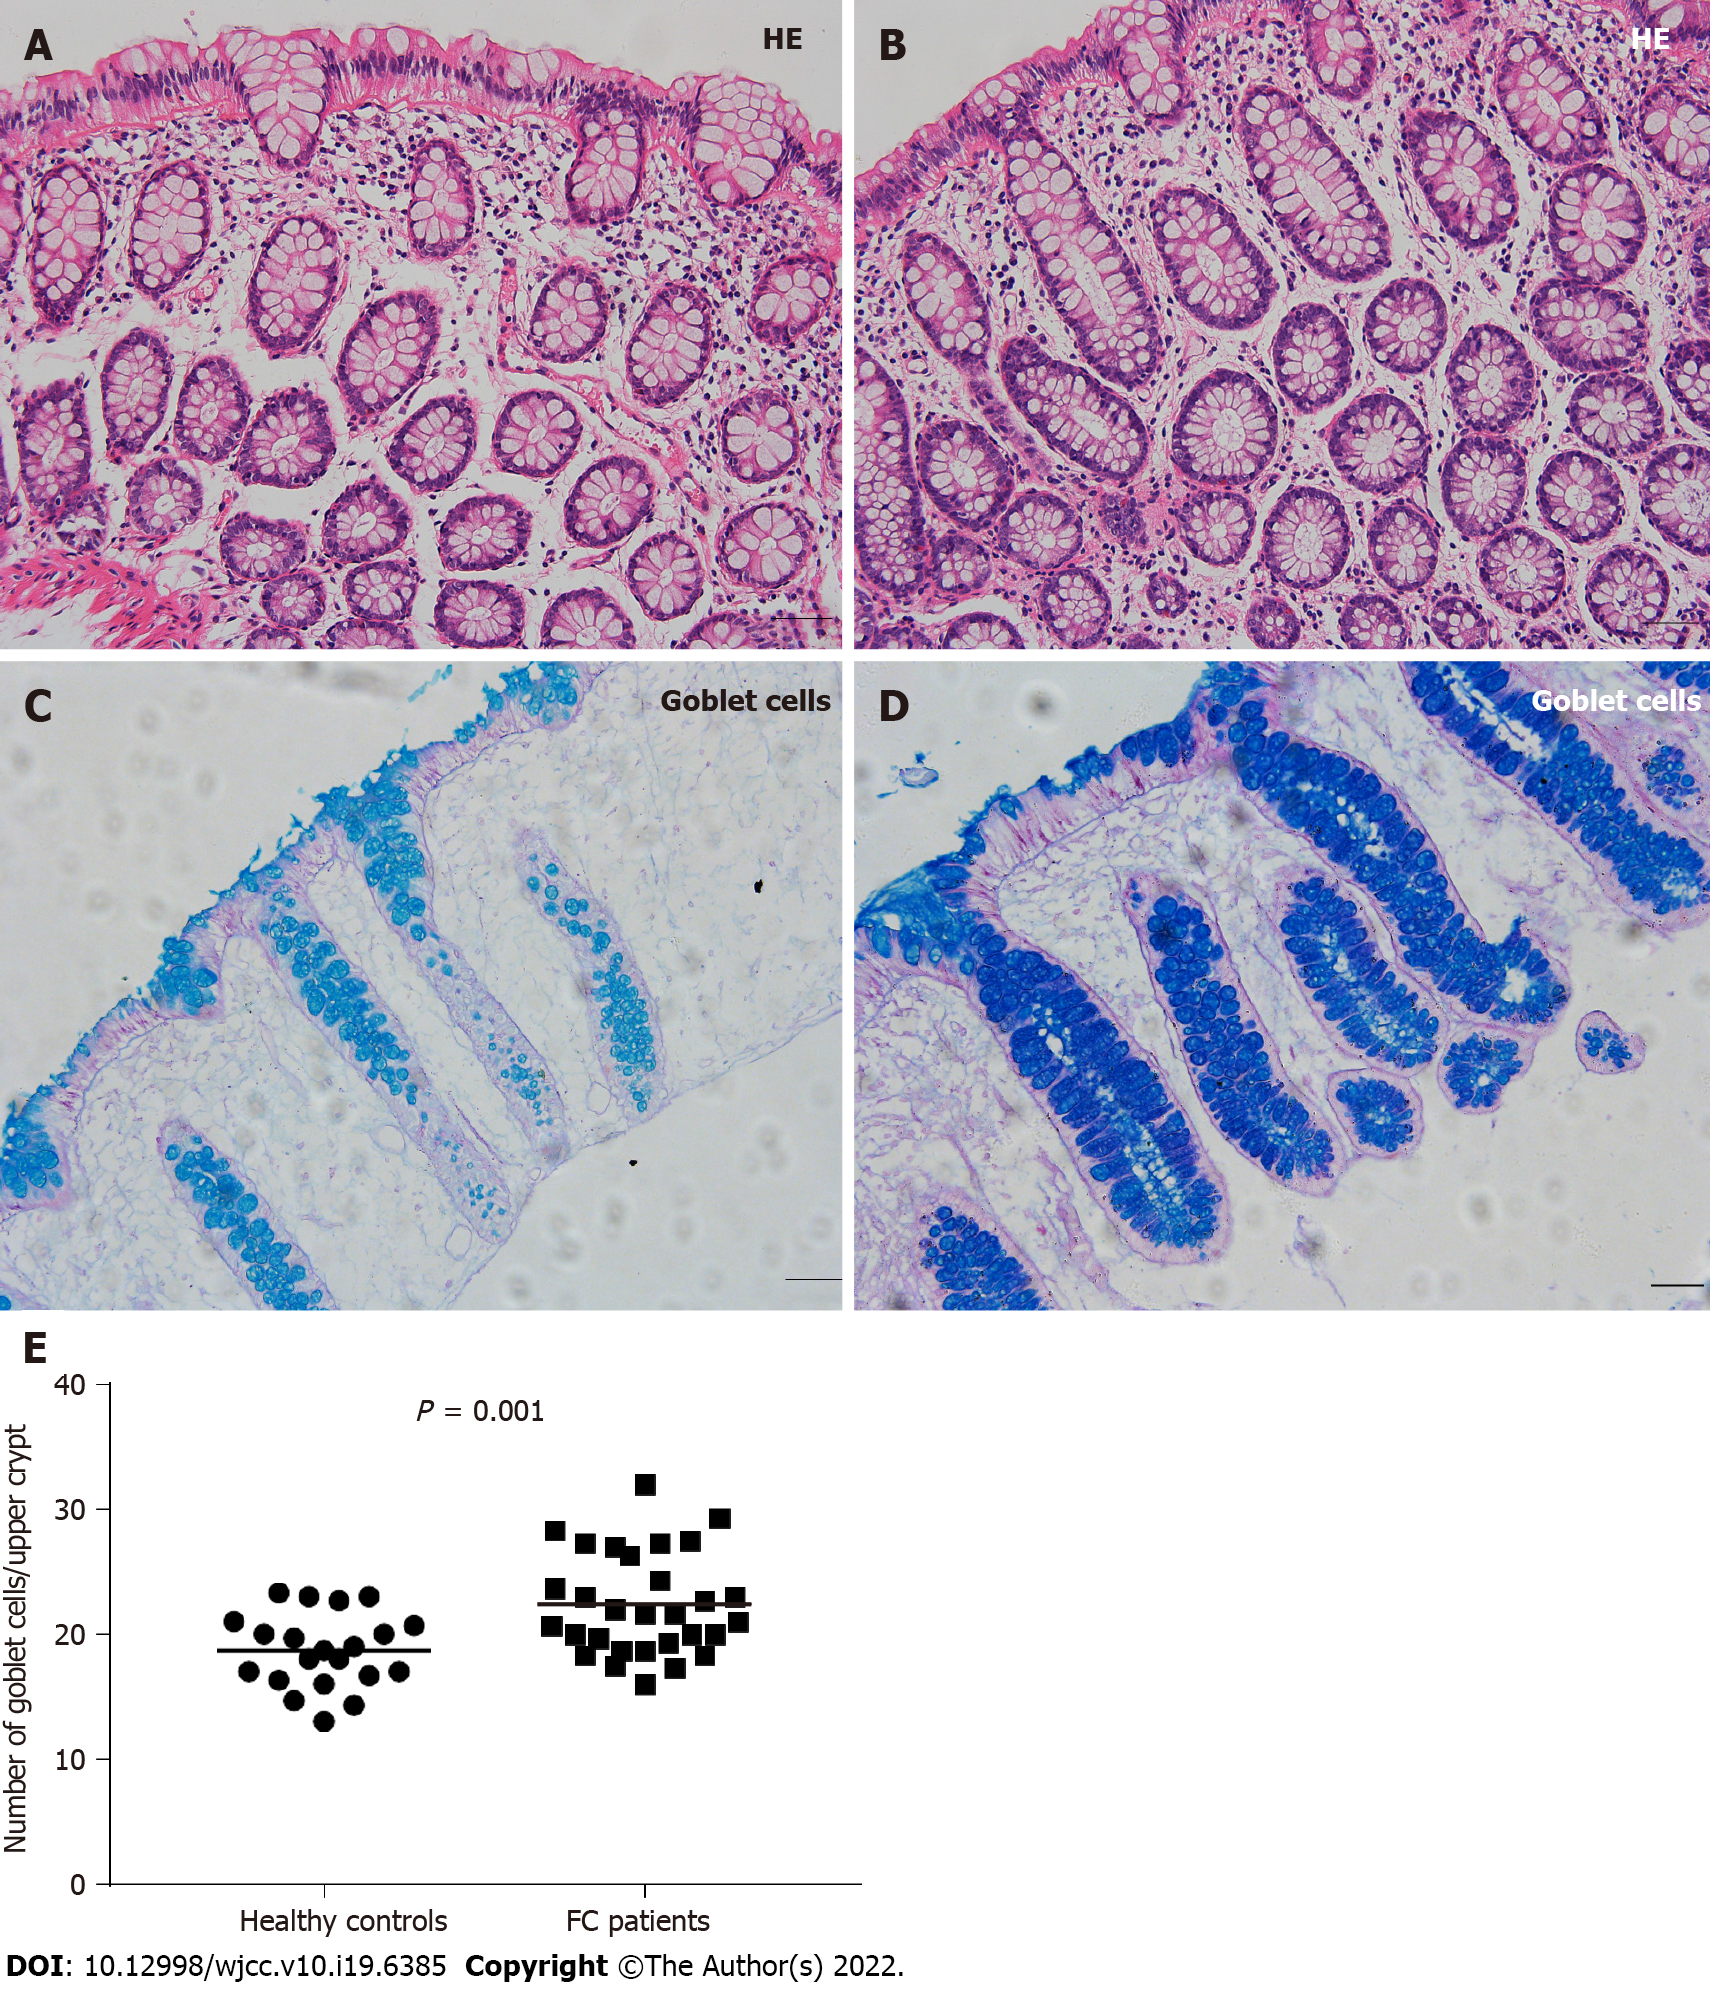
Figure 1 Mucosal histology and goblet cells in healthy controls and patients with functional constipation.
A and B: Colonic mucosal histology presented as normal in healthy controls and functional constipation (FC) patients (Scale bar = 50 μm); C: Goblet cells with Alcian Blue/Periodic acid Schiff (AB/PAS) staining in healthy controls (Scale bar = 50 μm); D: Goblet cells with AB/PAS staining in FC patients (Scale bar = 50 μm); E: The number of goblet cells per upper crypt was significantly increased in FC patients compared to healthy controls. The line inside the scatter plot indicates the mean value. FC: Functional constipation; HE: Hematoxylin and eosin.
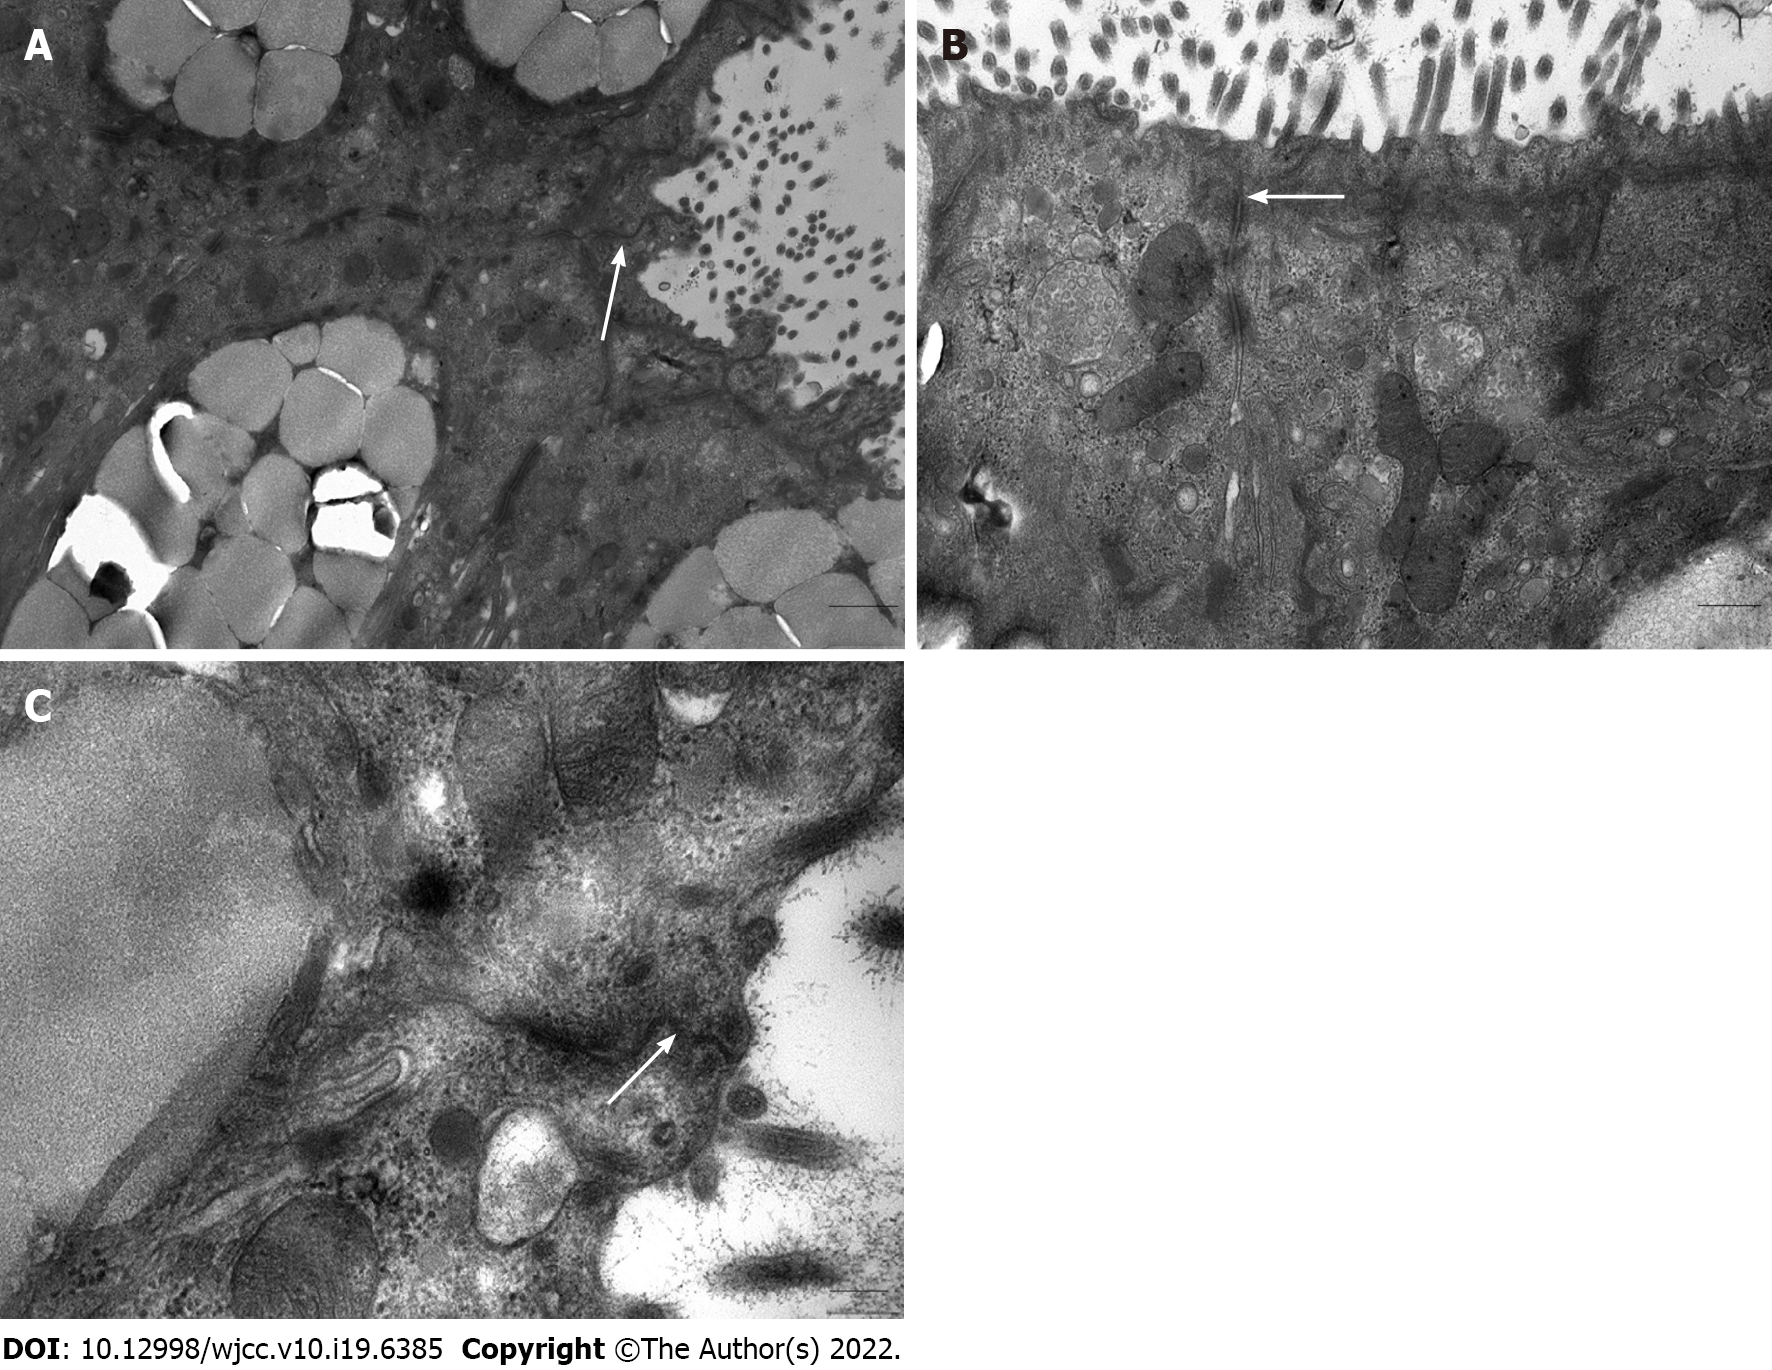
Figure 2 Intercellular junctional complexes in the colonic epithelium under an electron microscopy in patients with functional constipation.
Intercellular junctional complexes were continuous and integral. A: Scale bar = 1 μm; B: Scale bar = 500 nm; C: Scale bar = 200 nm. White arrows represent intercellular junctional complexes.
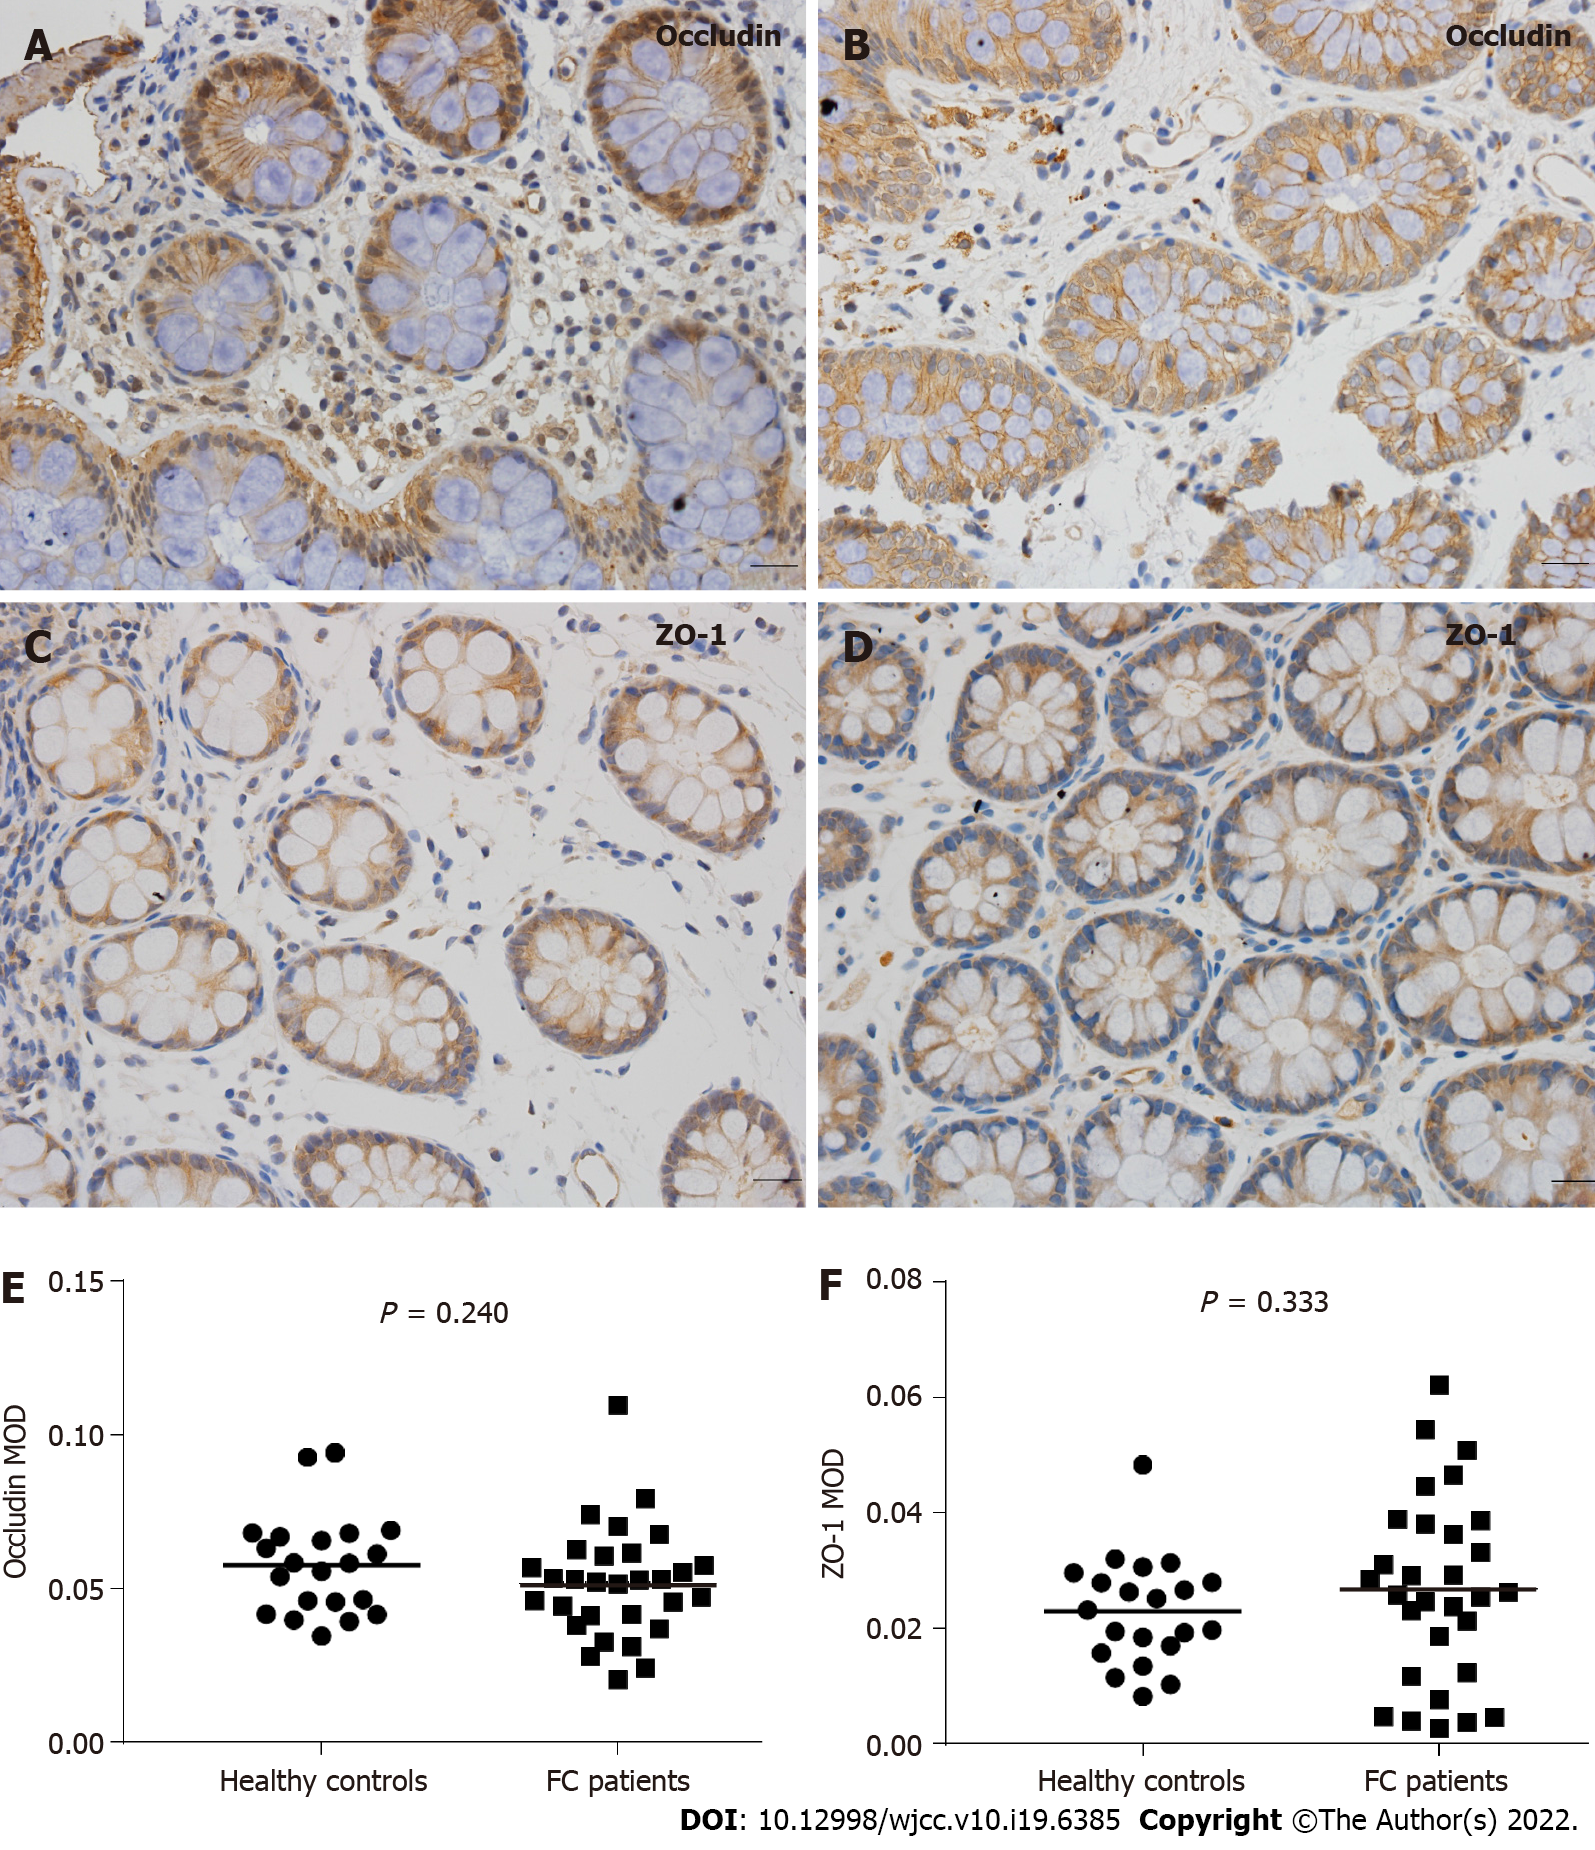
Figure 3 Immunohistochemical analysis of occludin and zonula occludens-1 expression in healthy controls and patients with functional constipation.
A: Colonic mucosal occludin expression in healthy controls (Scale bar = 20 μm); B: Colonic mucosal occludin expression in functional constipation (FC) patients (Scale bar = 20 μm); C: Colonic mucosal zonula occludens-1 (ZO-1) expression in healthy controls (Scale bar = 20 μm); D: Colonic mucosal ZO-1 expression in FC patients (Scale bar = 20 μm); E and F: No significant differences in occludin or ZO-1 expression were found between healthy controls and FC patients (P = 0.240 and P = 0.333, respectively). FC: Functional constipation; ZO-1: Zonula occludens-1; MOD: Mean optical density.
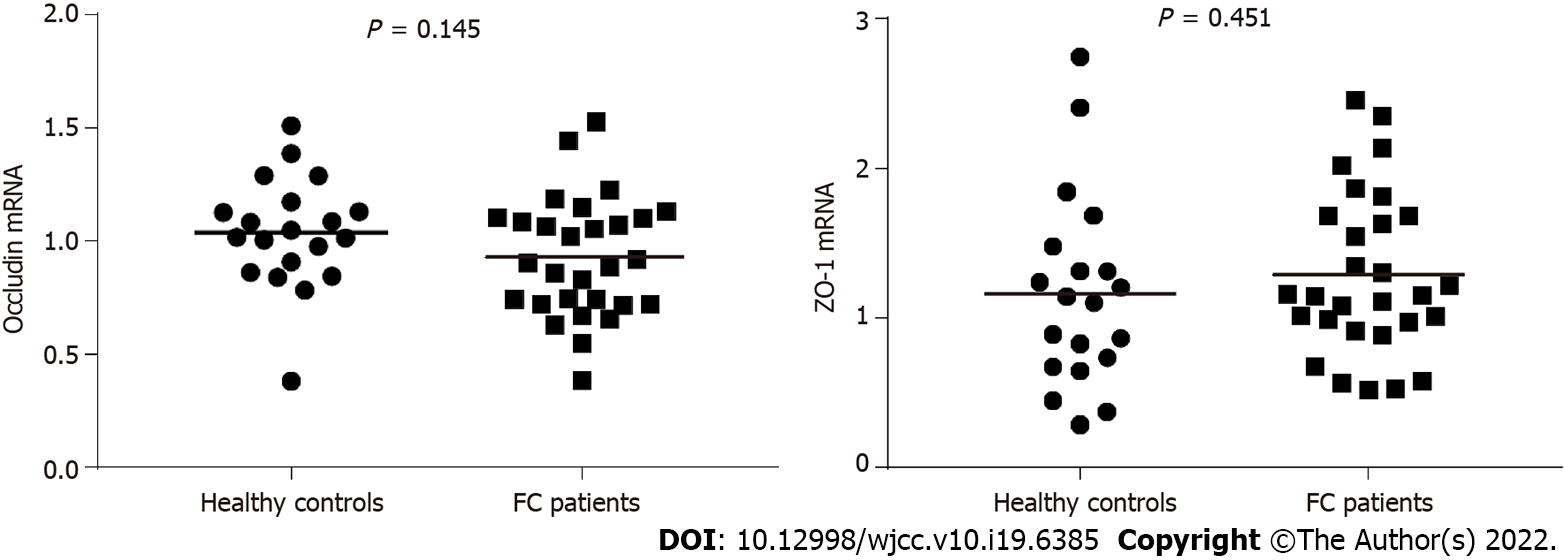
Figure 4 Colonic mucosal occludin and zonula occludens-1 mRNA levels in healthy controls and patients with functional constipation.
Similar to immunohistochemical analysis, no significant differences in occludin or ZO-1 mRNA levels were found between healthy controls and functional constipation patients (P = 0.145 and P = 0.451, respectively). FC: Functional constipation; ZO-1: Zonula occludens-1.
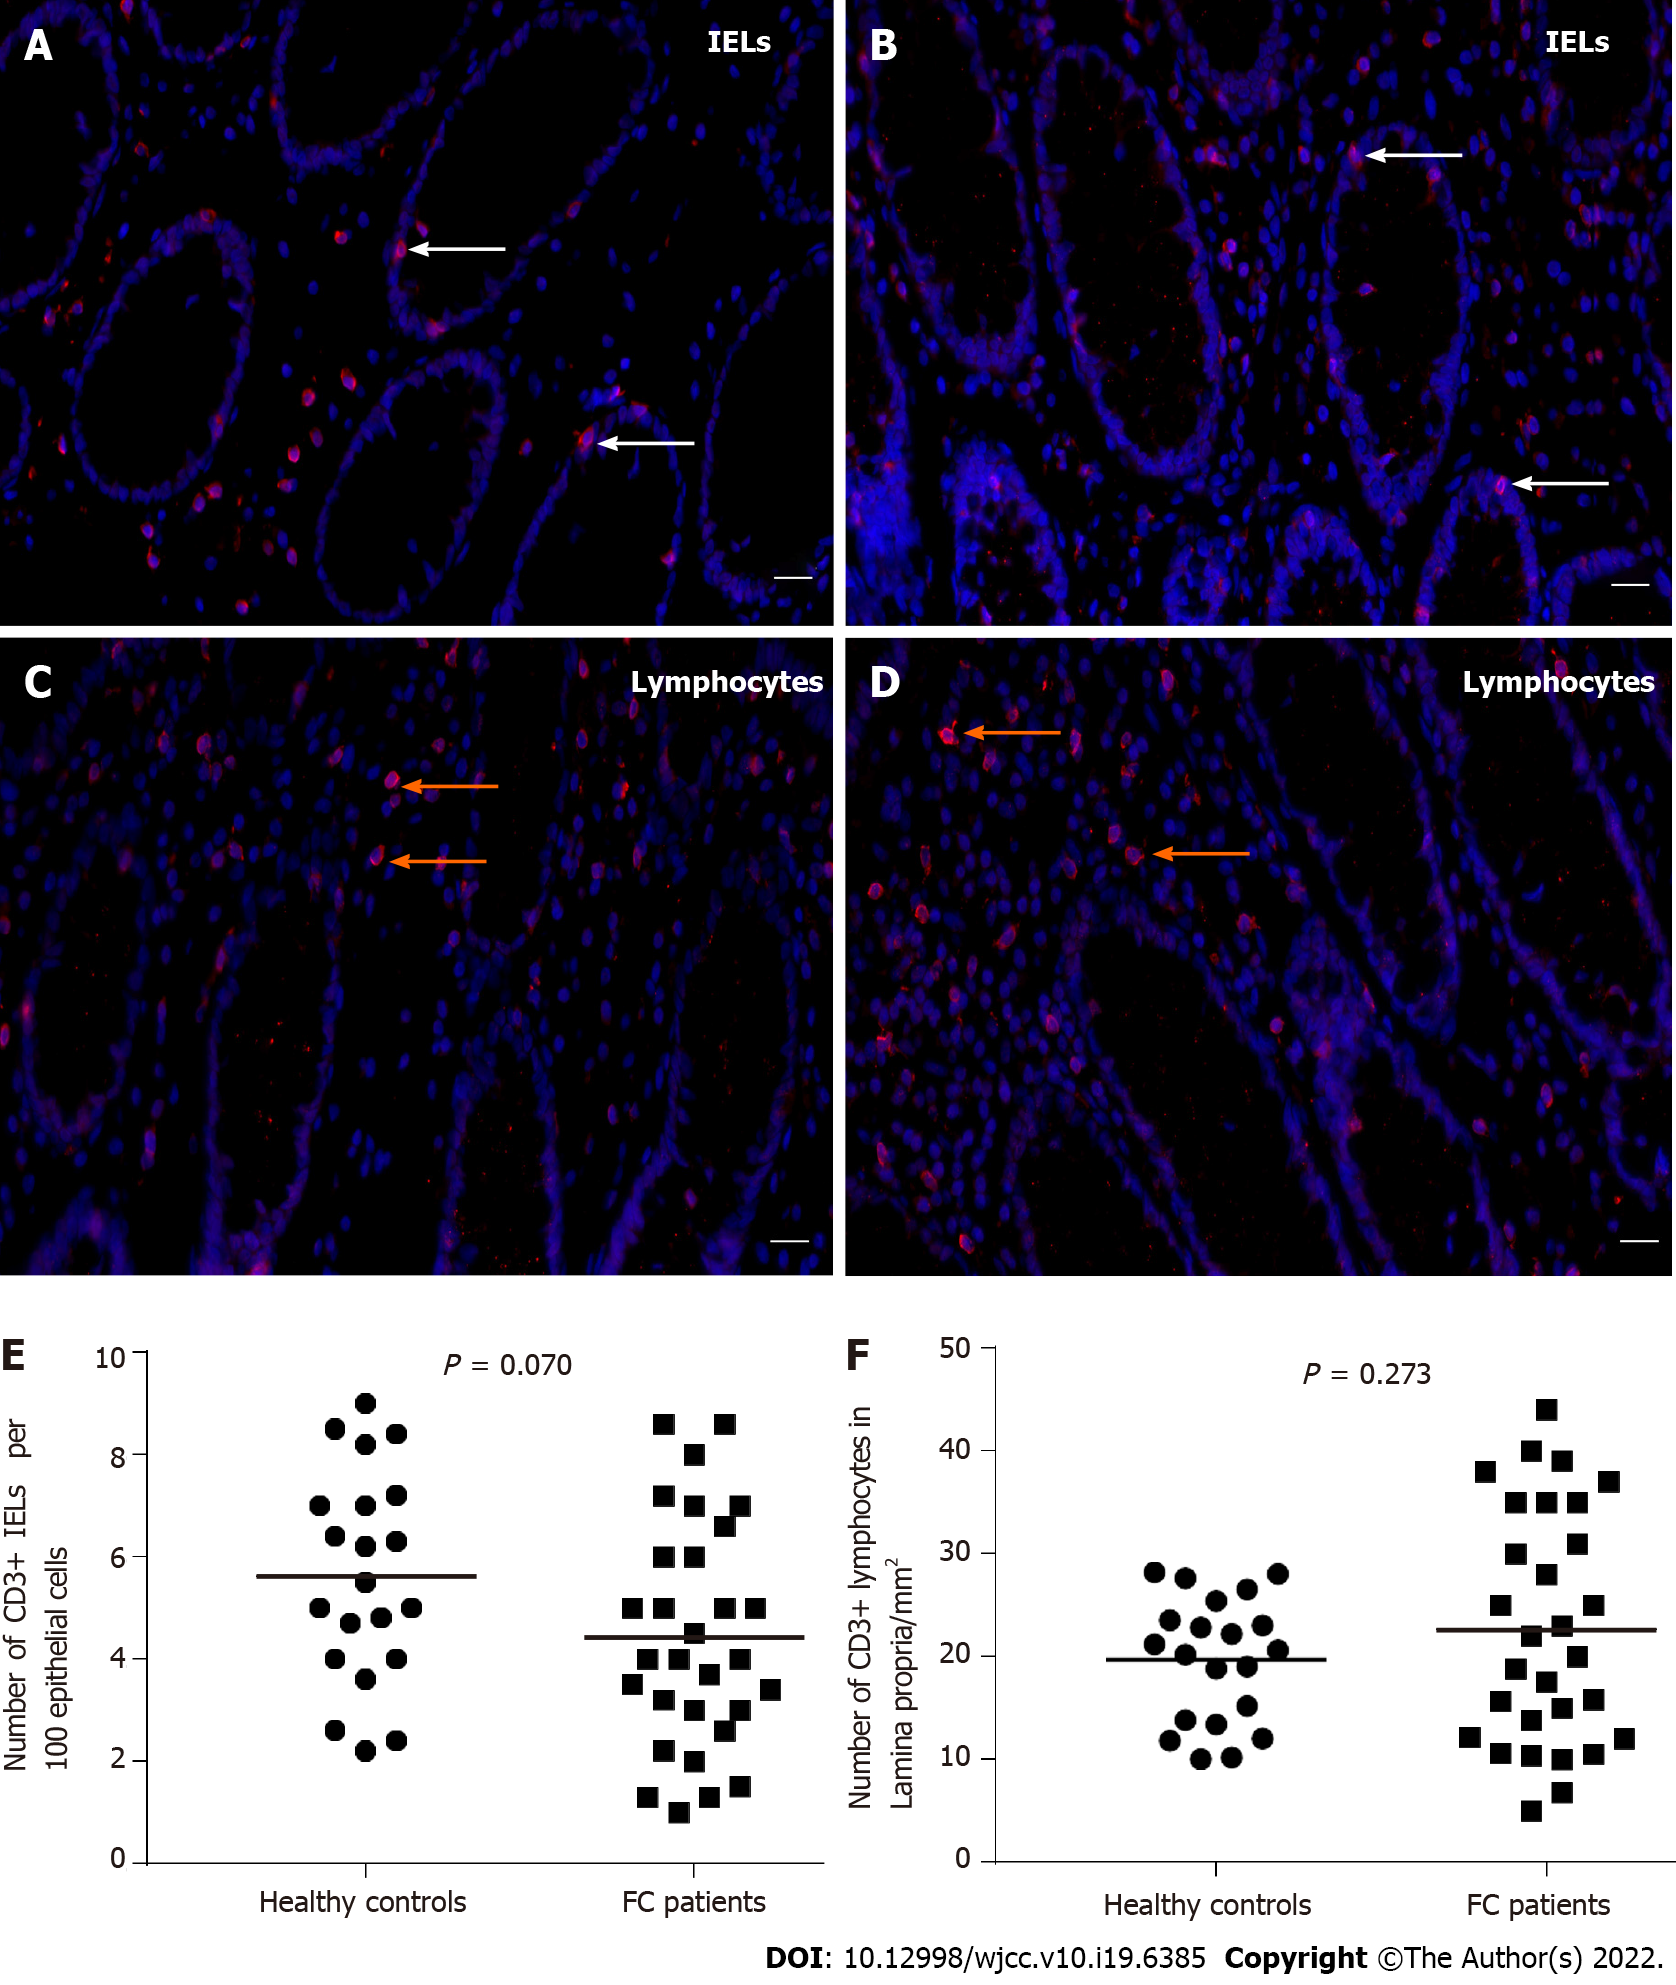
Figure 5 Immunofluorescence of colonic CD3+ intraepithelial lymphocytes and CD3+ lamina propria lymphocytes in healthy controls and patients with functional constipation.
A: Colonic CD3+ intraepithelial lymphocytes (IELs) in healthy controls (Scale bar = 20 μm, white arrows represent IELs); B: Colonic CD3+ IELs in functional constipation (FC) patients (Scale bar = 20 μm, white arrows represent IELs); C: CD3+ lamina propria lymphocytes in healthy controls (Scale bar = 20 μm, orange arrows represent lymphocytes); D: CD3+ lamina propria lymphocytes in FC patients (Scale bar = 20 μm, orange arrows represent lymphocytes); E and F: CD3+ IEL and CD3+ lamina propria lymphocyte counts were not significantly different between the two groups. FC: Functional constipation; IELs: Intraepithelial lymphocytes.
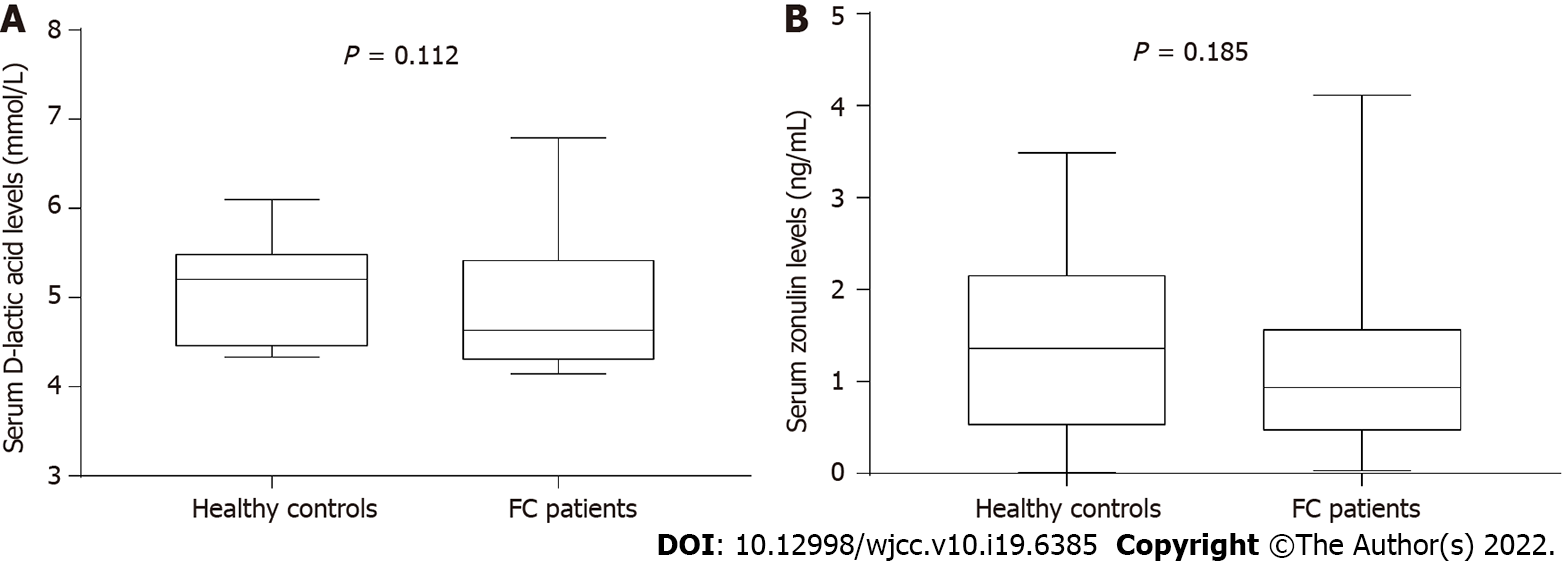
Figure 6 Serum D-lactic acid and zonulin levels in healthy controls and patients with functional constipation.
A: Serum D-lactic acid levels; B: Serum zonulin levels. No significant differences in D-lactic acid or zonulin levels were found between healthy controls and functional constipation patients. The box indicates the interquartile range; the line inside the box indicates the median value; the two whiskers indicate the maximum and minimum of the data. FC: Functional constipation.
- Citation: Wang JK, Wei W, Zhao DY, Wang HF, Zhang YL, Lei JP, Yao SK. Intestinal mucosal barrier in functional constipation: Dose it change? World J Clin Cases 2022; 10(19): 6385-6398
- URL: https://www.wjgnet.com/2307-8960/full/v10/i19/6385.htm
- DOI: https://dx.doi.org/10.12998/wjcc.v10.i19.6385


