Copyright
©The Author(s) 2022.
World J Clin Cases. Jun 26, 2022; 10(18): 6175-6183
Published online Jun 26, 2022. doi: 10.12998/wjcc.v10.i18.6175
Published online Jun 26, 2022. doi: 10.12998/wjcc.v10.i18.6175
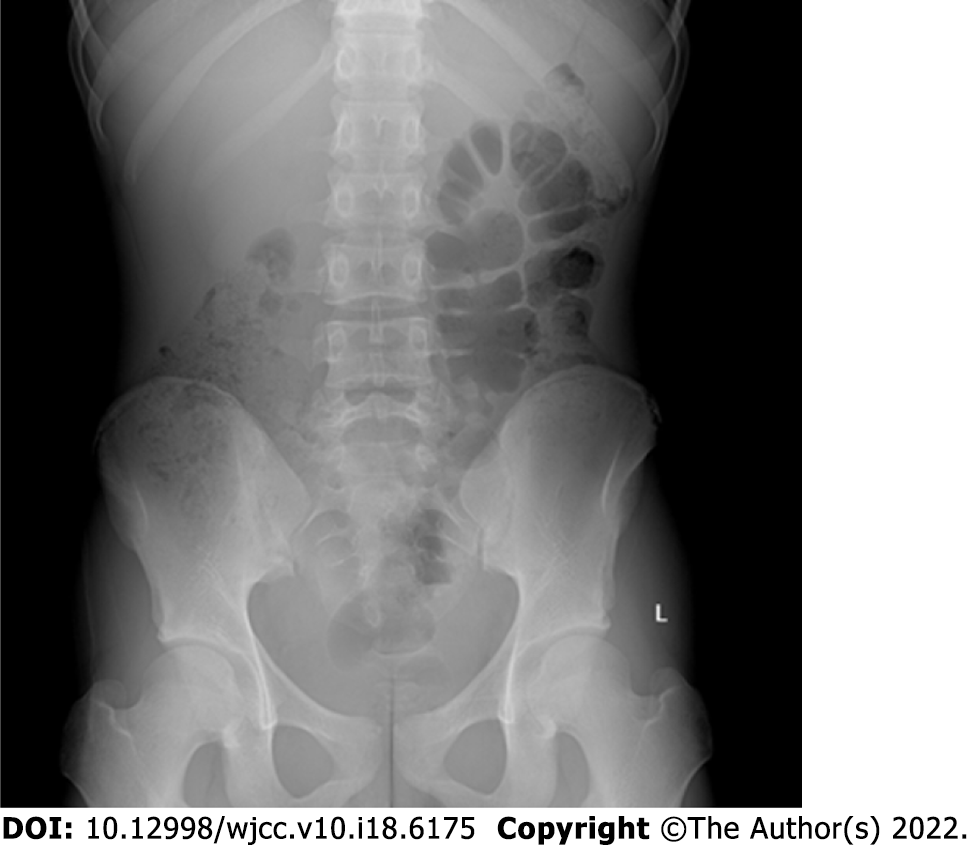
Figure 1 Digital radiography.
There was no obvious manifestation of intestinal obstruction.
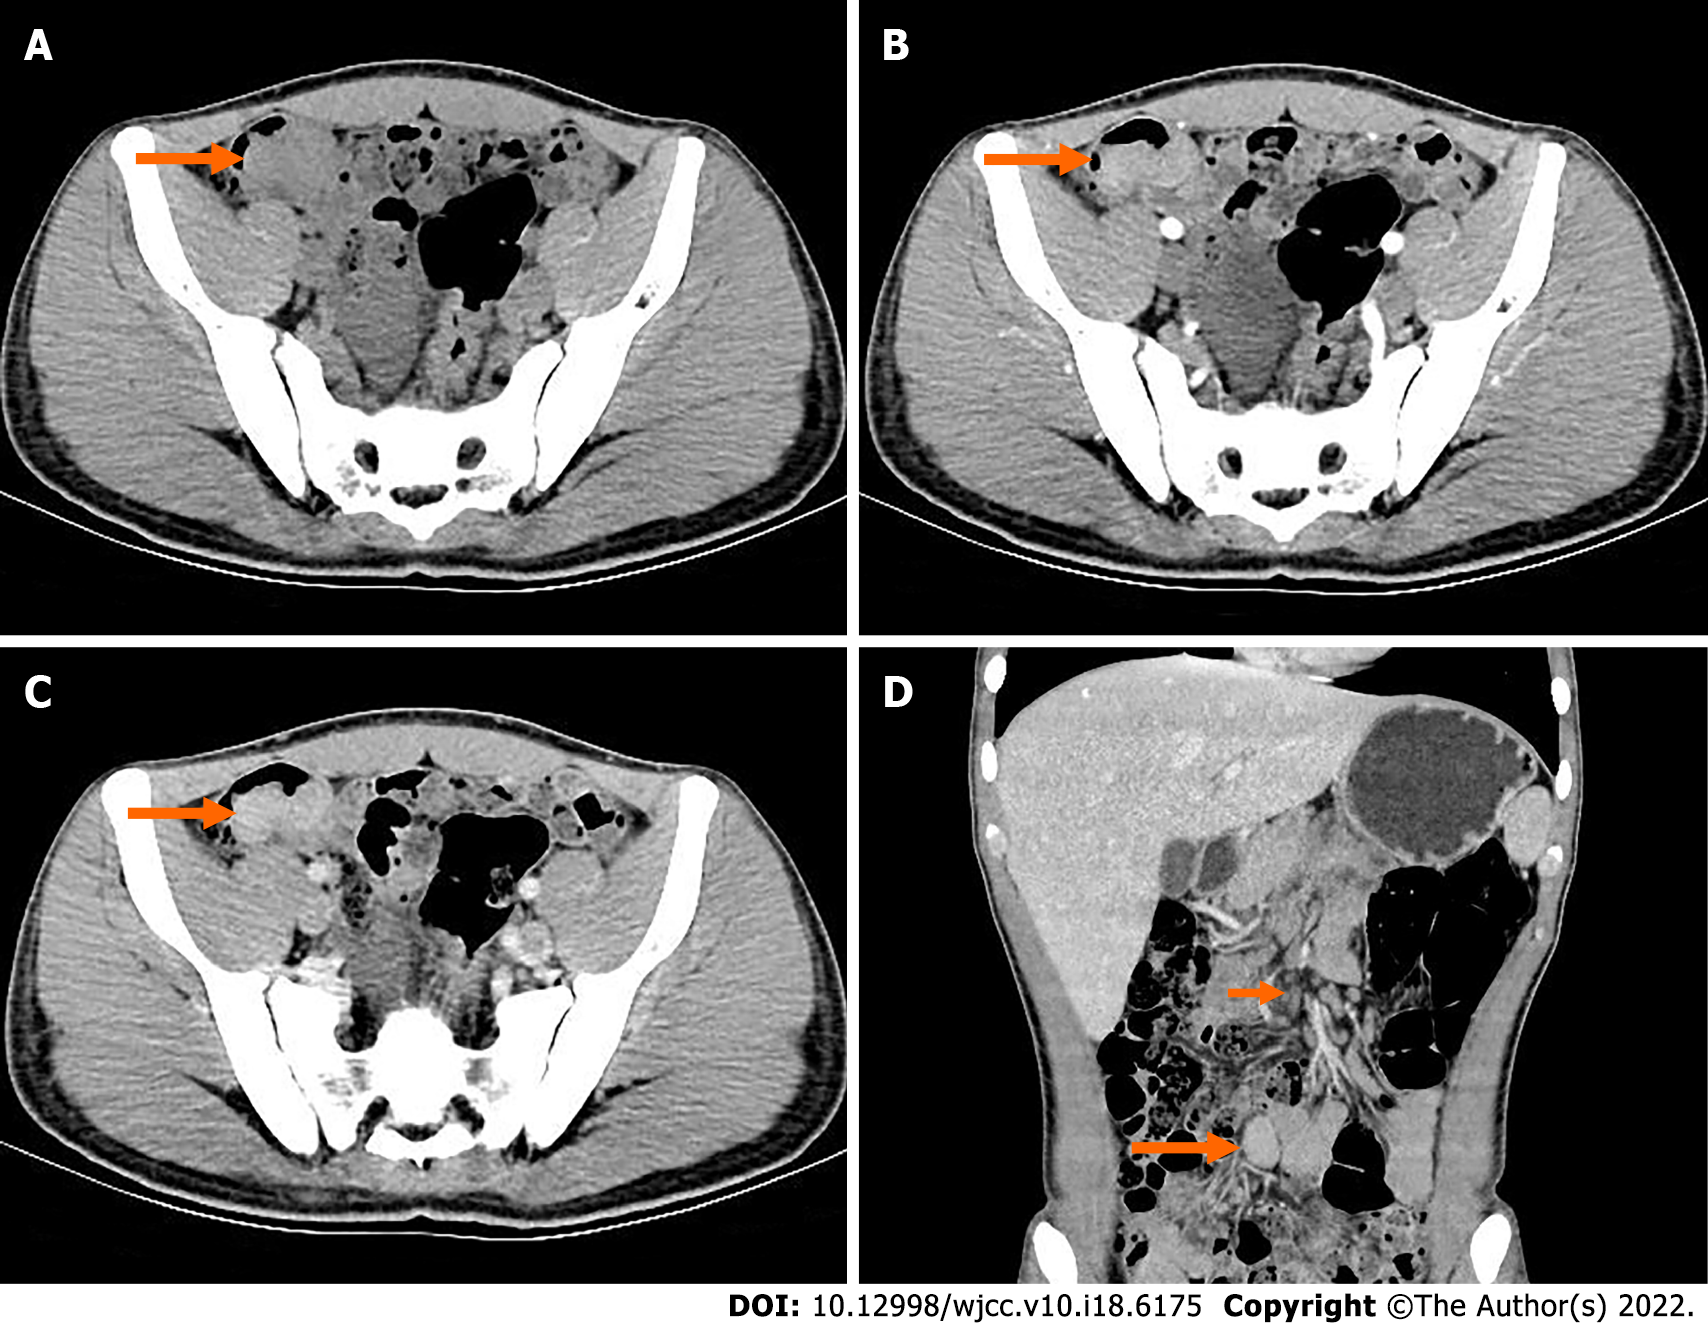
Figure 2 Preoperative computed tomography.
A: Obvious localized thickening of ileal wall in the right lower abdomen; B: The mass showed mild enhancement in the arterial phase; C: The mass showed moderate homogeneous progressive enhancement during the venous phase; D: The venous coronal images showed that the mass of the intestinal wall grew into the intestinal cavity; the intestinal cavity was obviously narrowed; and the lymph nodes at the root of the mesentery were enlarged.
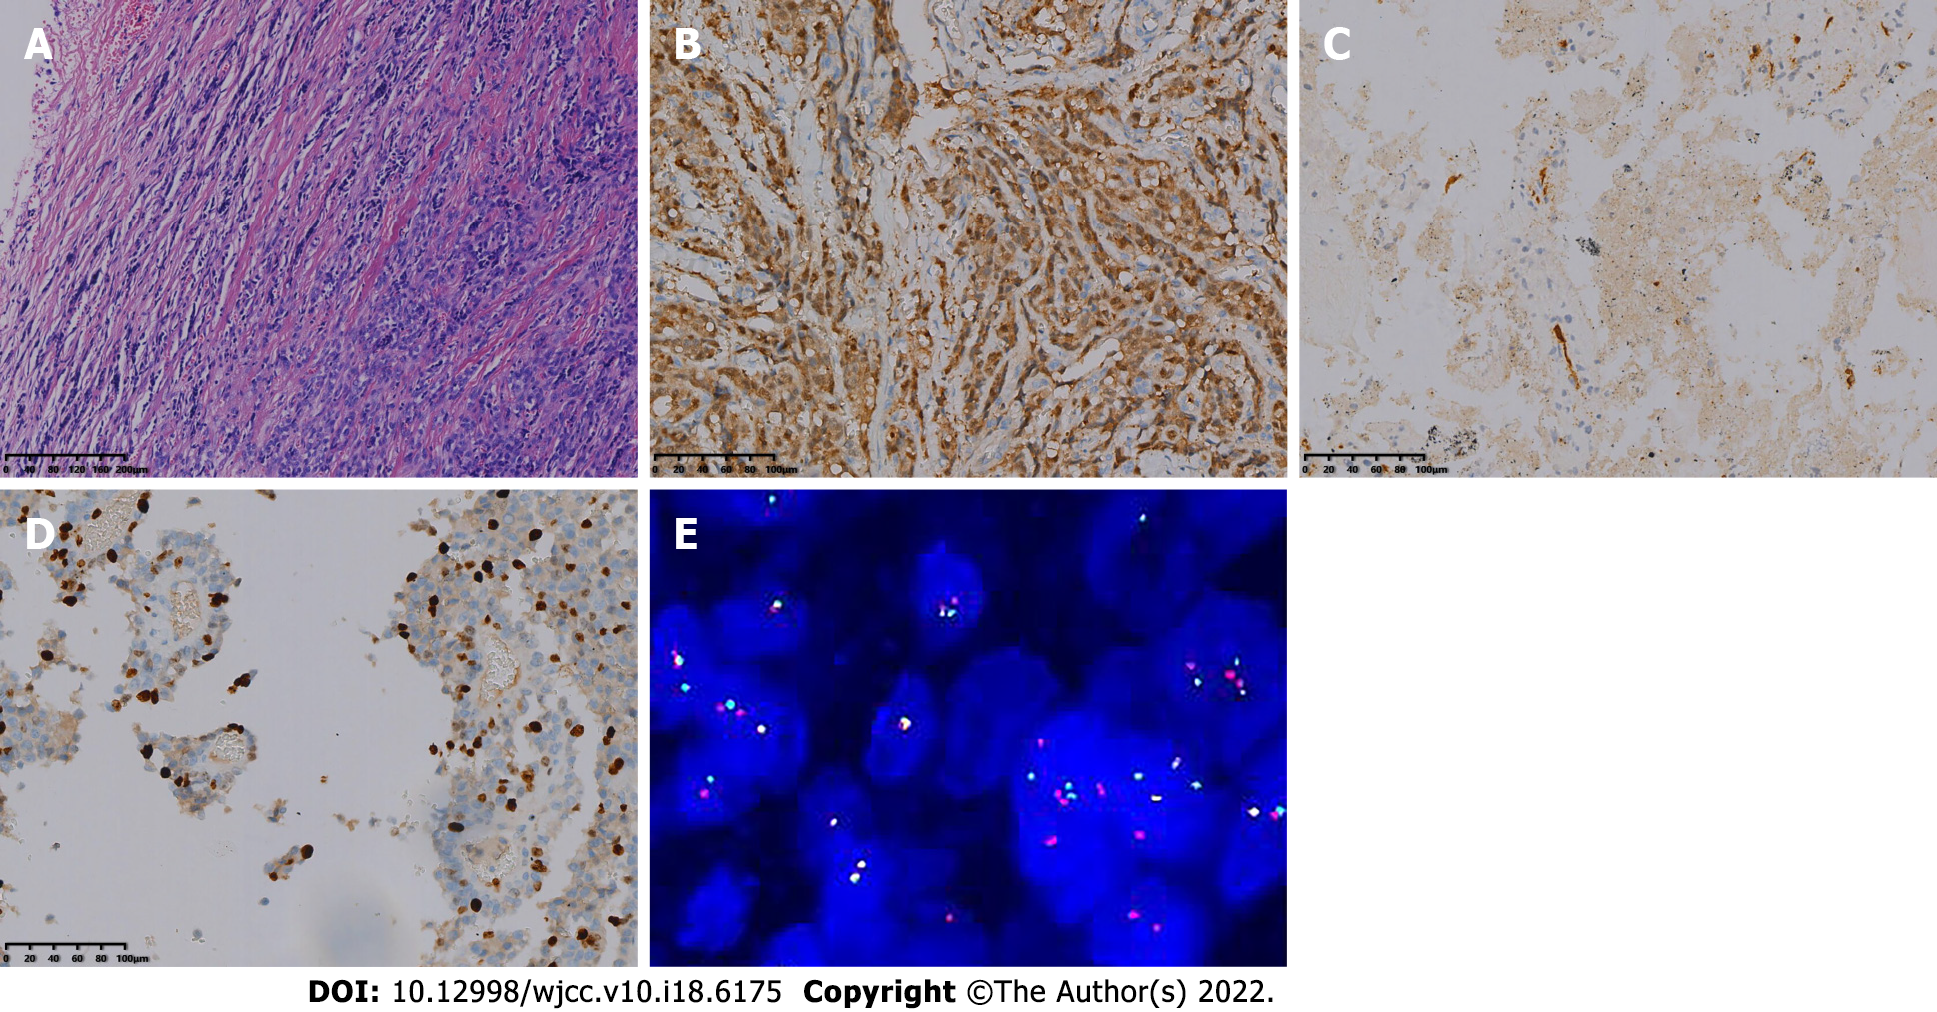
Figure 3 Optical microscopy and molecular pathology fluorescence in situ hybridization.
A: The tumor cells were diffusely arranged, separated by a slender fibrous diaphragm [hematoxylin and eosin (HE) 200×]; B: Immunohistochemical staining revealed S-100 positivity (Envision, 200×); C: Immunohistochemical staining revealed CD34 positivity (Envision, 200×); D: Immunohistochemical staining revealed 30% positivity for Ki-67 (Envision, 200×); E: total of 100 tumor cells were detected and counted, and the number of positive cells was 46%. EWSR1 gene breakage occurred in this case.
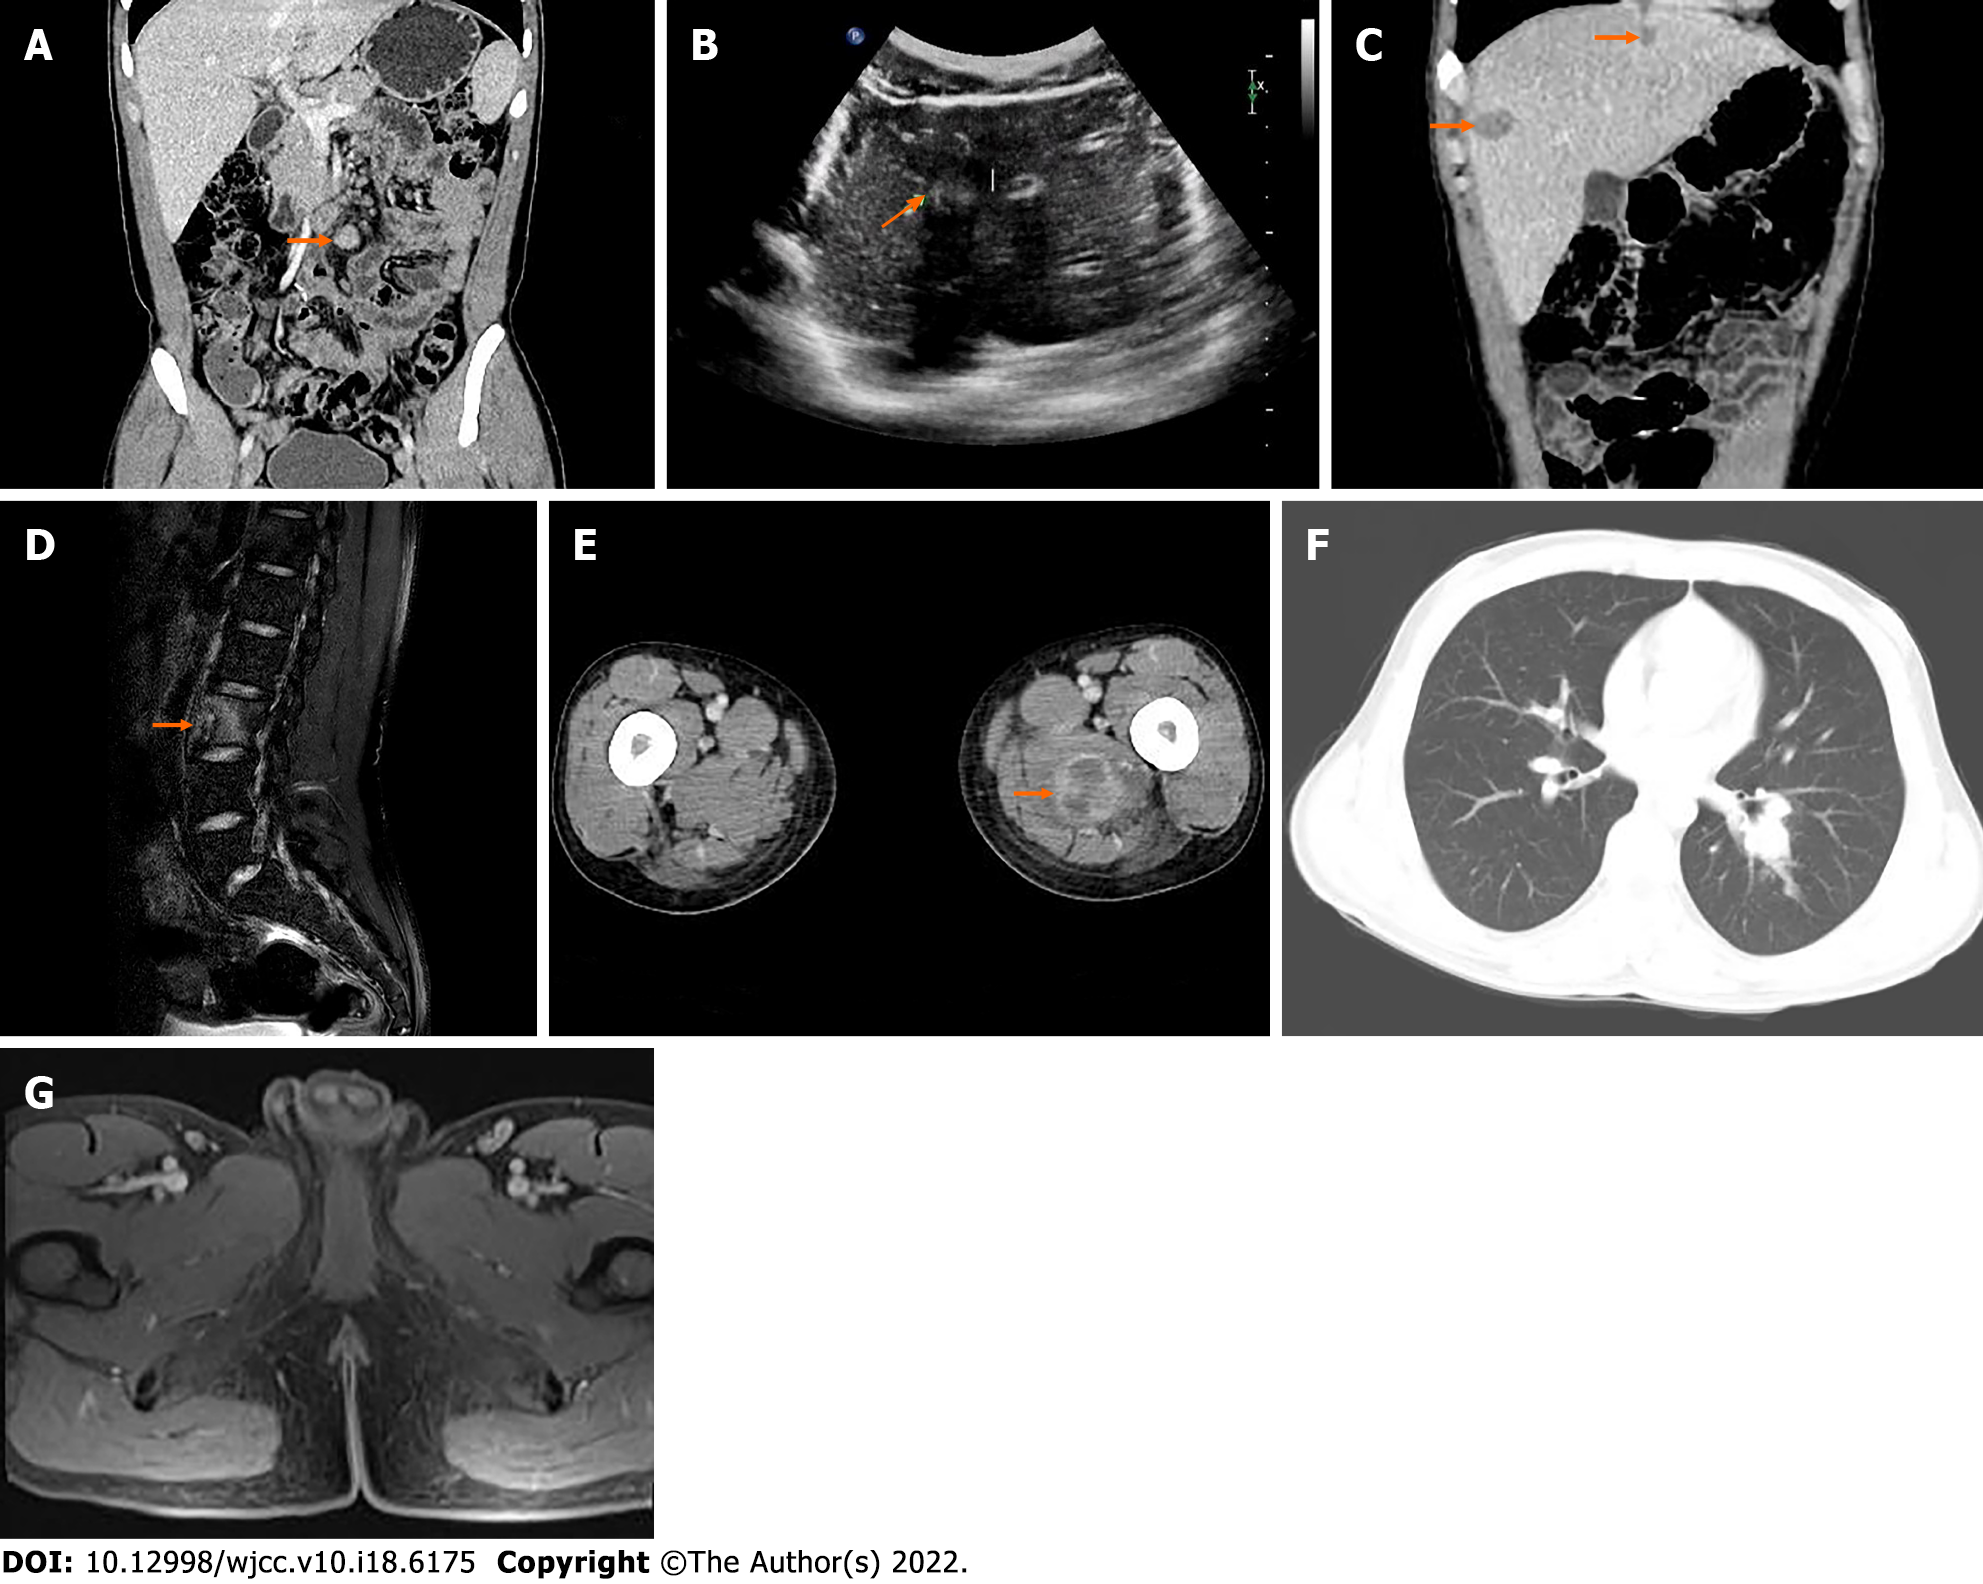
Figure 4 Images at 13 mo, 27 mo, 32 mo, 35 mo, 39 mo, and 43 mo after surgery.
A: Computed tomography 13 mo after surgery, multiple enlarged lymph nodes were seen at the root of the mesentery; B: Ultrasonography 27 mo after surgery, there was a higher echo with a clear boundary in the liver, and the internal echo was not uniform; C: Computed tomography 32 mo after surgery, there were multiple patchy and nodular low-density space-occupying lesions in the liver, the boundary was not clear, the ring was slightly enhanced, but there was no obvious enhancement in the center; D: Magnetic resonance imaging 35 mo after surgery, L3 vertebrae showed high signal intensity on turbo inversion recovery magnitude fat pressing sequence; E: Computed tomography 35 mo after surgery, the mass on the inner side of the left thigh showed inhomogeneous circular enhancement and the boundary was unclear; F: Computed tomography 39 mo after surgery, there were multiple small nodules in both lungs, the larger of which was located in the lower lobe of the left lung, with a diameter of ~1.9 cm; G: Magnetic resonance imaging 43 mo after surgery, multiple mild enhanced signals in bilateral inguinal area and adjacent iliac vessels.
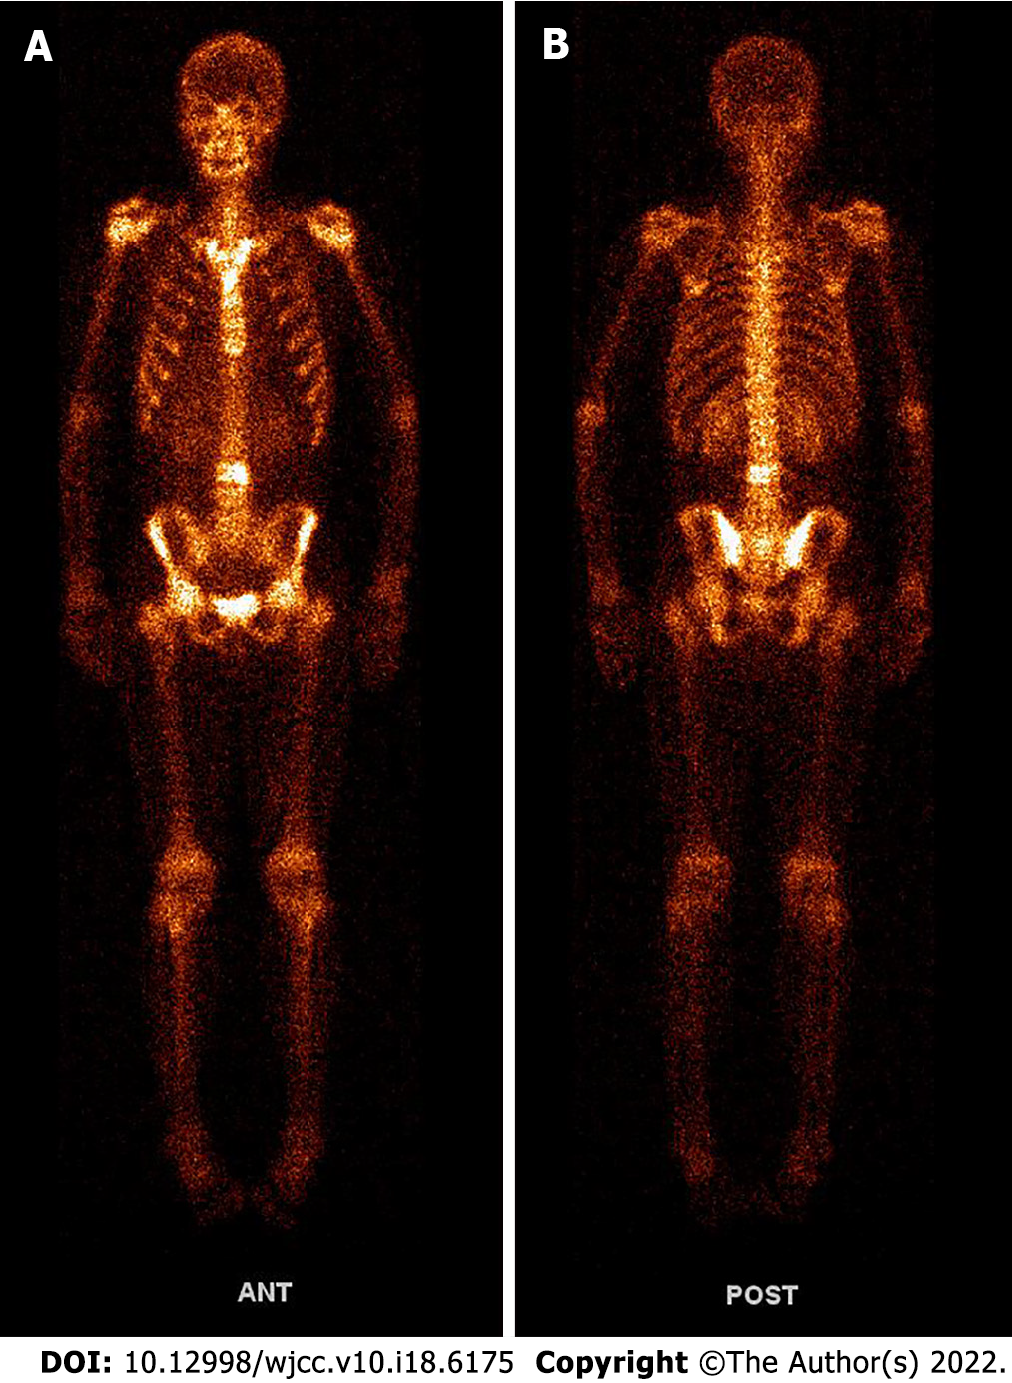
Figure 5 Whole-body 99mTc-methylene diphosphonate bone scan imaging 35 mo after surgery.
A: Anterior posterior position image; B: Posterior anterior position image.
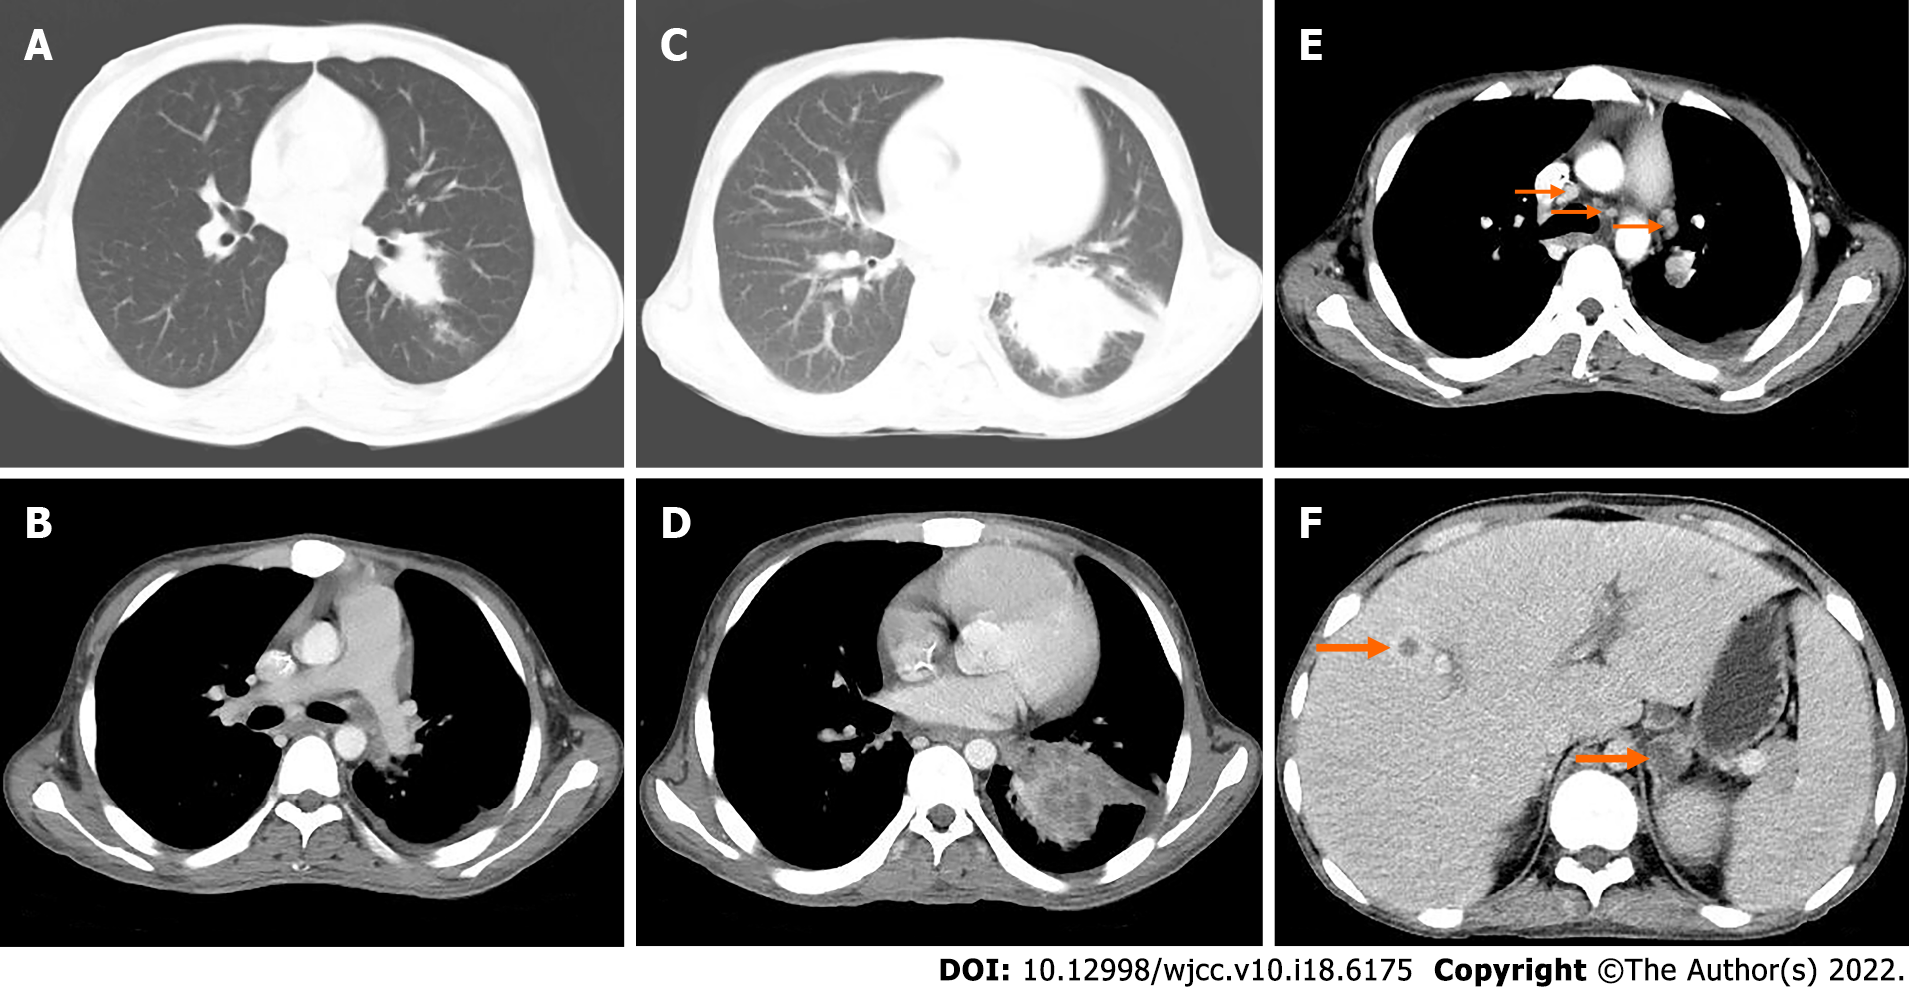
Figure 6 Computed tomography 43 mo (A-B) and 50 mo (C-F) after surgery.
A: The nodule of the lower lobe of the left lung was obviously enlarged, and the boundary was not clear. The size was about 2.5 cm × 3.5 cm; B: The soft tissue nodule of the left pleura showed slight enhancement, with a small amount of fluid density in the left pleural cavity; C: The irregular mass in the lower lobe of the left lung was significantly larger than before, with a size of about 8.2 cm × 5.7 cm; D: After enhancement, the focus showed moderate enhancement; E: Multiple enlarged lymph nodes in mediastinum, left hilum and left axilla; F: Low-density soft tissue mass of the left adrenal gland with unclear boundary and moderate circular enhancement.
- Citation: Huang WP, Li LM, Gao JB. Postoperative multiple metastasis of clear cell sarcoma-like tumor of the gastrointestinal tract in adolescent: A case report. World J Clin Cases 2022; 10(18): 6175-6183
- URL: https://www.wjgnet.com/2307-8960/full/v10/i18/6175.htm
- DOI: https://dx.doi.org/10.12998/wjcc.v10.i18.6175


