Copyright
©The Author(s) 2022.
World J Clin Cases. Jun 26, 2022; 10(18): 6119-6127
Published online Jun 26, 2022. doi: 10.12998/wjcc.v10.i18.6119
Published online Jun 26, 2022. doi: 10.12998/wjcc.v10.i18.6119
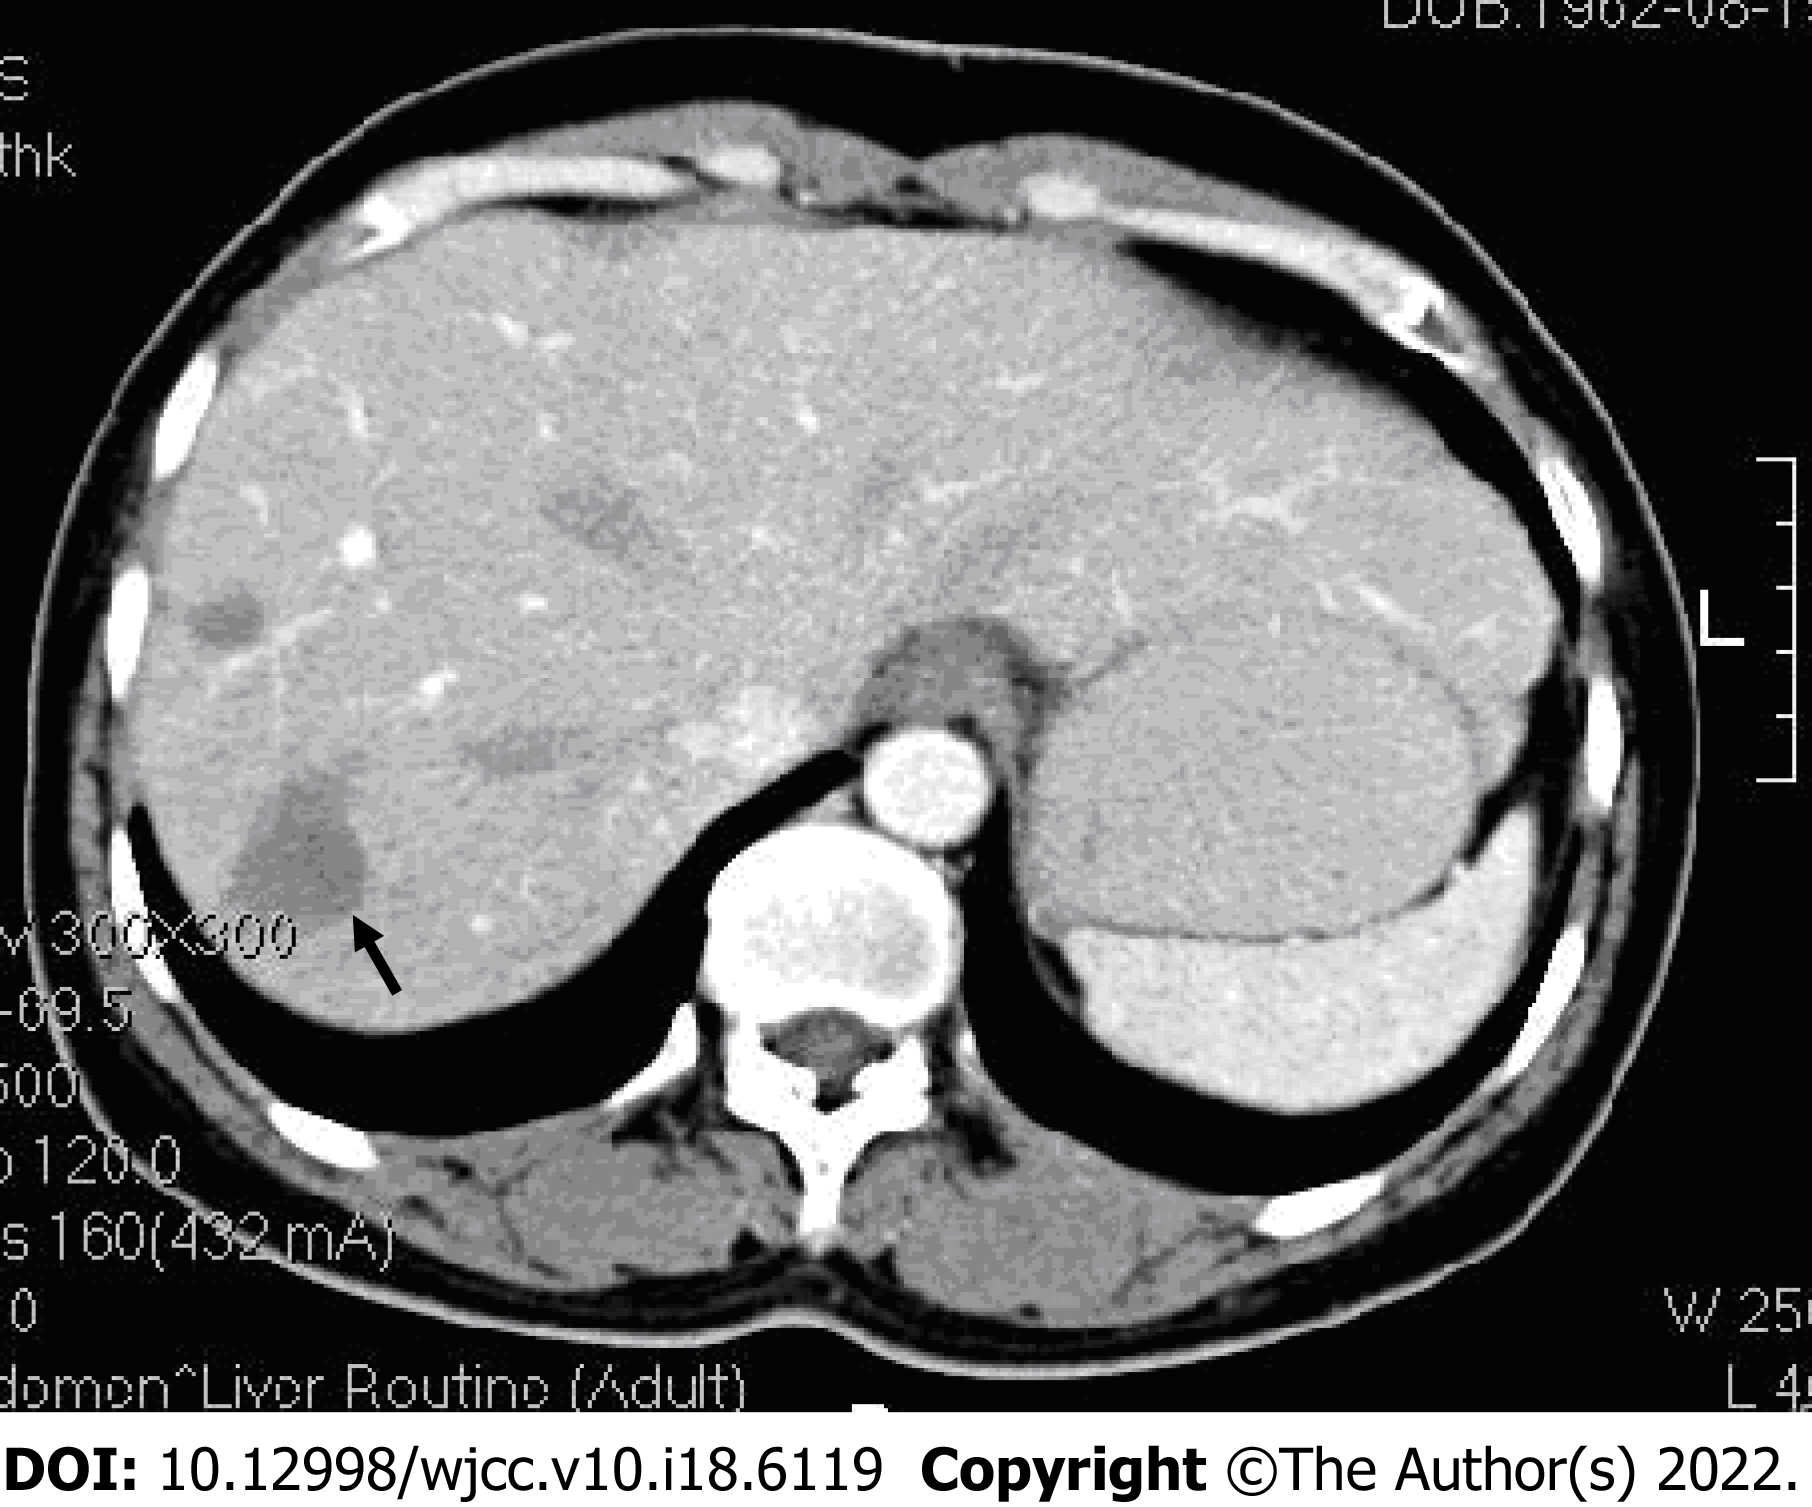
Figure 1 Contrast-enhanced computed tomography.
Multiple low-density lesions (black arrow) with mild-moderate peripheral enhancement are seen in the right lobe of the liver.
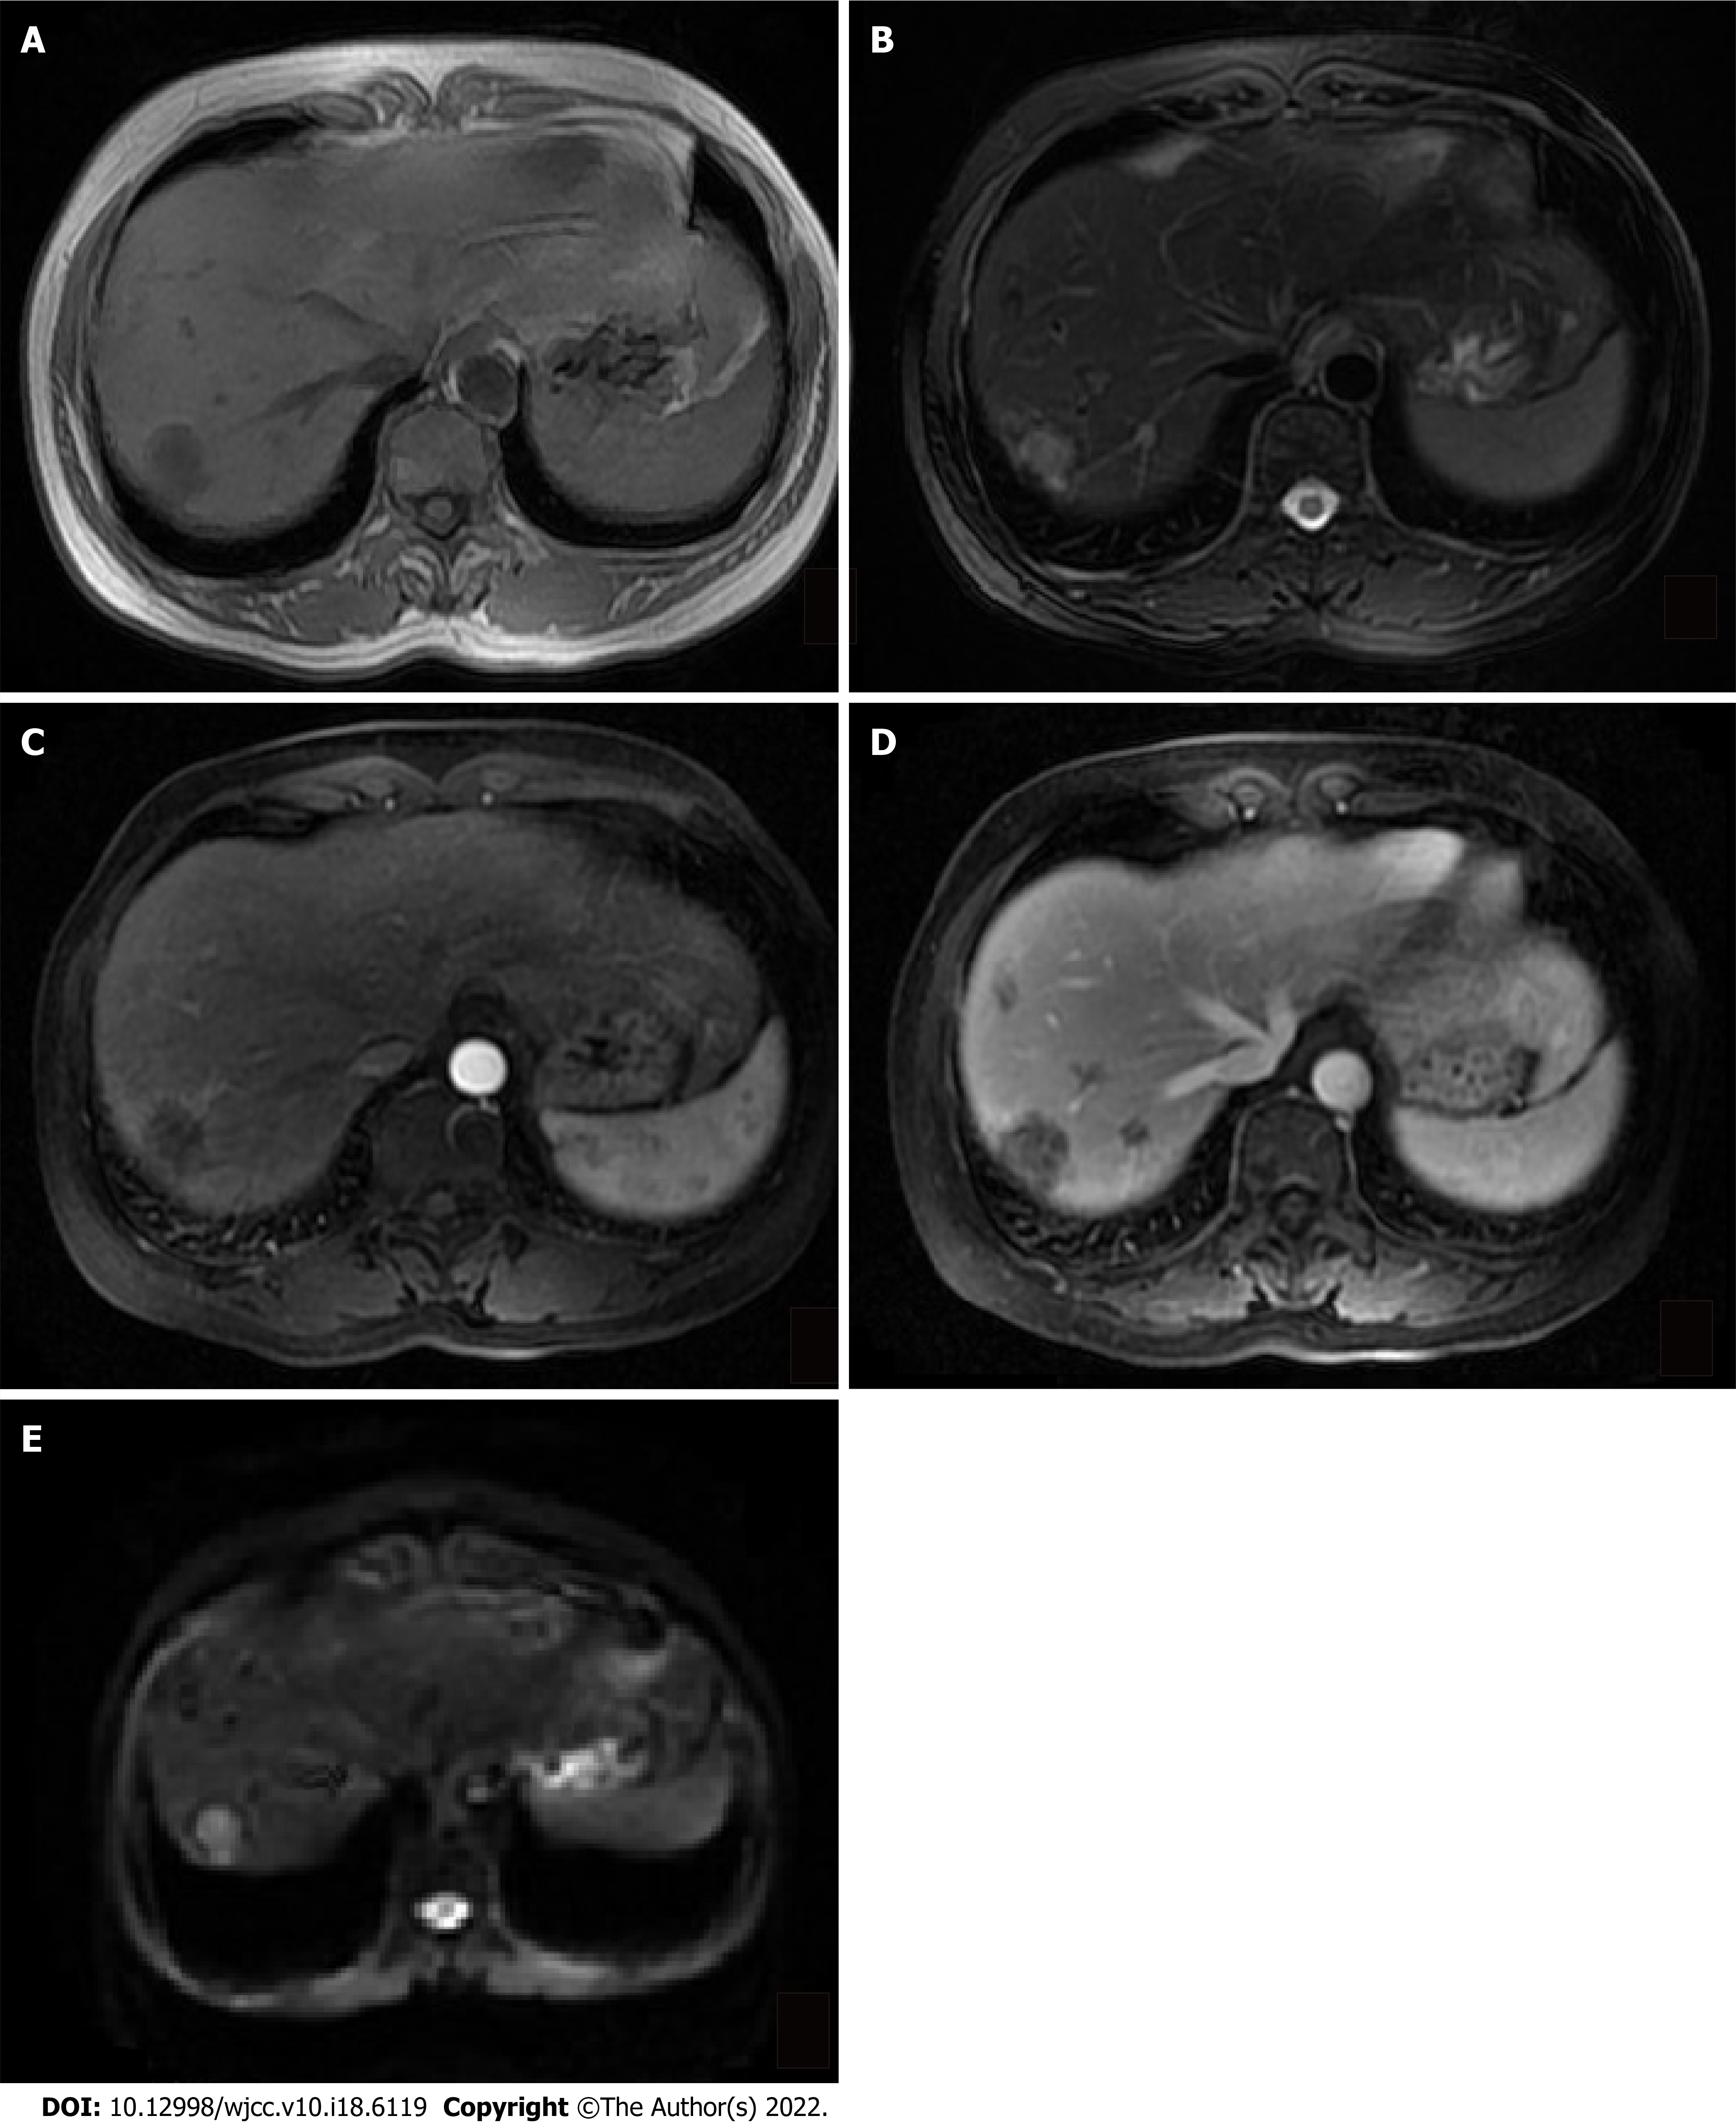
Figure 2 Magnetic resonance weighted image.
A: T1-weighted image shows low signal ovoid lesions in the right lobe of liver; B: The lesions have a heterogeneous high signal in the T2-weighted image; C: The largest lesion in the right lobe is mildly heterogeneous with peripheral enhancement and an arterial contrast enhancement pattern; D: Peripheral enhancement of lesions is increased in spots visible in a venous contrast enhancement pattern; E: Lesions show diffusion restriction on a diffusion-weighted image.
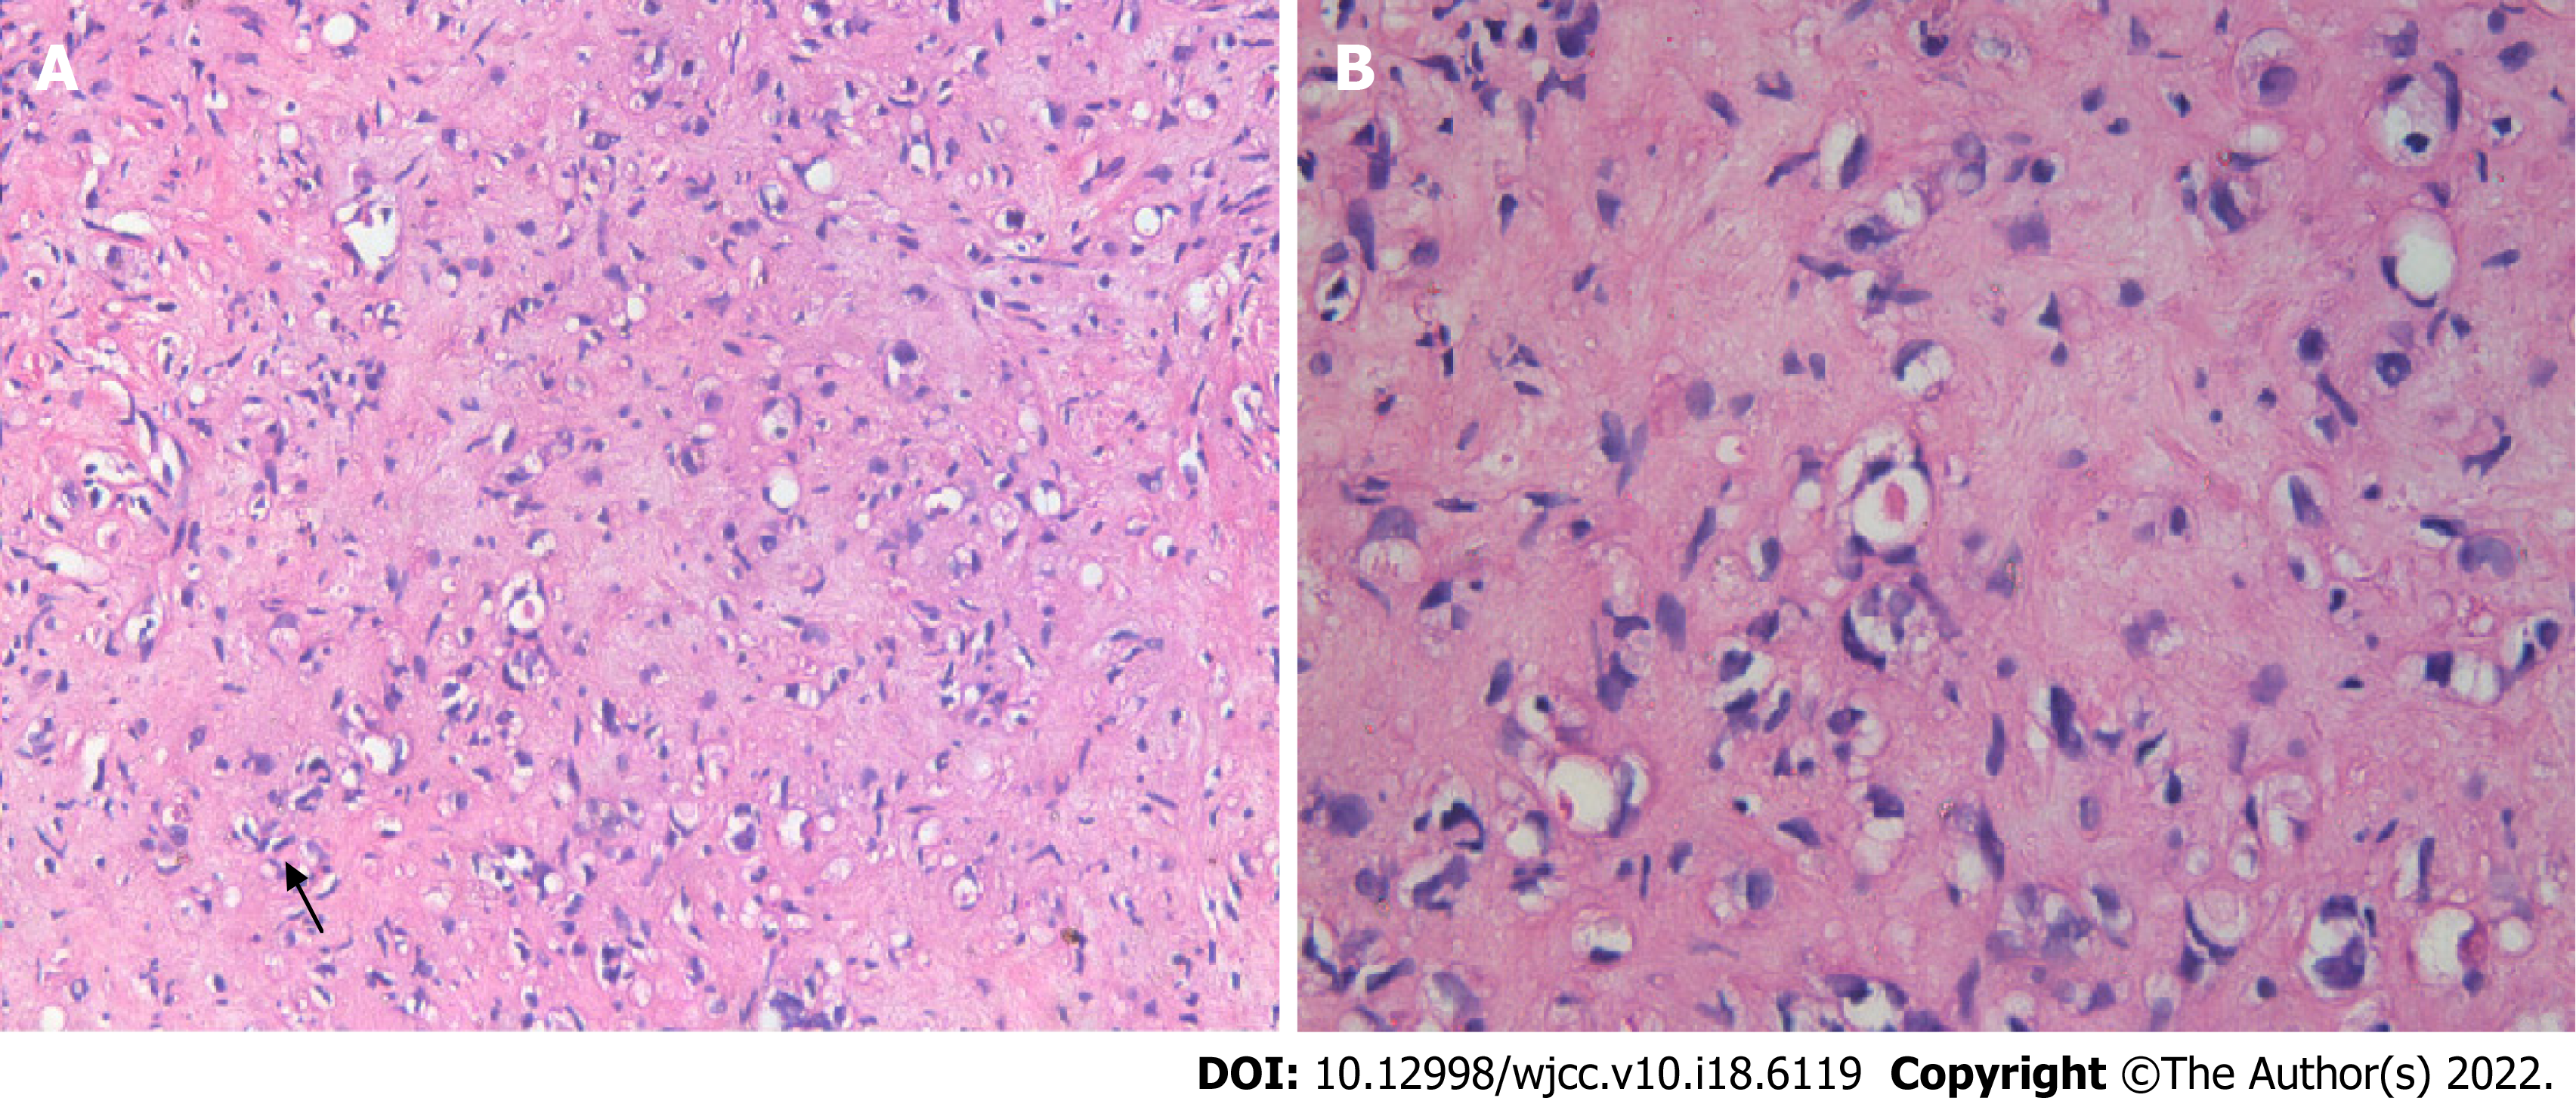
Figure 3 Liver biopsy.
A: Mildly heteromorphic spindle cells (dendritic cells) with interdigitating processes (hematoxylin and eosin, 200 ×); B: Intracellular vascular lumina containing a red blood cell (black arrow) (hematoxylin and eosin, 400 ×).
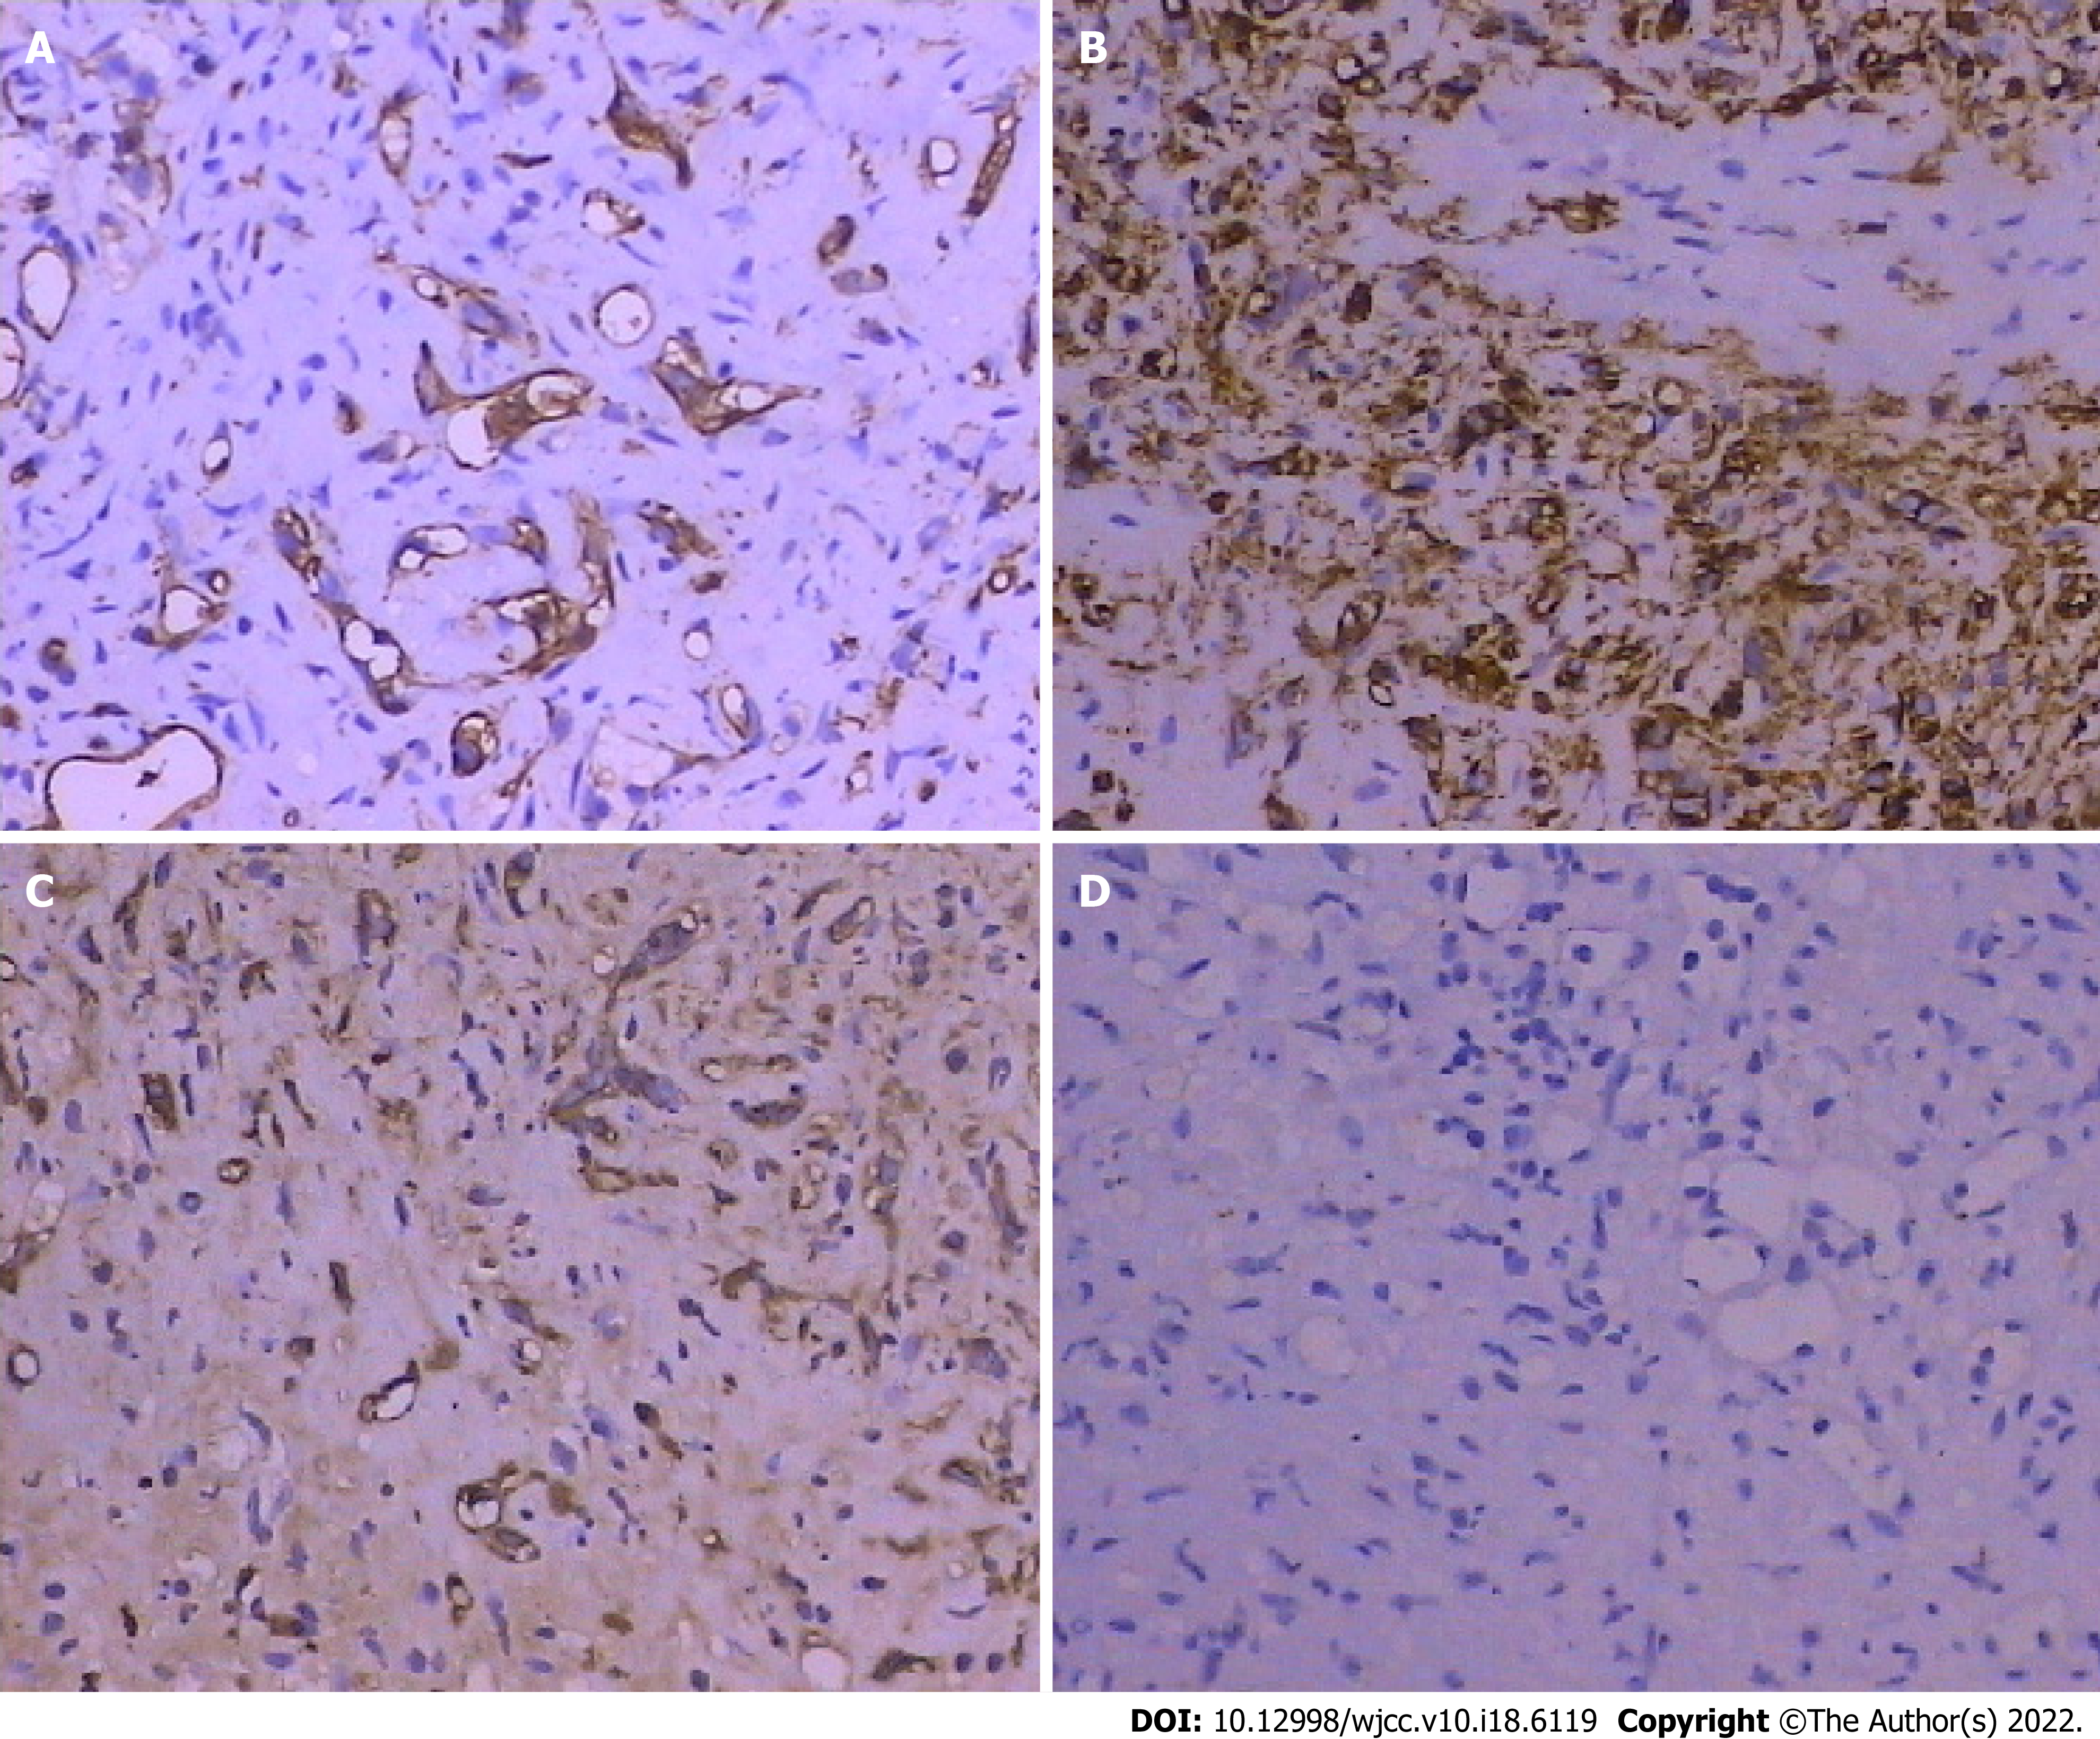
Figure 4 Histopathology, immunostaining of tumor cells.
A: Anti-CD31+ (200 ×); B: Anti-CD34+ (200 ×); C: Anti-factor VIII-related antigen+ (200 ×); D: Anti-CK− (Pan) (200 ×).
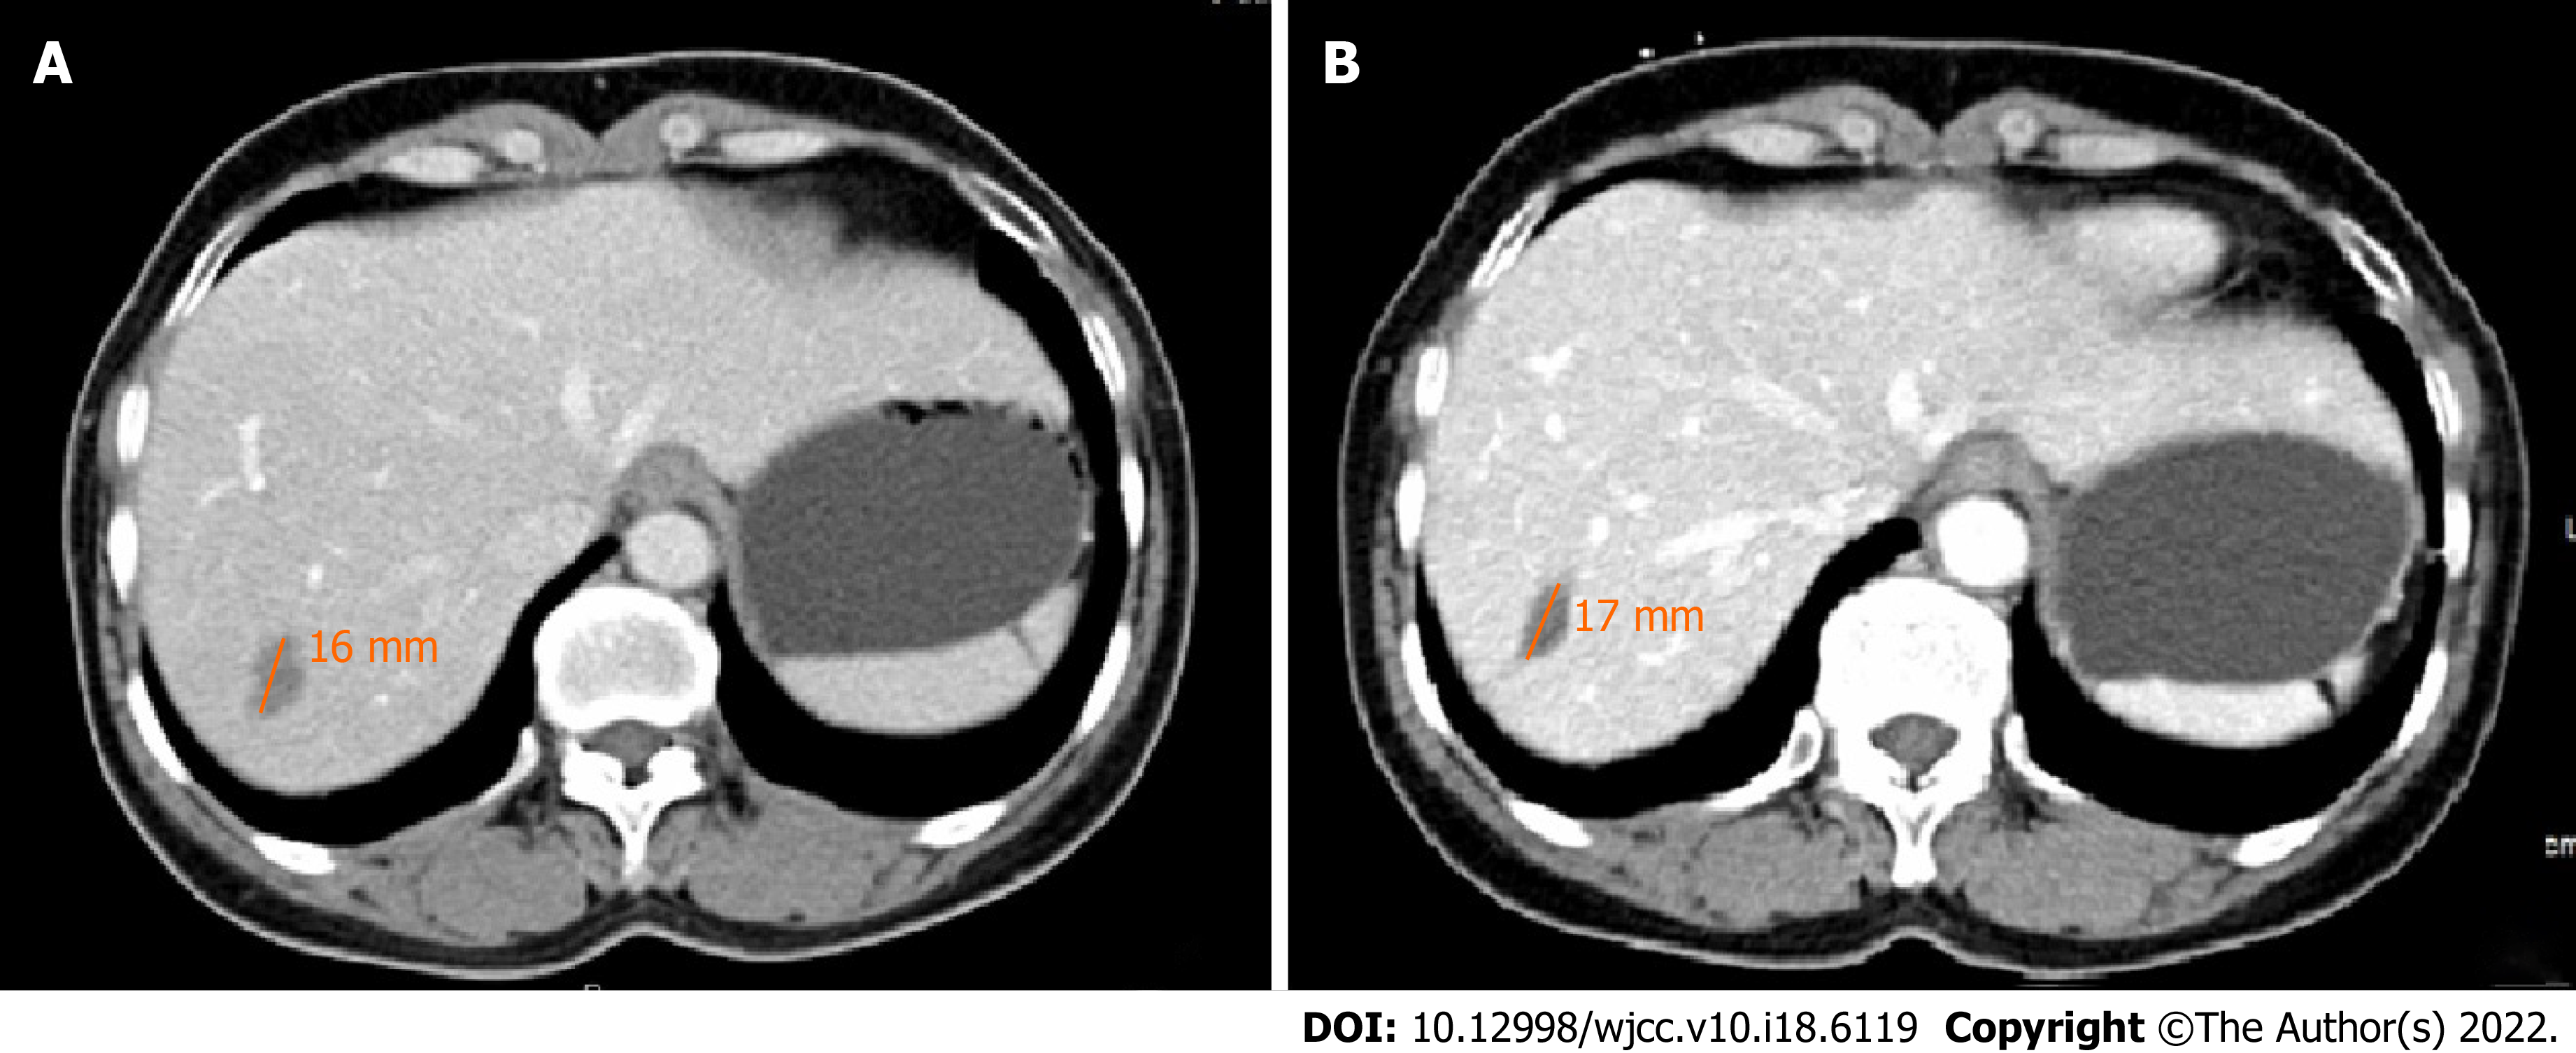
Figure 5 Contrast-enhanced follow-up computed tomography scans.
A: After 4 years, diameter of the low-density lesion was 16 mm; B: After 12 years, diameter of the low-density lesion was 17 mm.
- Citation: Mo WF, Tong YL. Hepatic epithelioid hemangioendothelioma after thirteen years’ follow-up: A case report and review of literature. World J Clin Cases 2022; 10(18): 6119-6127
- URL: https://www.wjgnet.com/2307-8960/full/v10/i18/6119.htm
- DOI: https://dx.doi.org/10.12998/wjcc.v10.i18.6119


