Copyright
©The Author(s) 2022.
World J Clin Cases. Jun 26, 2022; 10(18): 6091-6104
Published online Jun 26, 2022. doi: 10.12998/wjcc.v10.i18.6091
Published online Jun 26, 2022. doi: 10.12998/wjcc.v10.i18.6091
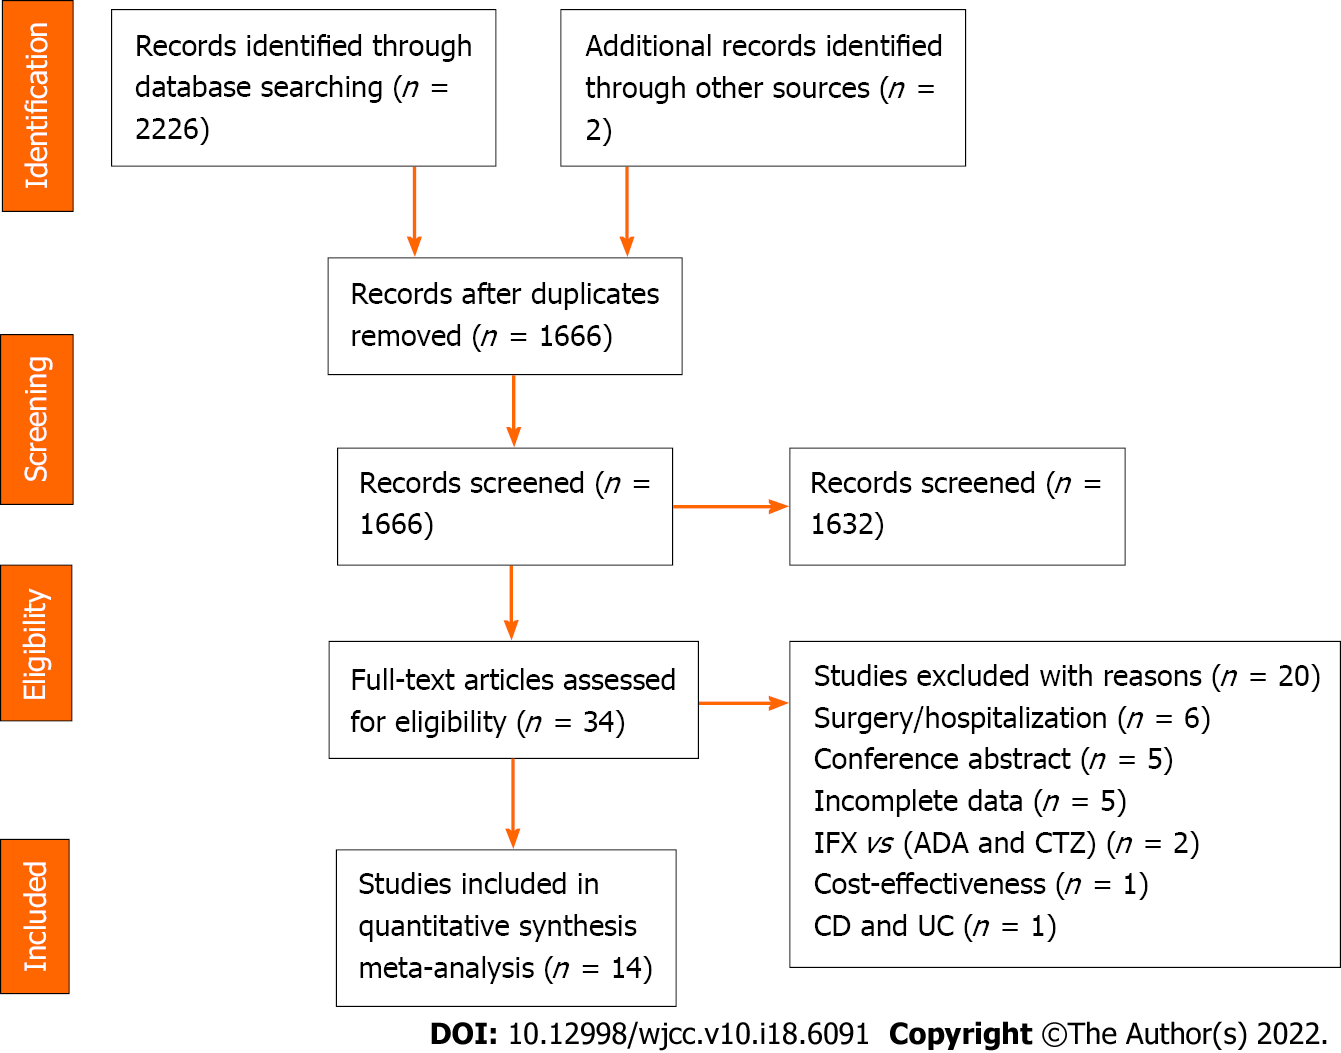
Figure 1 Flow chart for literature search.
IFX: Infliximab; ADA: Adalimumab; CTZ: Certolizumab; CD: Crohn’s disease; UC: Ulcerative colitis.
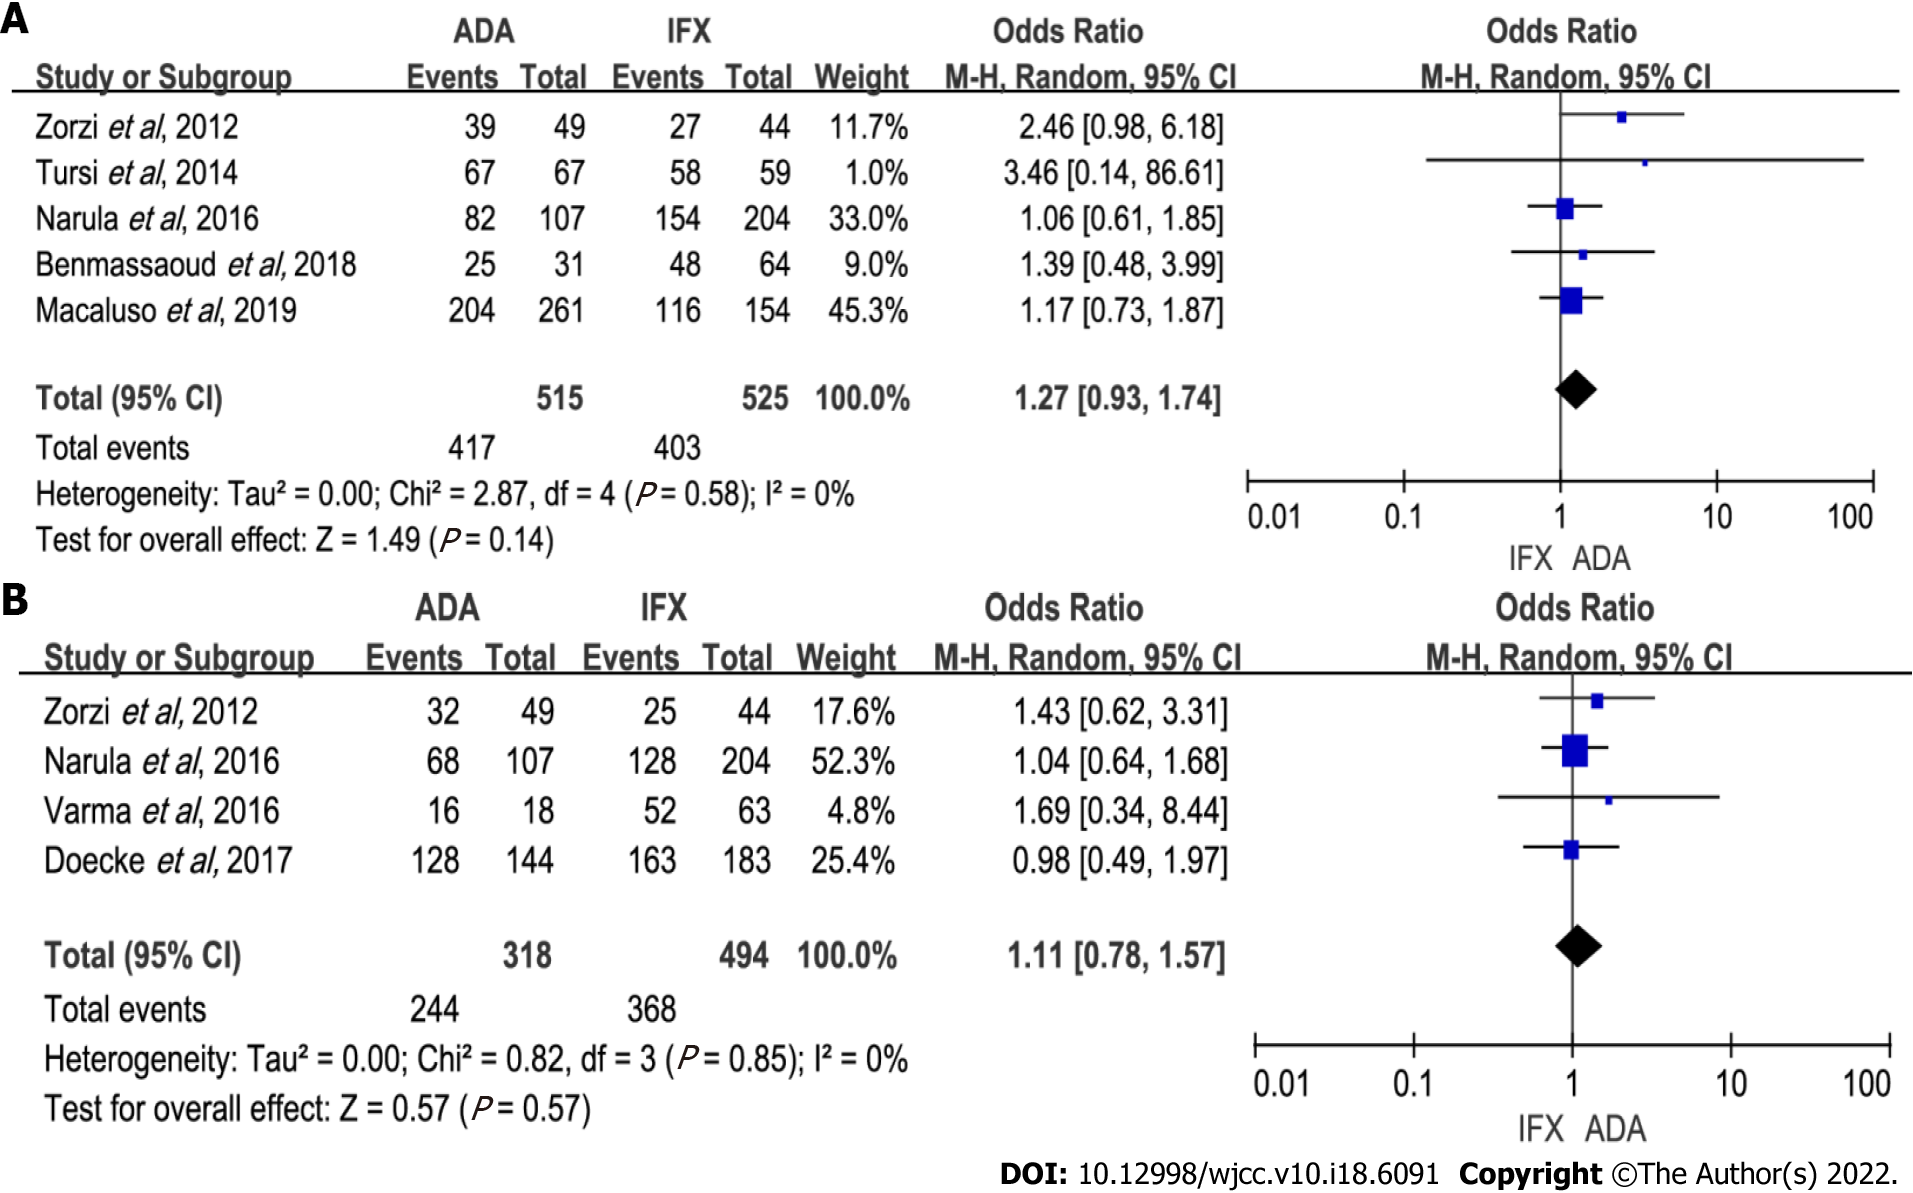
Figure 2 Forest plot for induction efficacy comparing adalimumab and infliximab.
A: Induction of response; B: Induction of remission. ADA: Adalimumab; IFX: Infliximab; CI: Confidence interval.
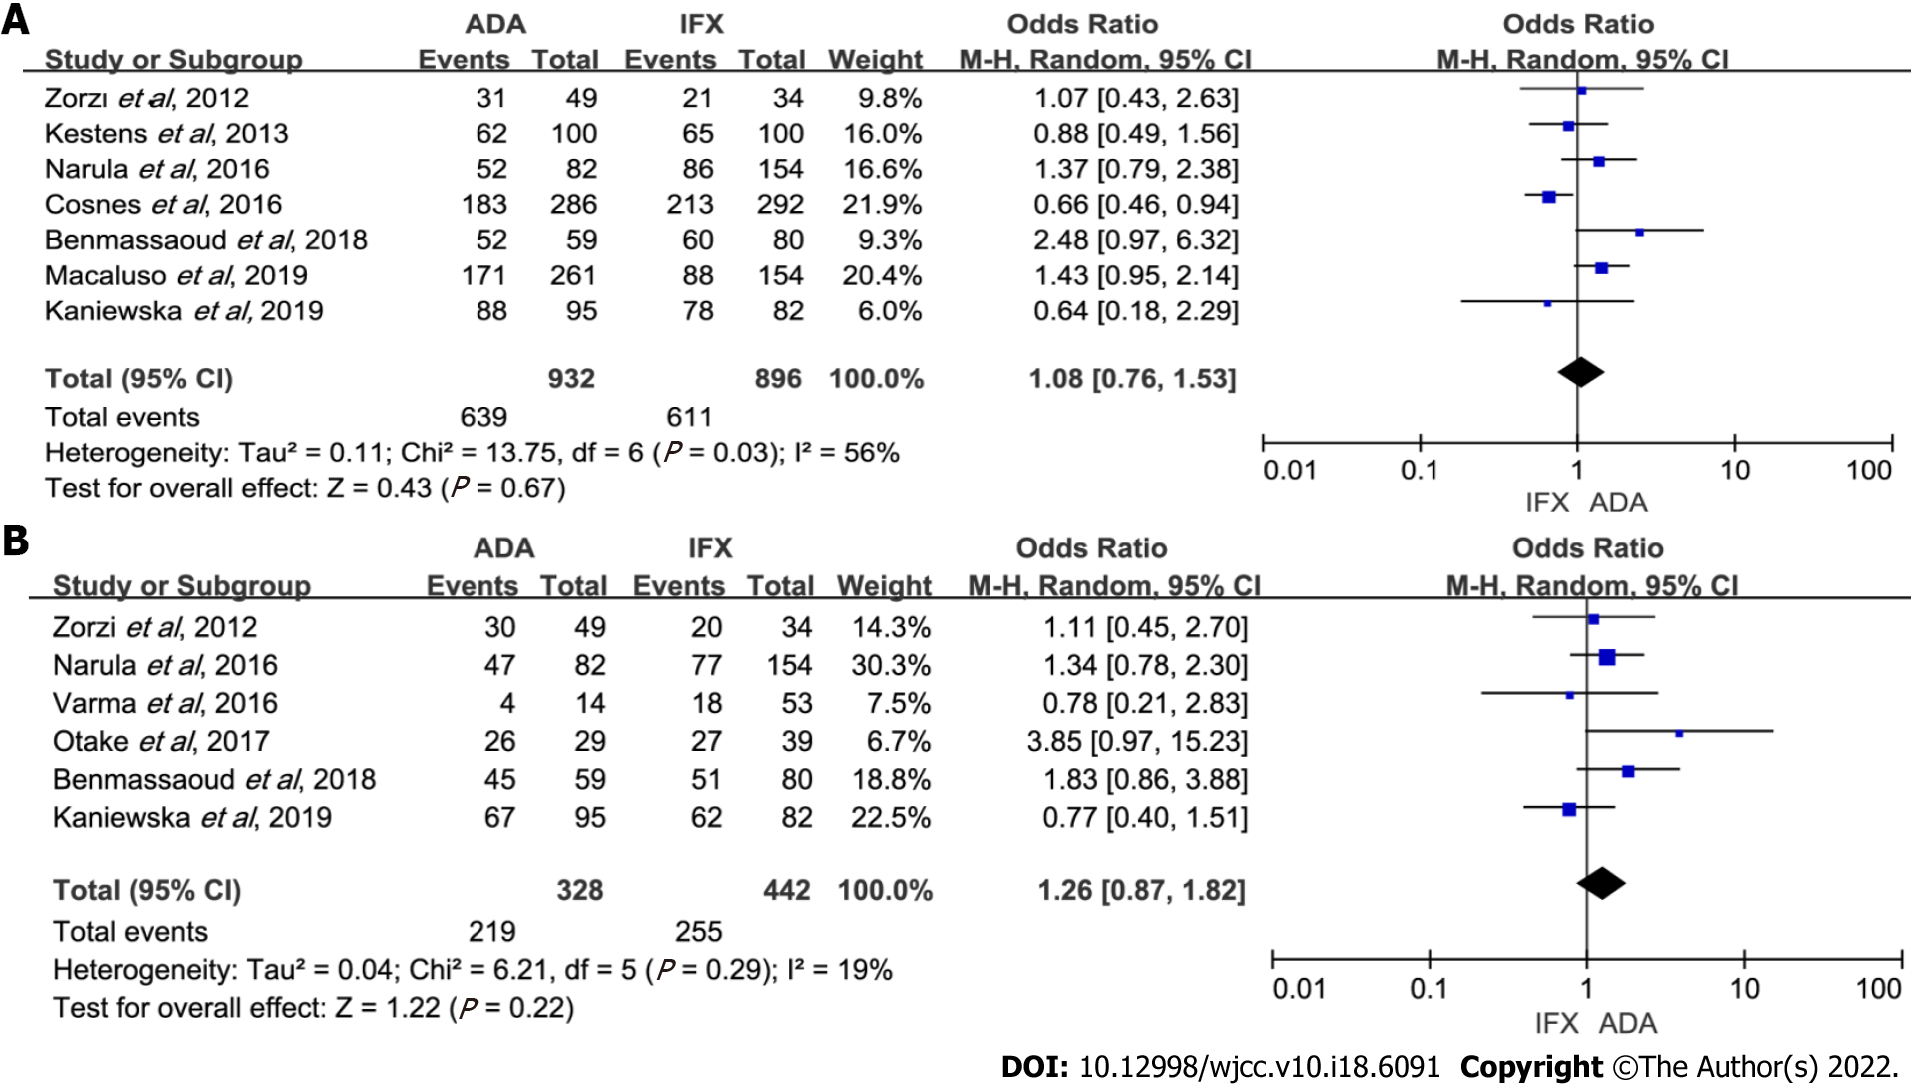
Figure 3 Forest plot for maintenance efficacy comparing adalimumab and infliximab.
A: Maintenance of response; B: Maintenance of remission. ADA: Adalimumab; IFX: Infliximab; CI: Confidence interval.
Figure 4 Forest plot comparing infliximab and adalimumab for the incidence of secondary loss of response.
ADA: Adalimumab; IFX: Infliximab; CI: Confidence interval.
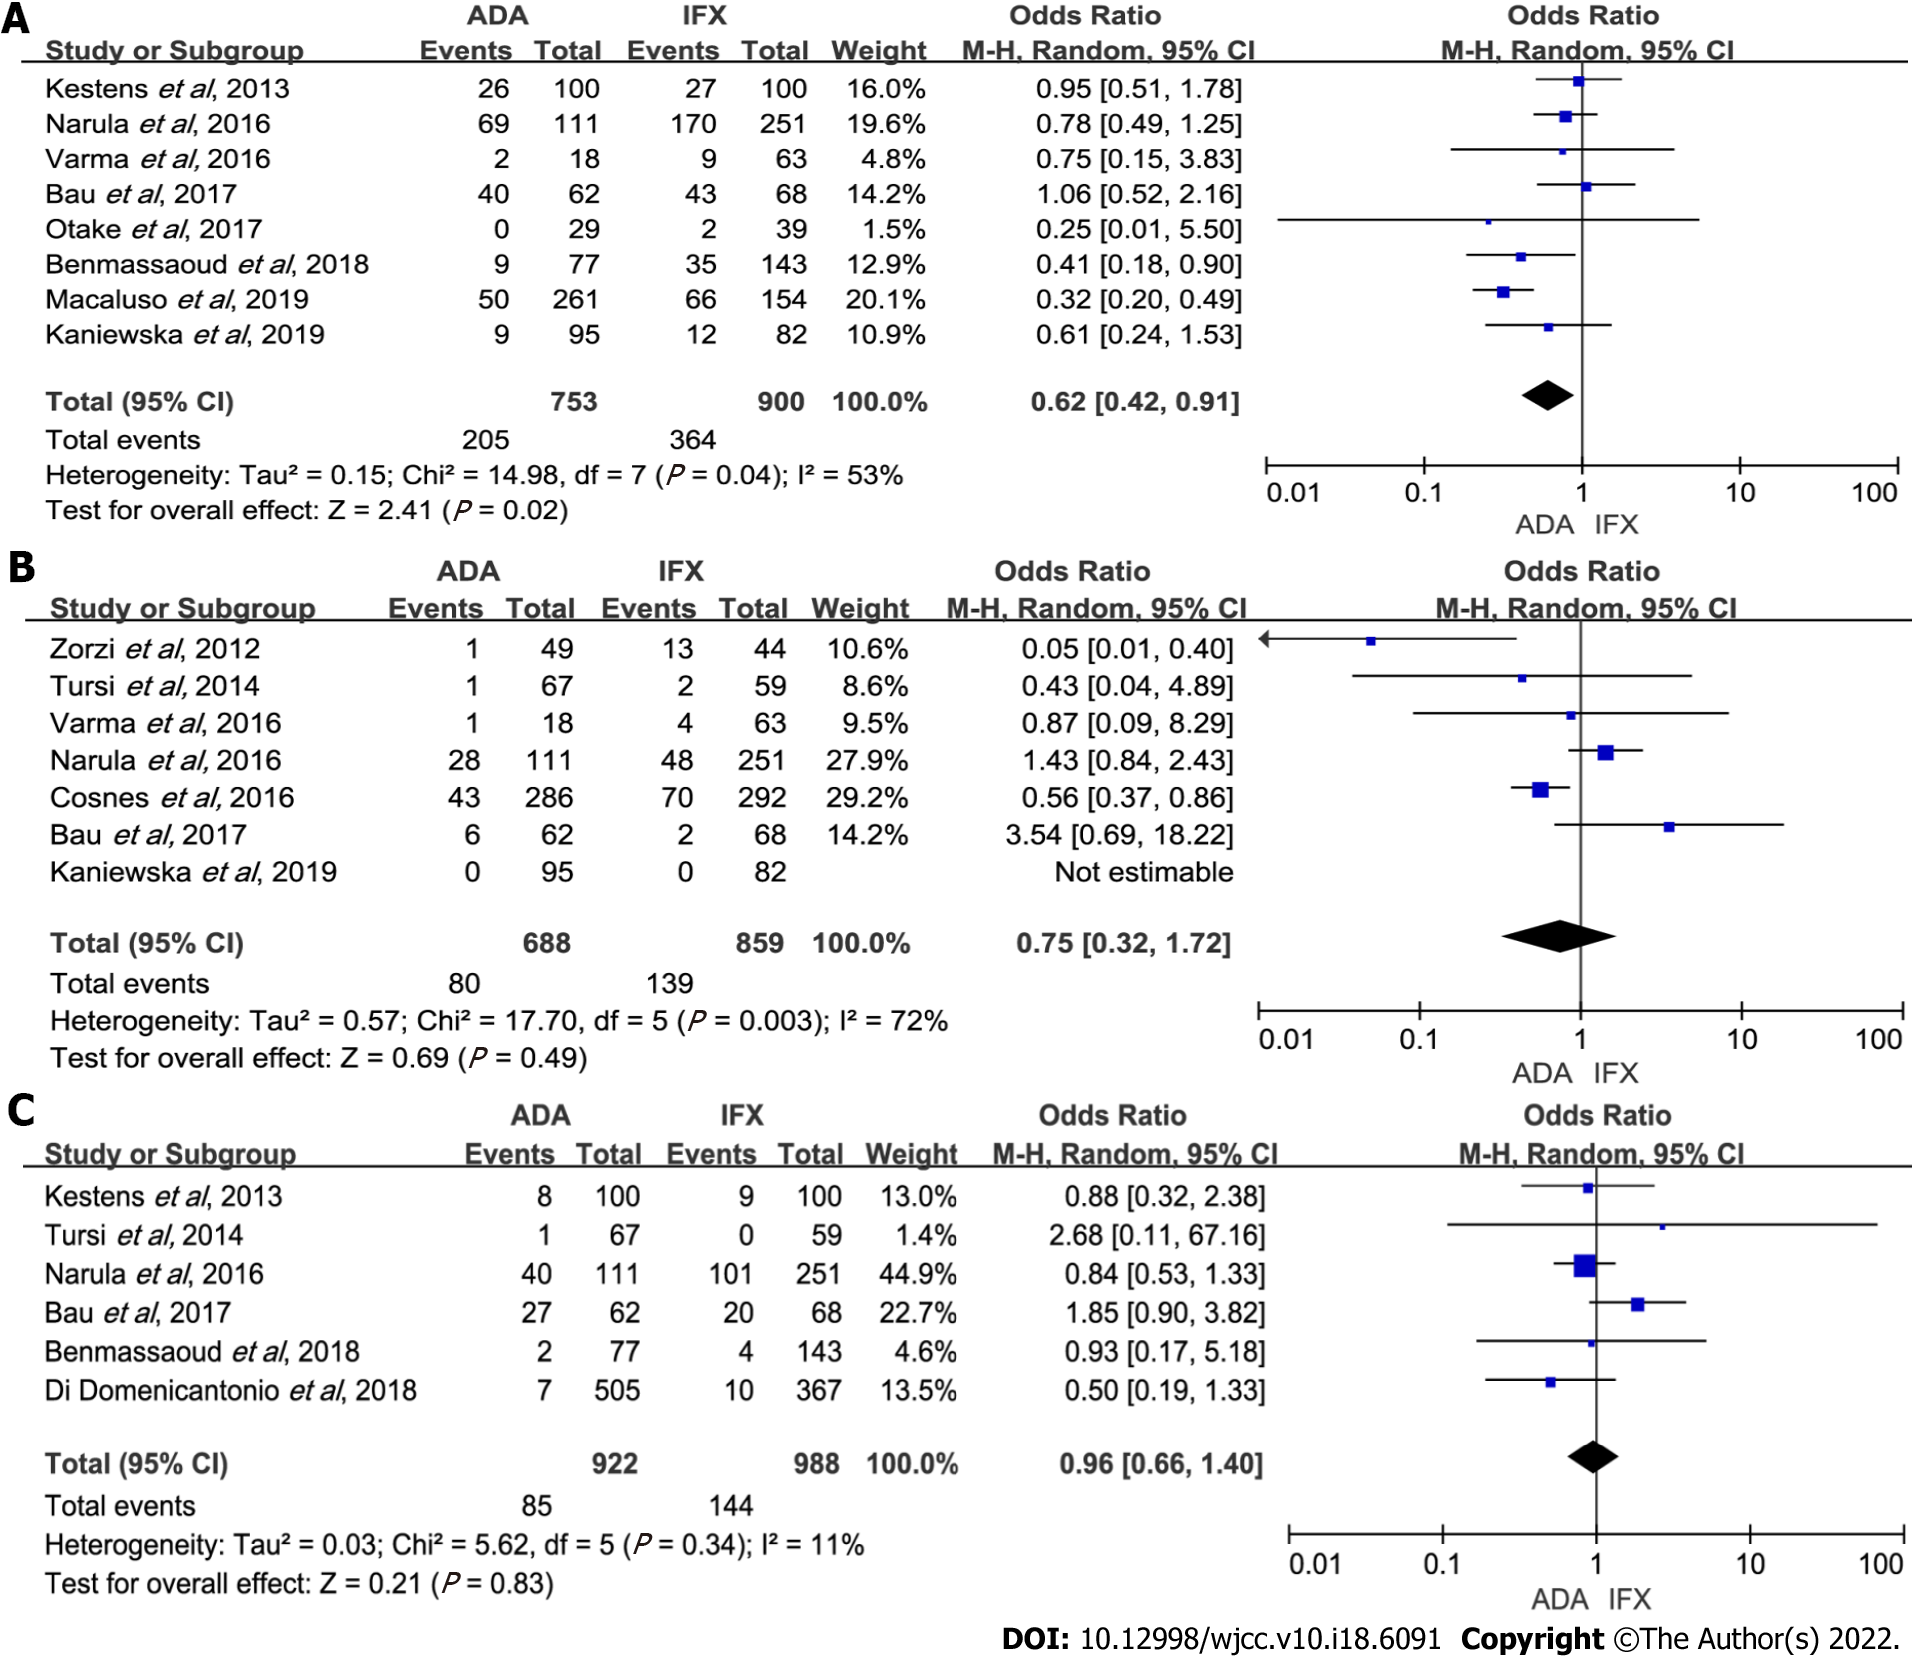
Figure 5 Forest plot for comparisons of the rate of adverse events for adalimumab and infliximab.
A: Overall adverse events; B: Severe adverse events; C: Opportunistic infection. ADA: Adalimumab; IFX: Infliximab; CI: Confidence interval.
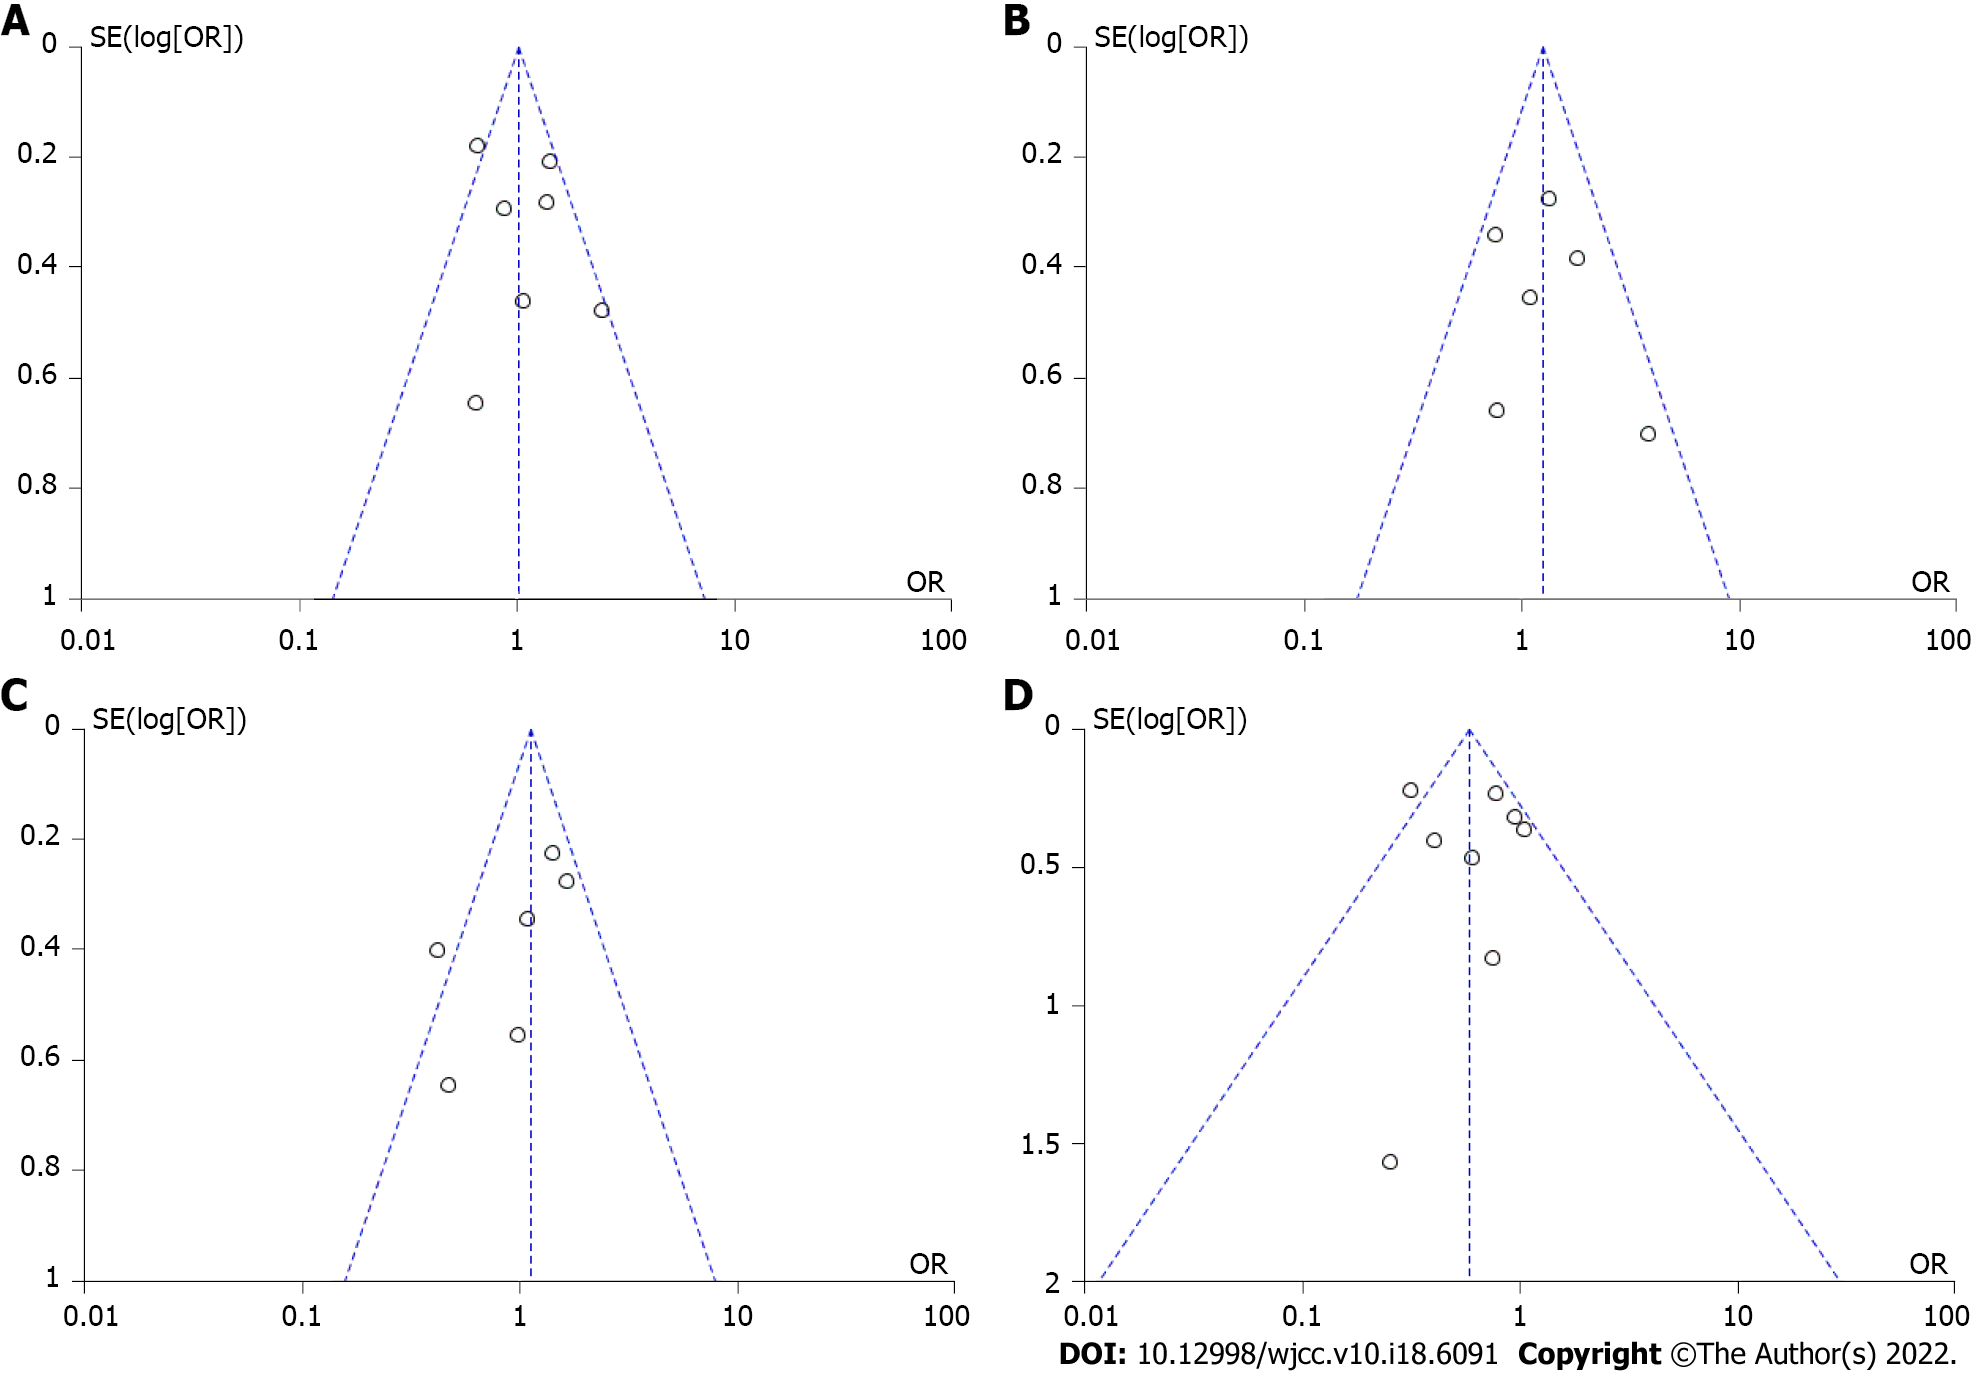
Figure 6 Funnel plot.
A: Maintenance of response; B: Maintenance of remission; C: Secondary loss of response; D: Overall adverse events. OR: Odds ratio; SE: Standard error.
- Citation: Yang HH, Huang Y, Zhou XC, Wang RN. Efficacy and safety of adalimumab in comparison to infliximab for Crohn's disease: A systematic review and meta-analysis. World J Clin Cases 2022; 10(18): 6091-6104
- URL: https://www.wjgnet.com/2307-8960/full/v10/i18/6091.htm
- DOI: https://dx.doi.org/10.12998/wjcc.v10.i18.6091


