Copyright
©The Author(s) 2022.
World J Clin Cases. Jun 26, 2022; 10(18): 6082-6090
Published online Jun 26, 2022. doi: 10.12998/wjcc.v10.i18.6082
Published online Jun 26, 2022. doi: 10.12998/wjcc.v10.i18.6082
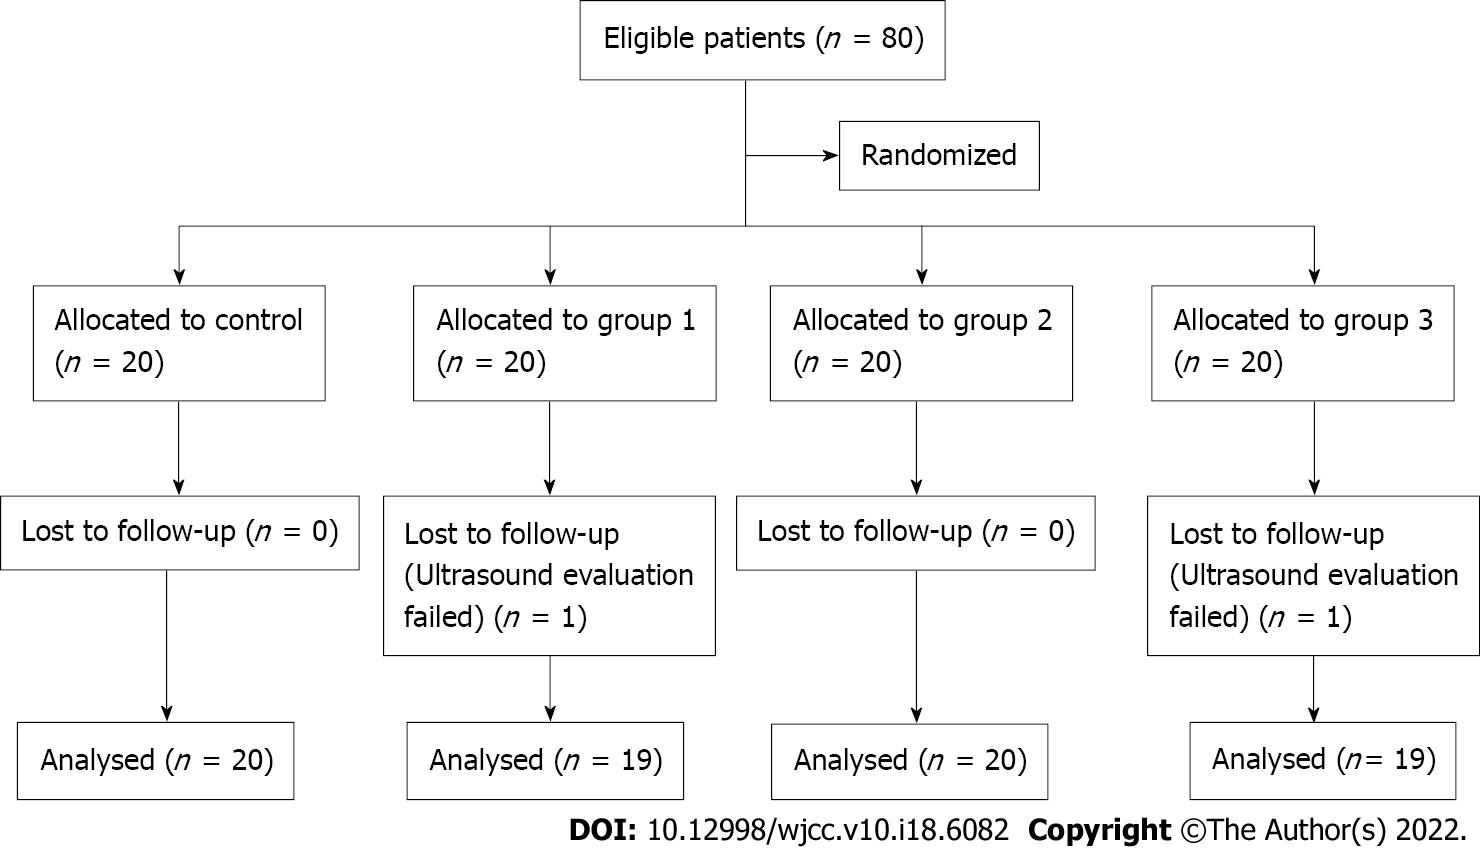
Figure 1 Flow diagram of the study selection process.
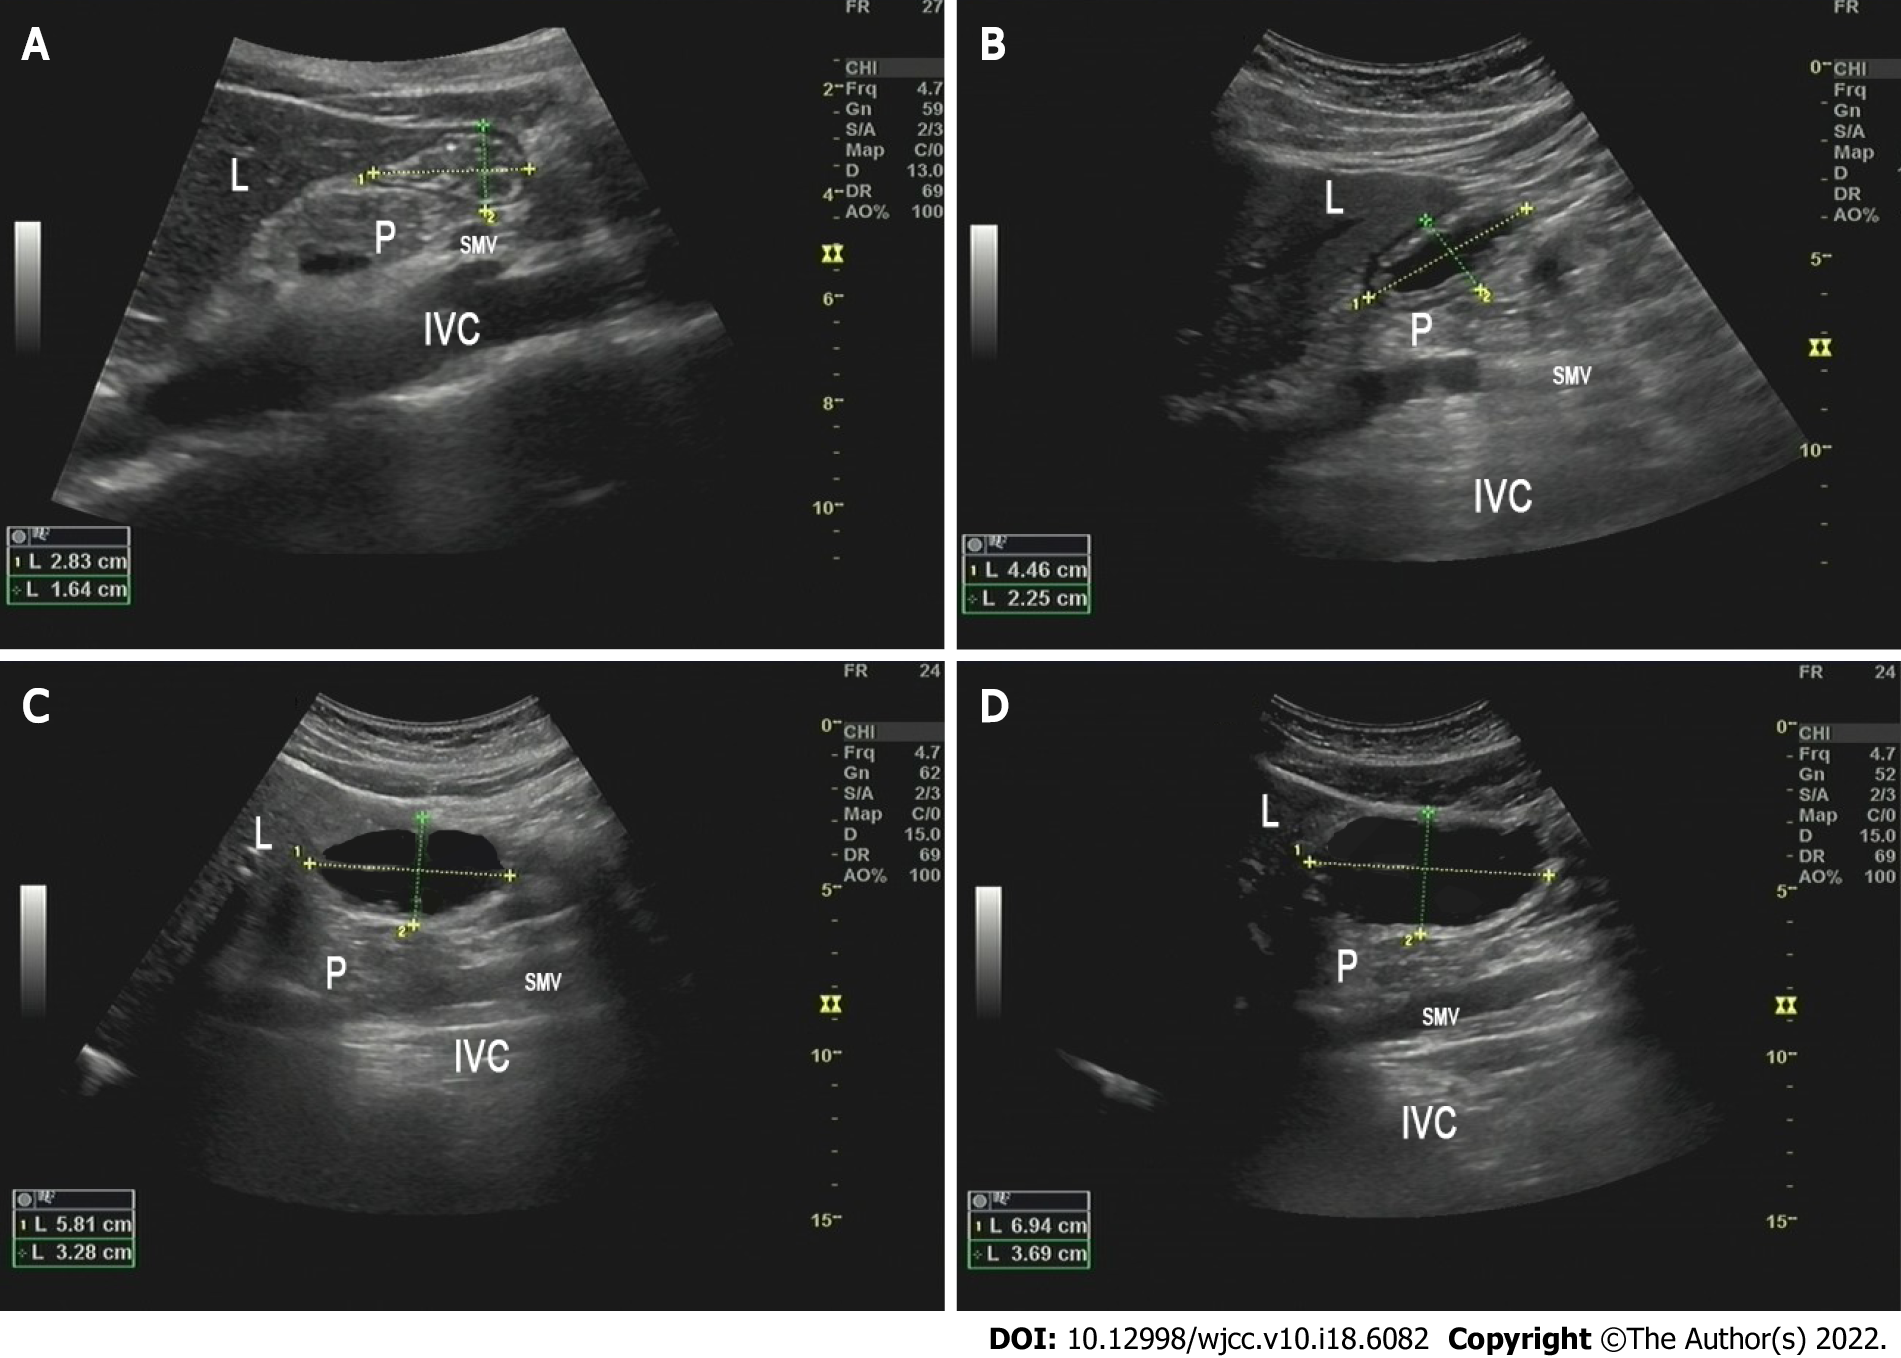
Figure 2 Ultrasonic images of gastric antrum after drinking different volumes of carbohydrates.
A: Control group (0 mL); B: Group 1 (100 mL); C: Group 2 (200 mL); D: Group 3 (300 mL). L: Liver; P: Pancreas; SMV: Superior mesenteric vein; IVC: Inferior vena cava.
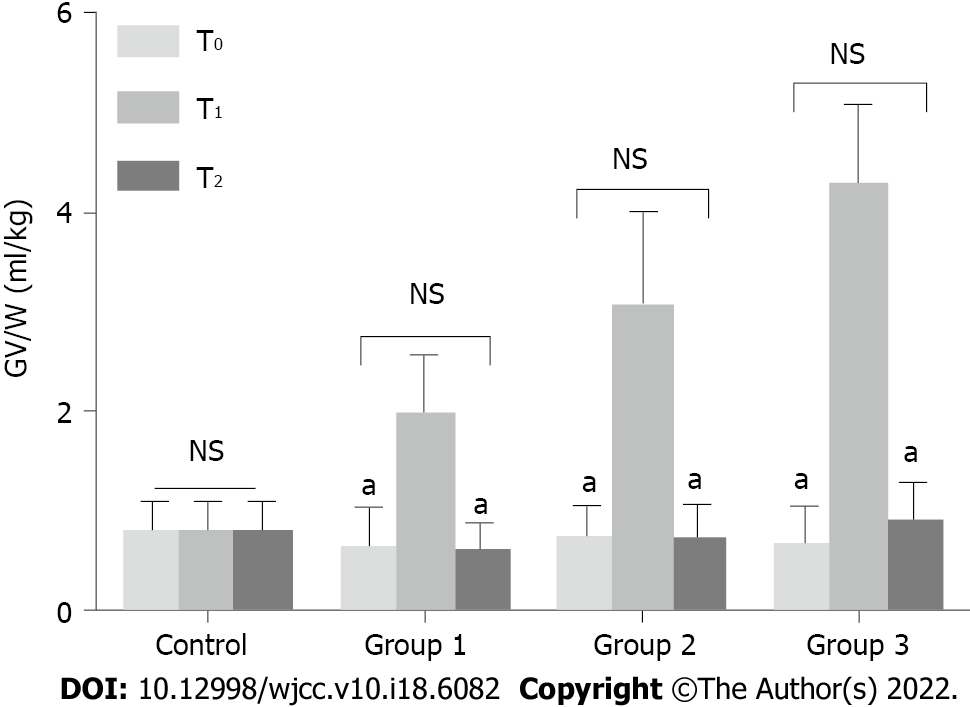
Figure 3 Comparison of gastric volume per unit weight in four groups of patients at different time points.
Gastric volume per unit weight (GV/W) was increased significantly at T1 in groups 1, 2, and 3. At T2, GV/W decreased significantly, with no statistical difference observed between T0 and T2 in all the groups (aP < 0.05, T0 vs T1, T1 vs T2). NS: Not significant.
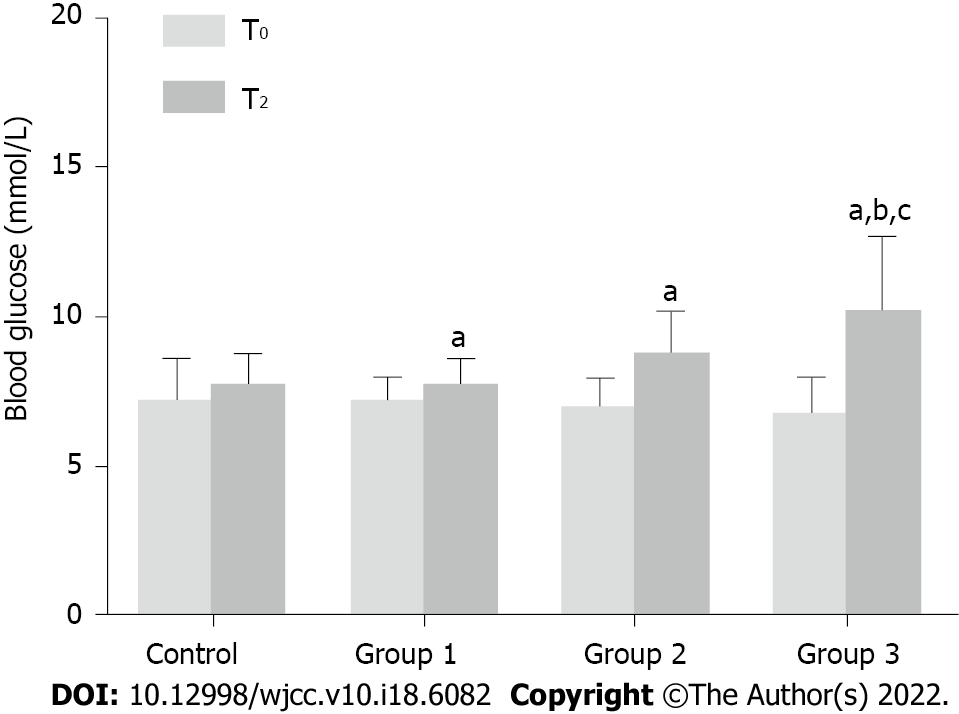
Figure 4 Comparison of blood glucose in four groups of patients at T0 and T2.
In groups 1, 2, and 3, blood glucose levels increased significantly at T2 compared with that at T0. In patients receiving 300 mL of the carbohydrate drink (group 3), the blood glucose level at T2 increased by > 2 mmol/L, which was significantly higher than that in control and group 1 (aP < 0.05, T0 vs T2; bP < 0.05, group 3 vs control; cP < 0.05, group 3 vs group 1).
- Citation: Lin XQ, Chen YR, Chen X, Cai YP, Lin JX, Xu DM, Zheng XC. Impact of preoperative carbohydrate loading on gastric volume in patients with type 2 diabetes. World J Clin Cases 2022; 10(18): 6082-6090
- URL: https://www.wjgnet.com/2307-8960/full/v10/i18/6082.htm
- DOI: https://dx.doi.org/10.12998/wjcc.v10.i18.6082


