Copyright
©The Author(s) 2022.
World J Clin Cases. Jun 26, 2022; 10(18): 5965-5983
Published online Jun 26, 2022. doi: 10.12998/wjcc.v10.i18.5965
Published online Jun 26, 2022. doi: 10.12998/wjcc.v10.i18.5965
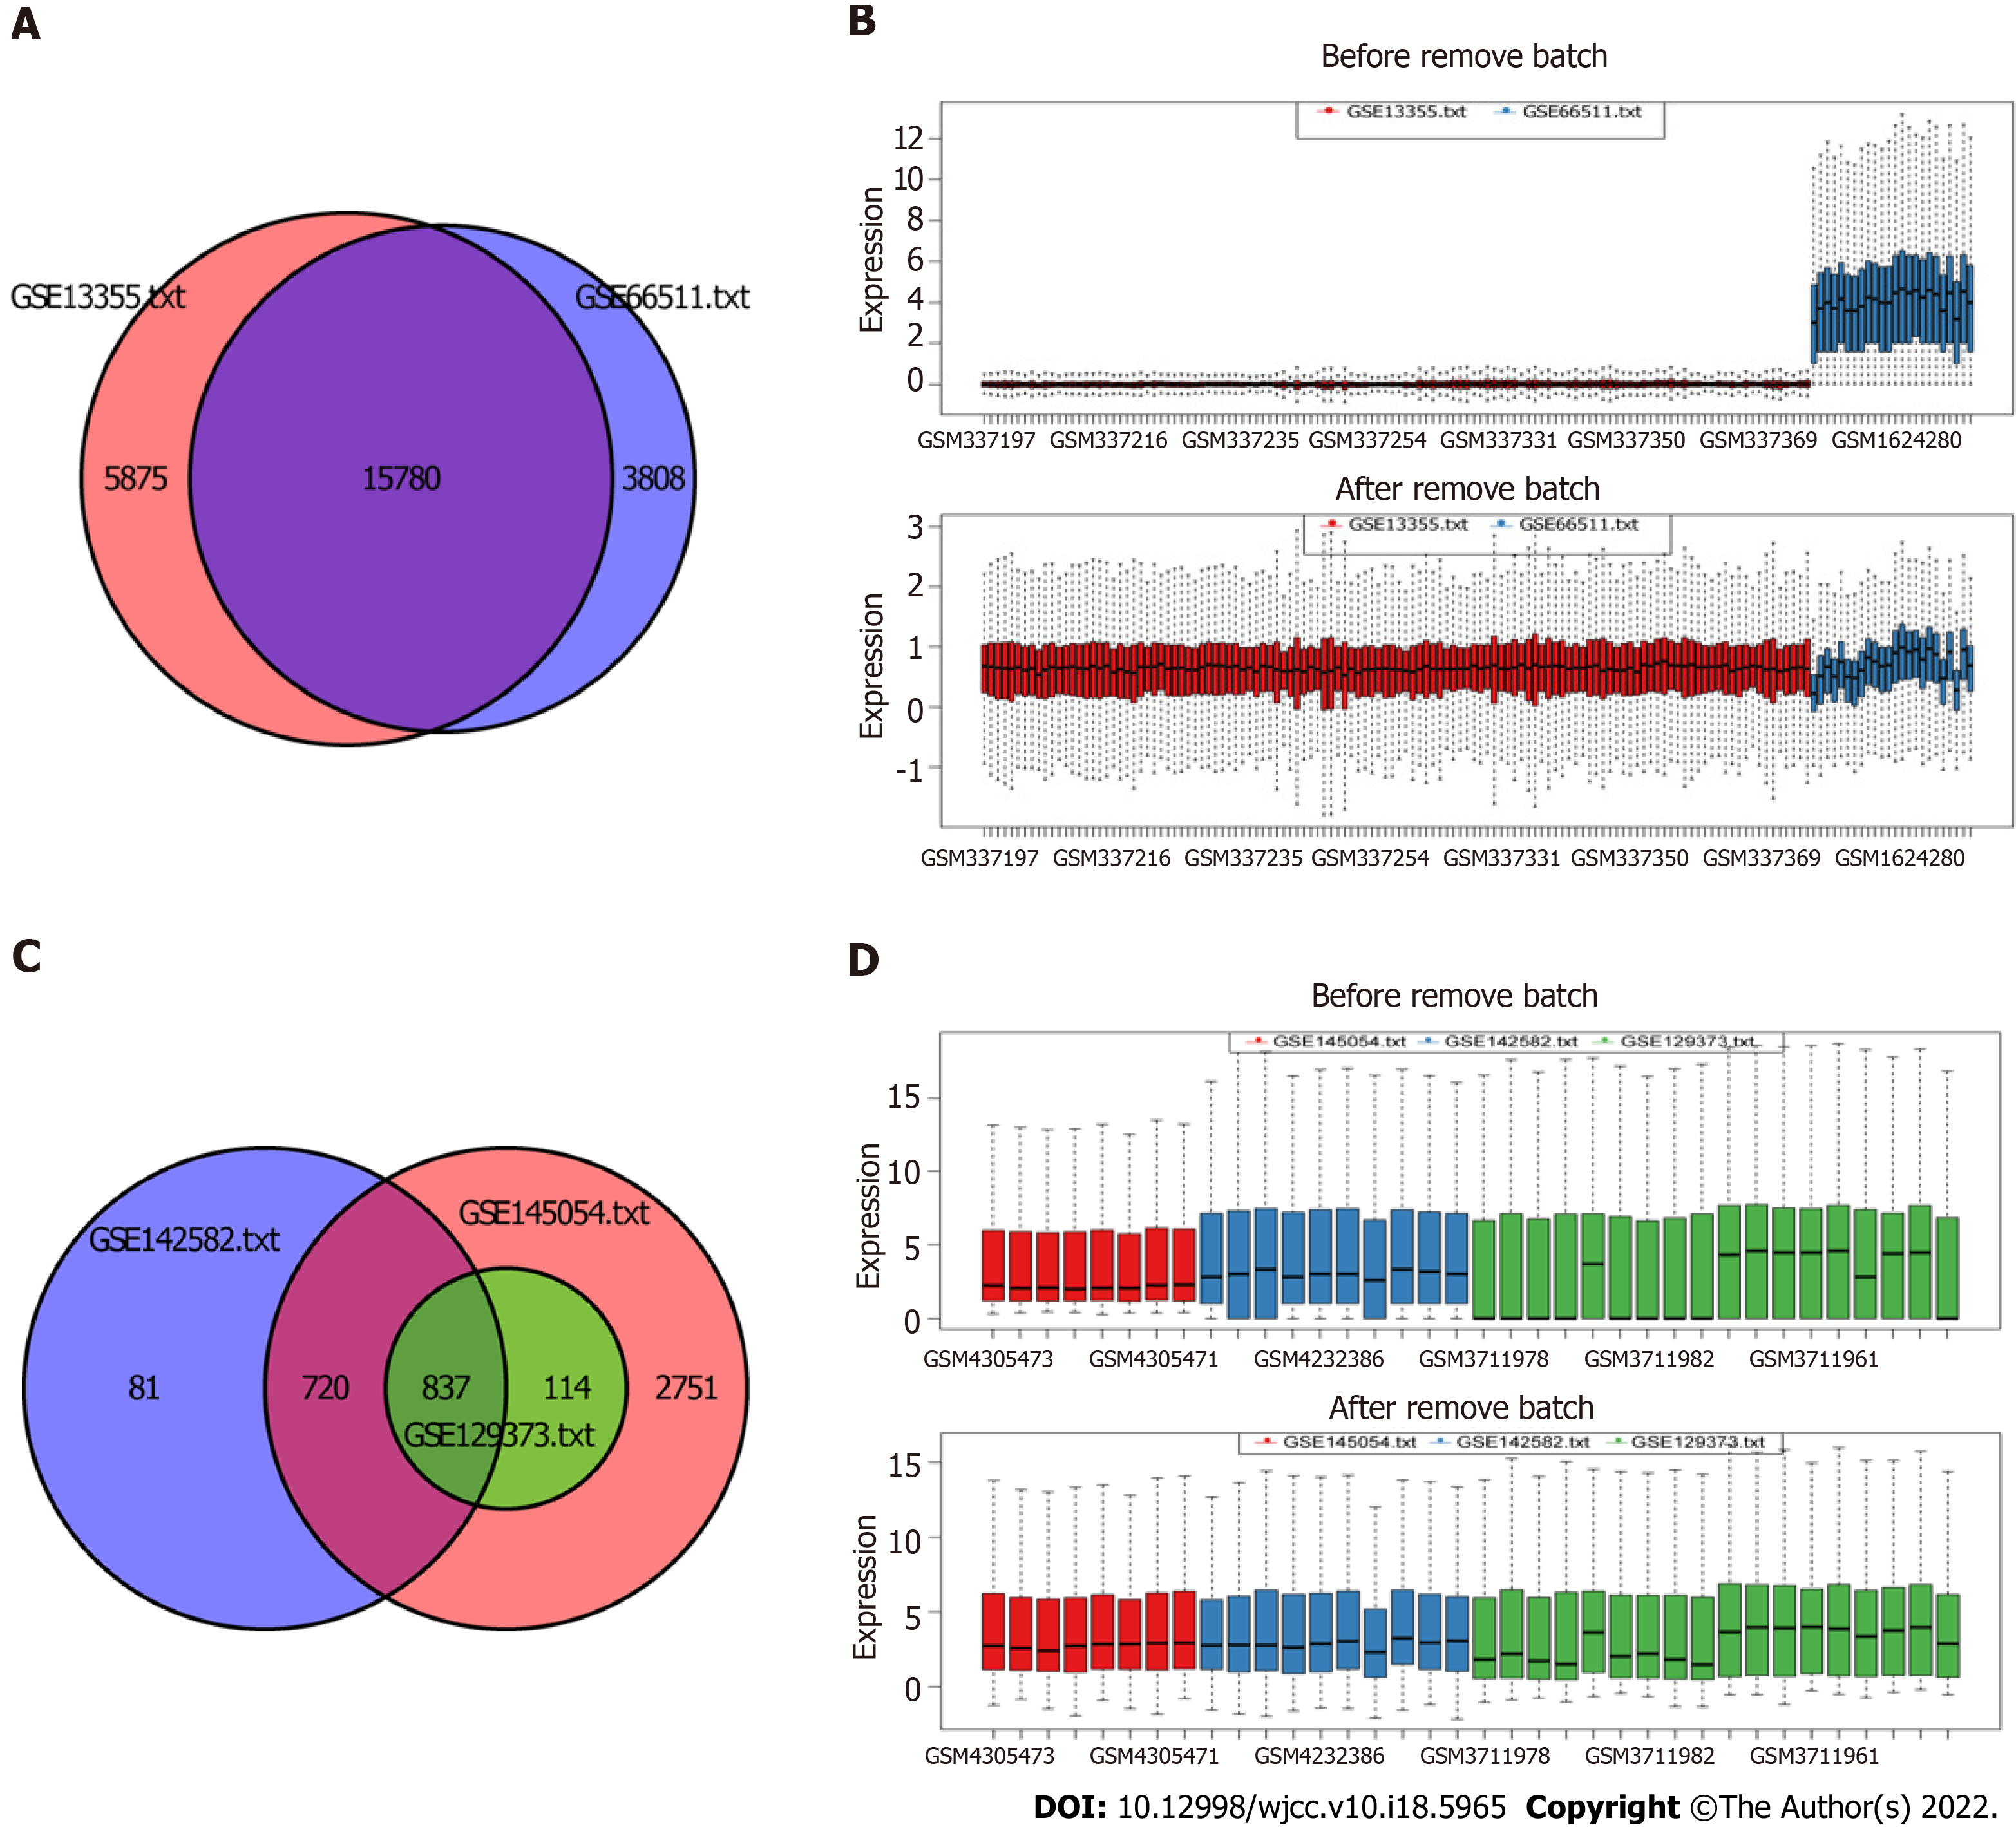
Figure 1 Removal of data batch effect.
A: Ven diagram of batch effect of mRNA; B: Boxplot of batch effect of mRNA; C: Ven diagram of batch effect of miRNA; D: Boxplot of batch effect of miRNA.
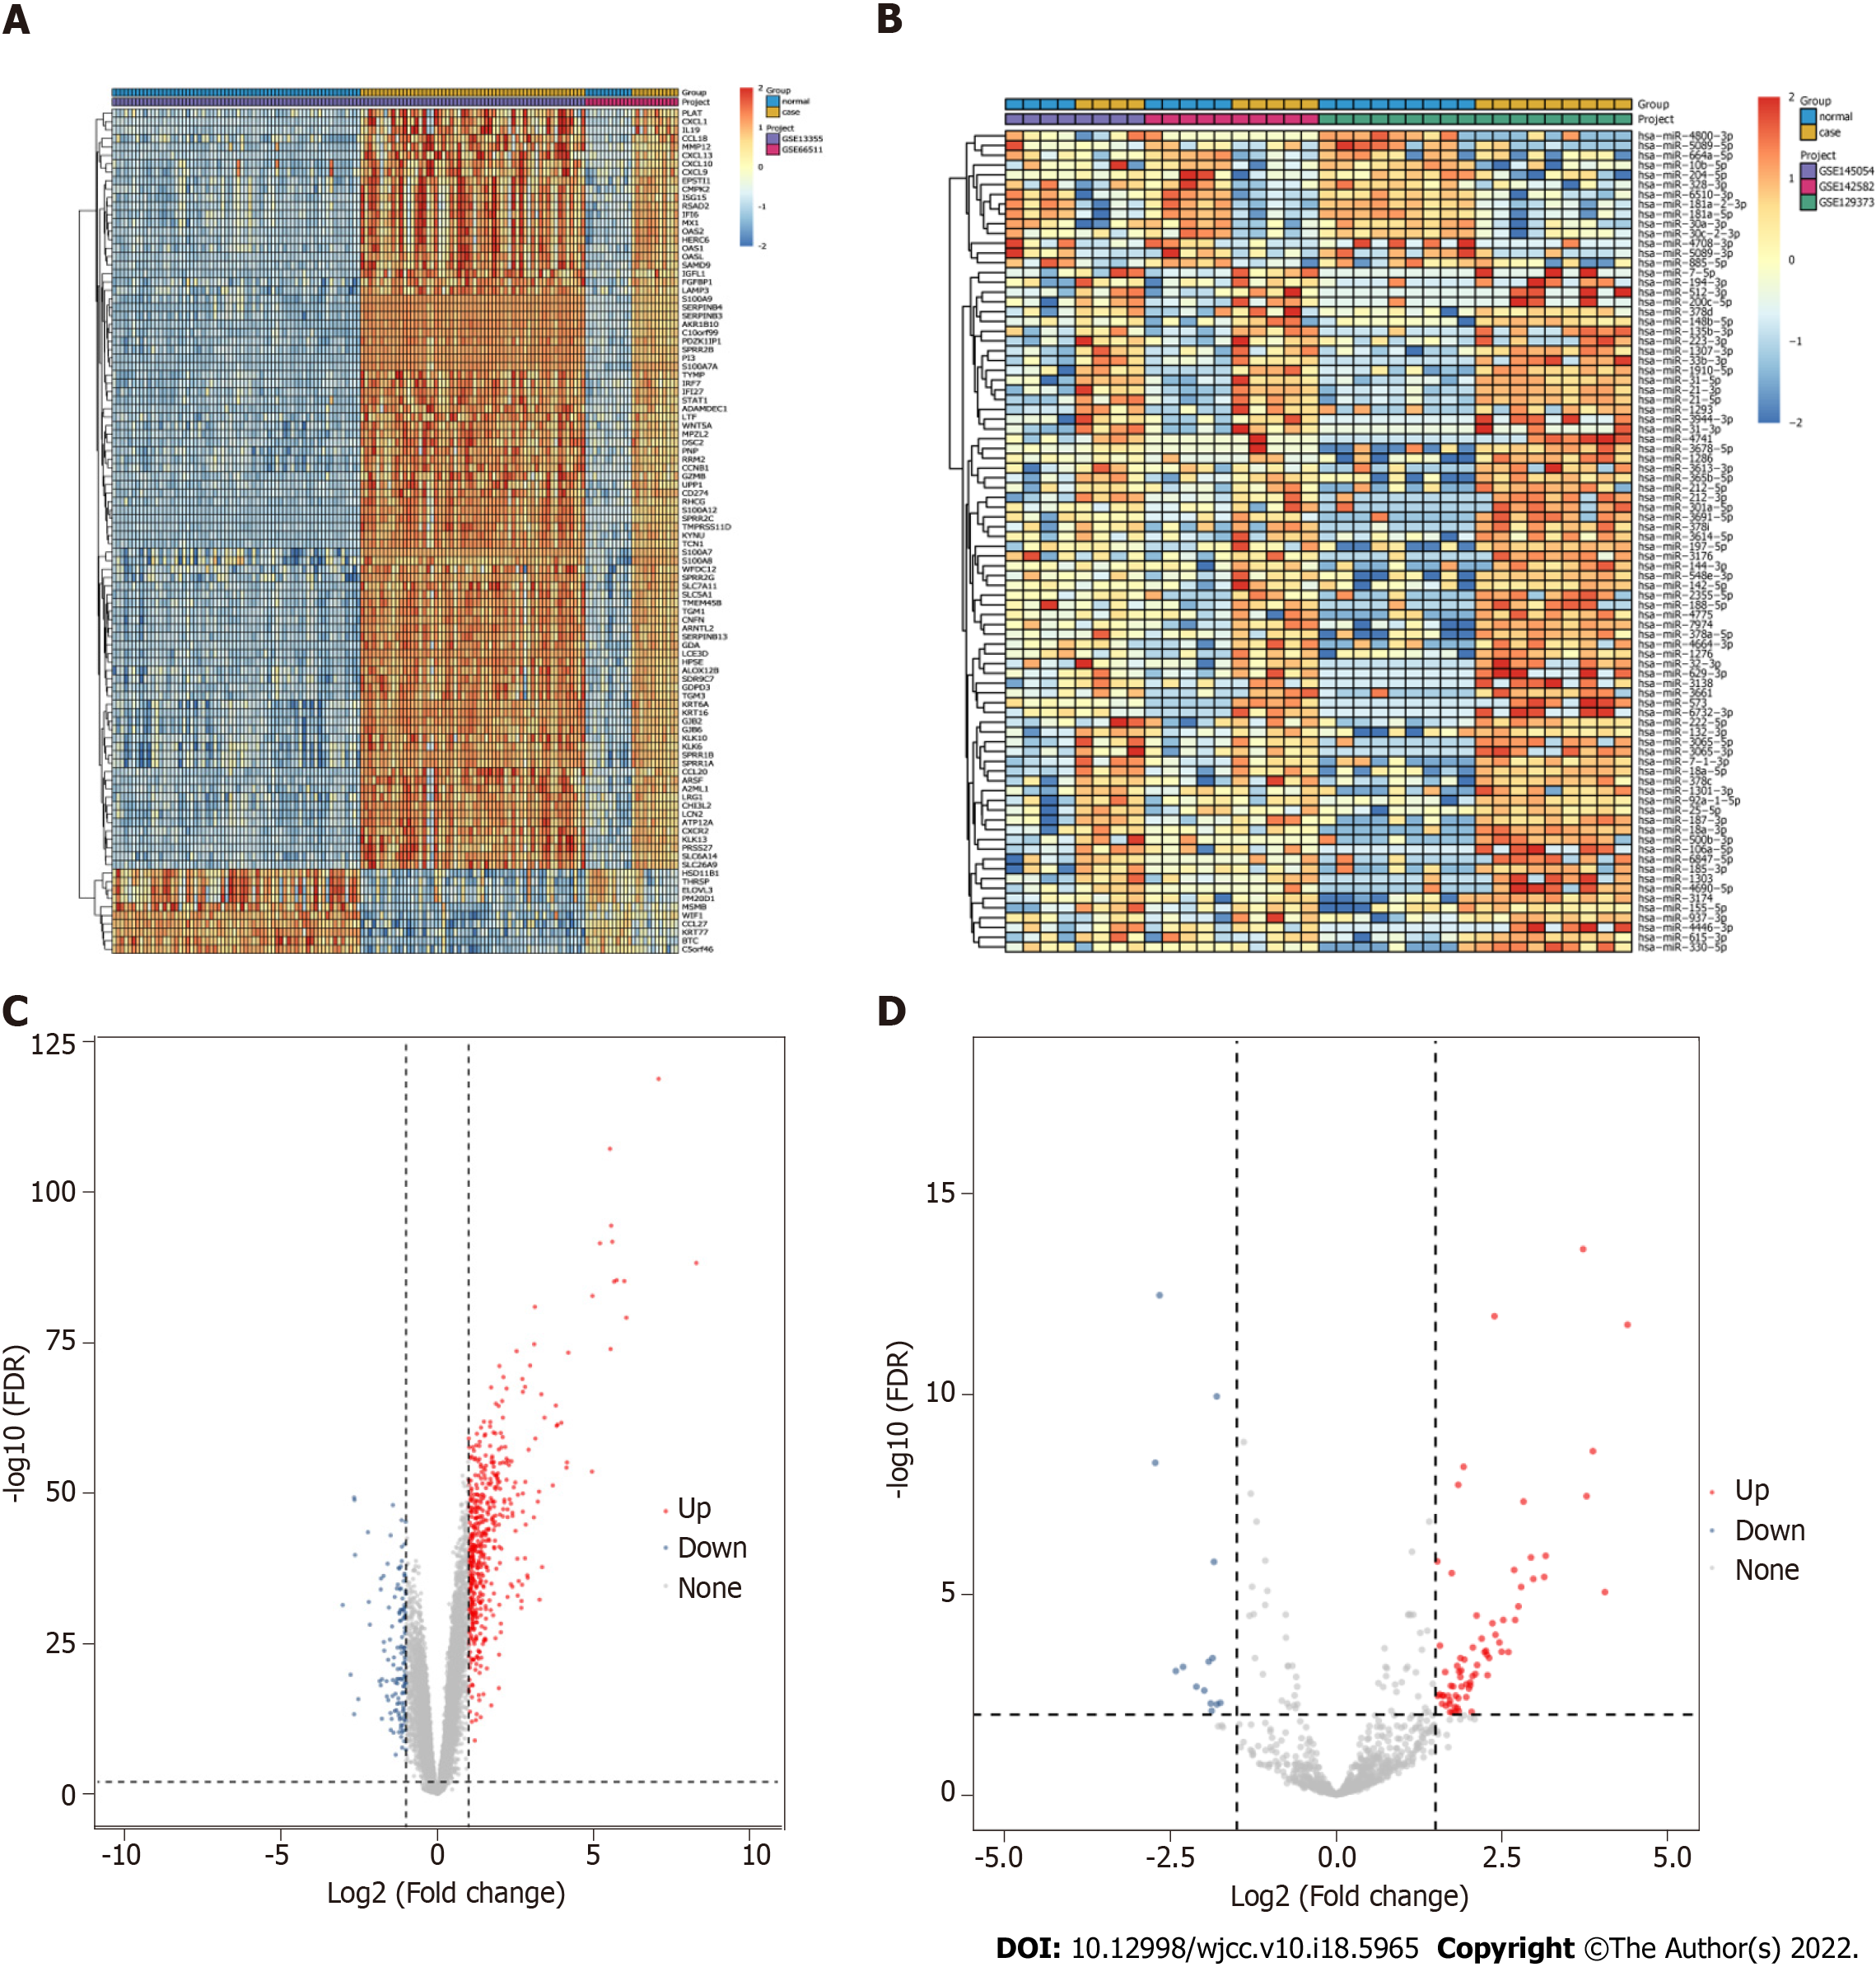
Figure 2 Identification of differentially expressed mRNAs and differentially expressed miRNAs.
A: Heat map of top 100 differentially expressed mRNAs (DEmRNAs). Complete‑linkage method combined with Euclidean distance was used to construct clustering; B: Heat map of differentially expressed miRNAs (DEmiRNAs); C: Volcano map of DEmRNAs. Blue, red, and gray points represent down-expressed, up-expressed, and not DEmRNAs, respectively; D: Volcano map of DEmiRNAs.
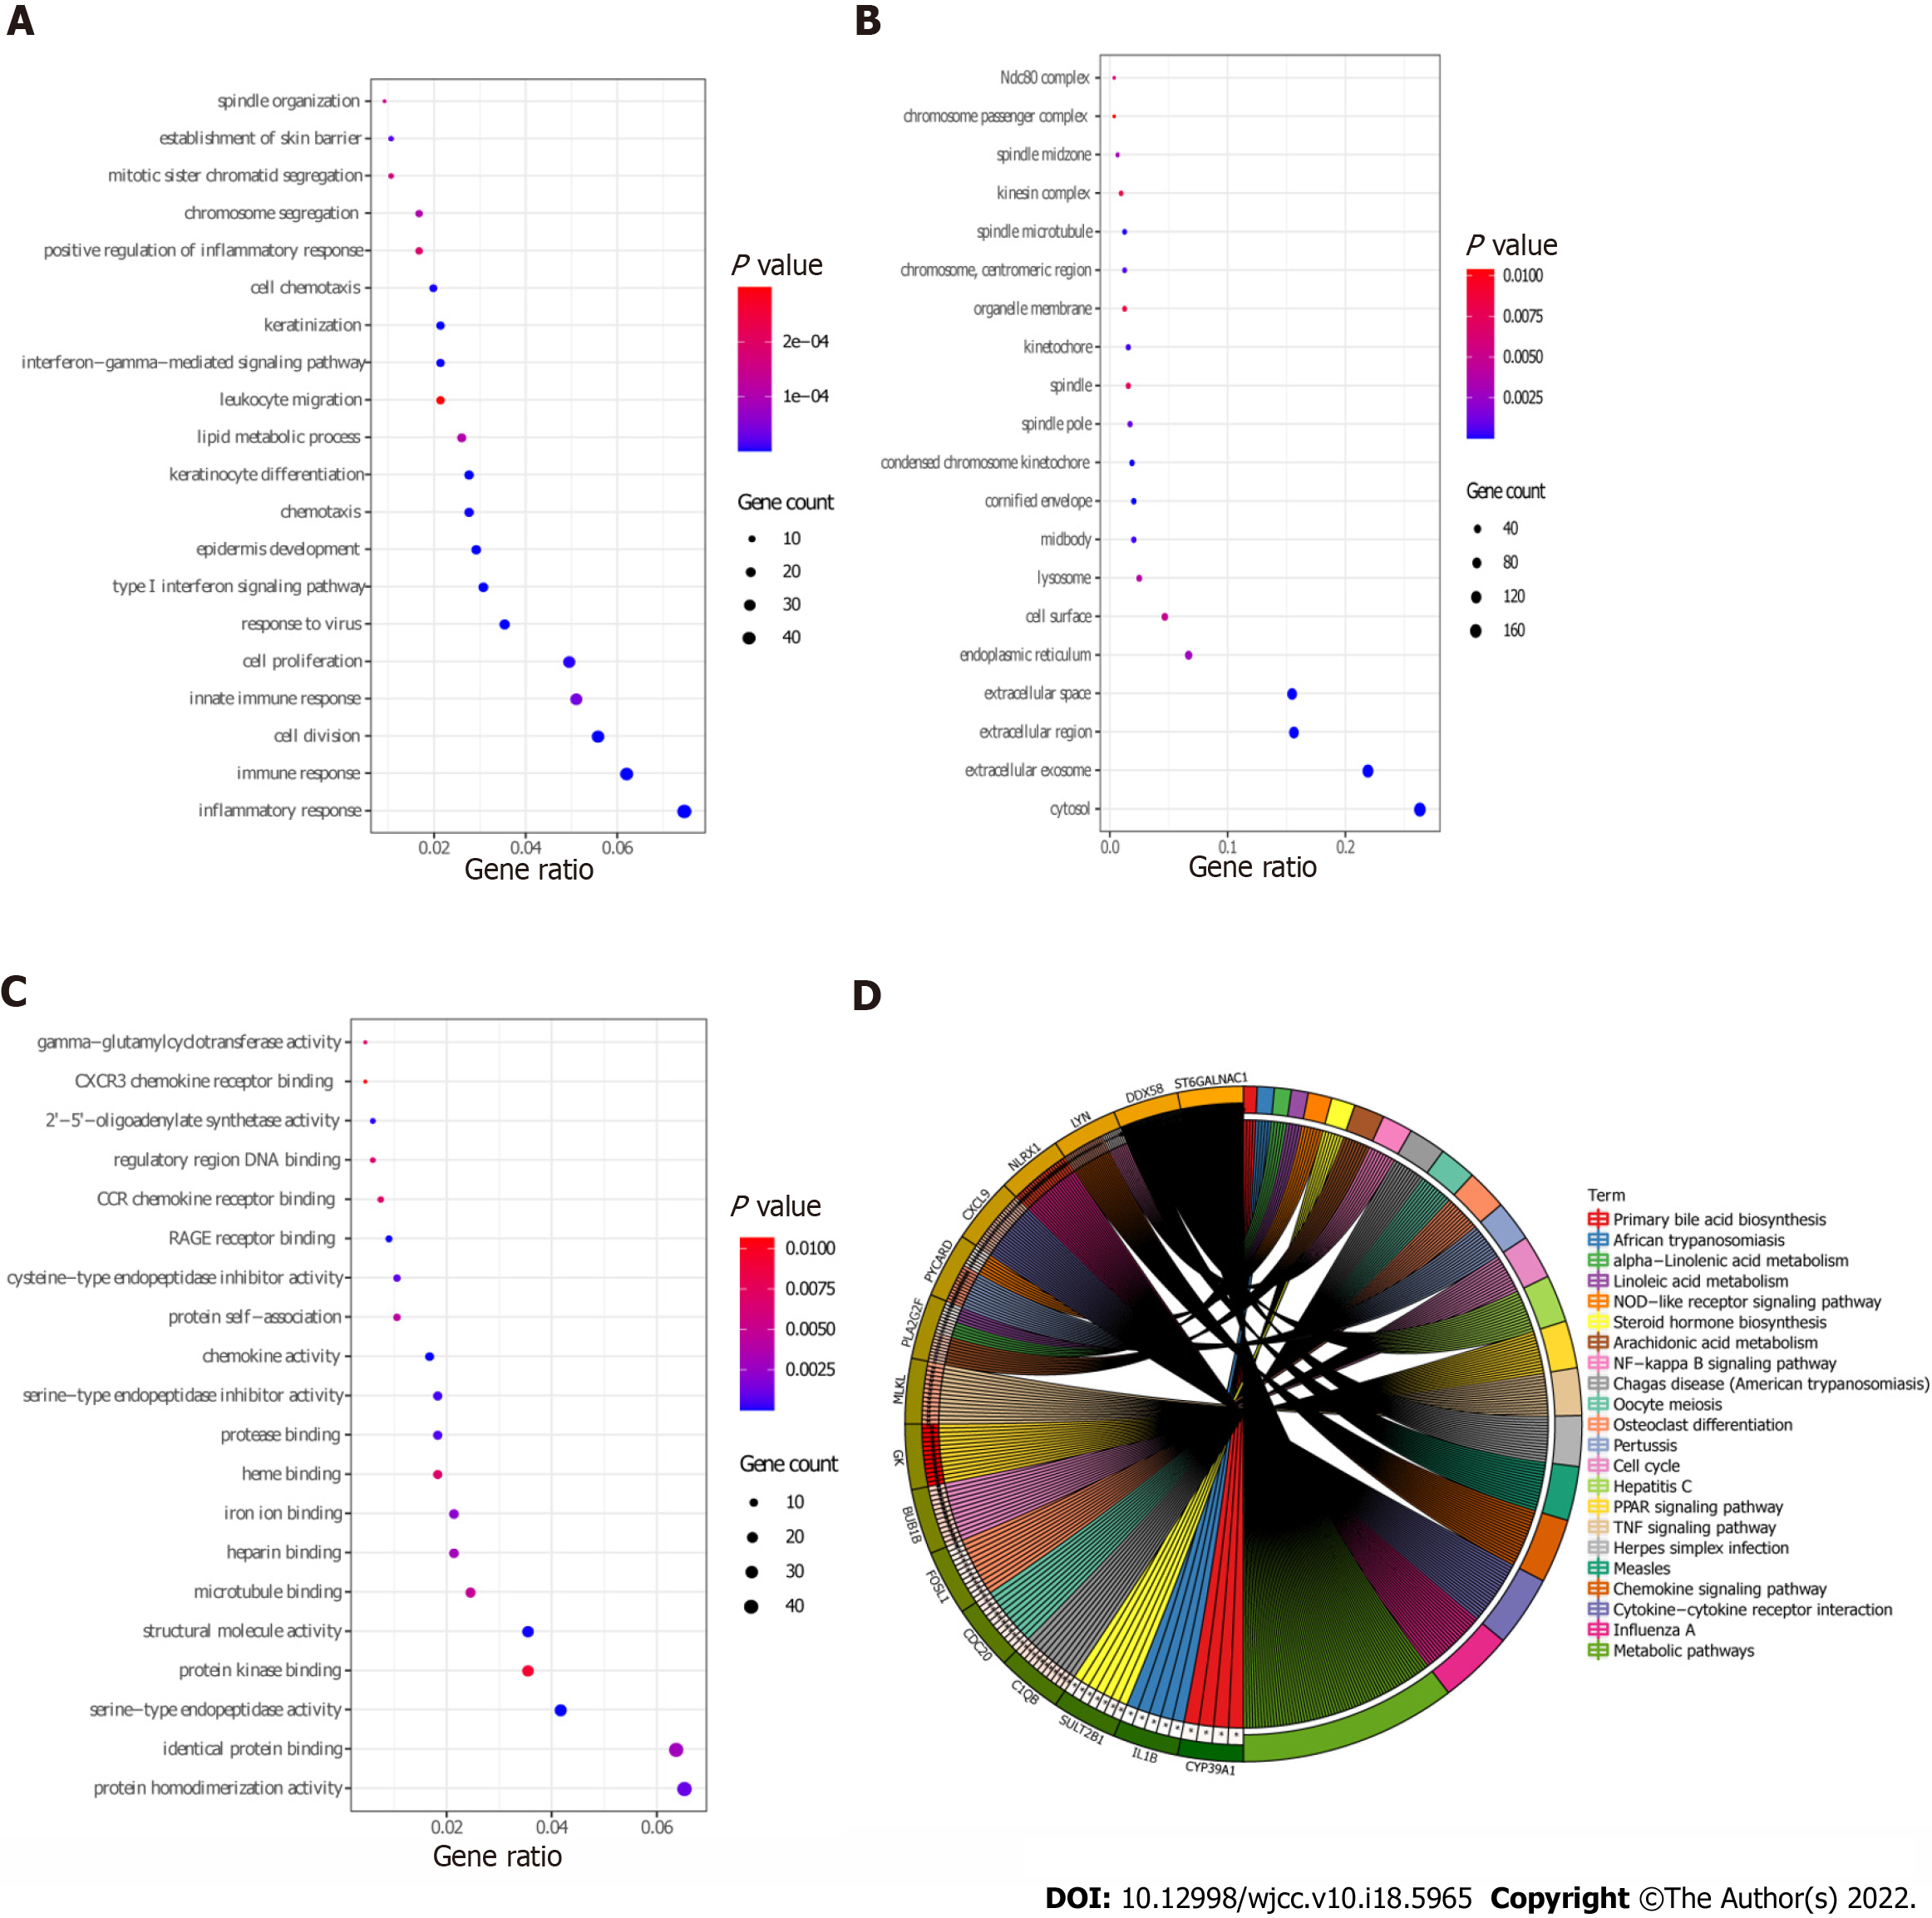
Figure 3 Gene Ontology and Kyoto Encyclopedia of Genes and Genomics analysis of differentially expressed mRNAs.
A: Biological processes terms were enriched of differentially expressed mRNAs (DEmRNAs) by Gene Ontology (GO) function analysis; B: Cellular components terms were enriched of DEmRNAs by GO function analysis; C: Molecular functions terms were enriched of DEmRNAs by GO function analysis; D: Kyoto Encyclopedia of Genes and Genomics enrichment of DEmRNAs.
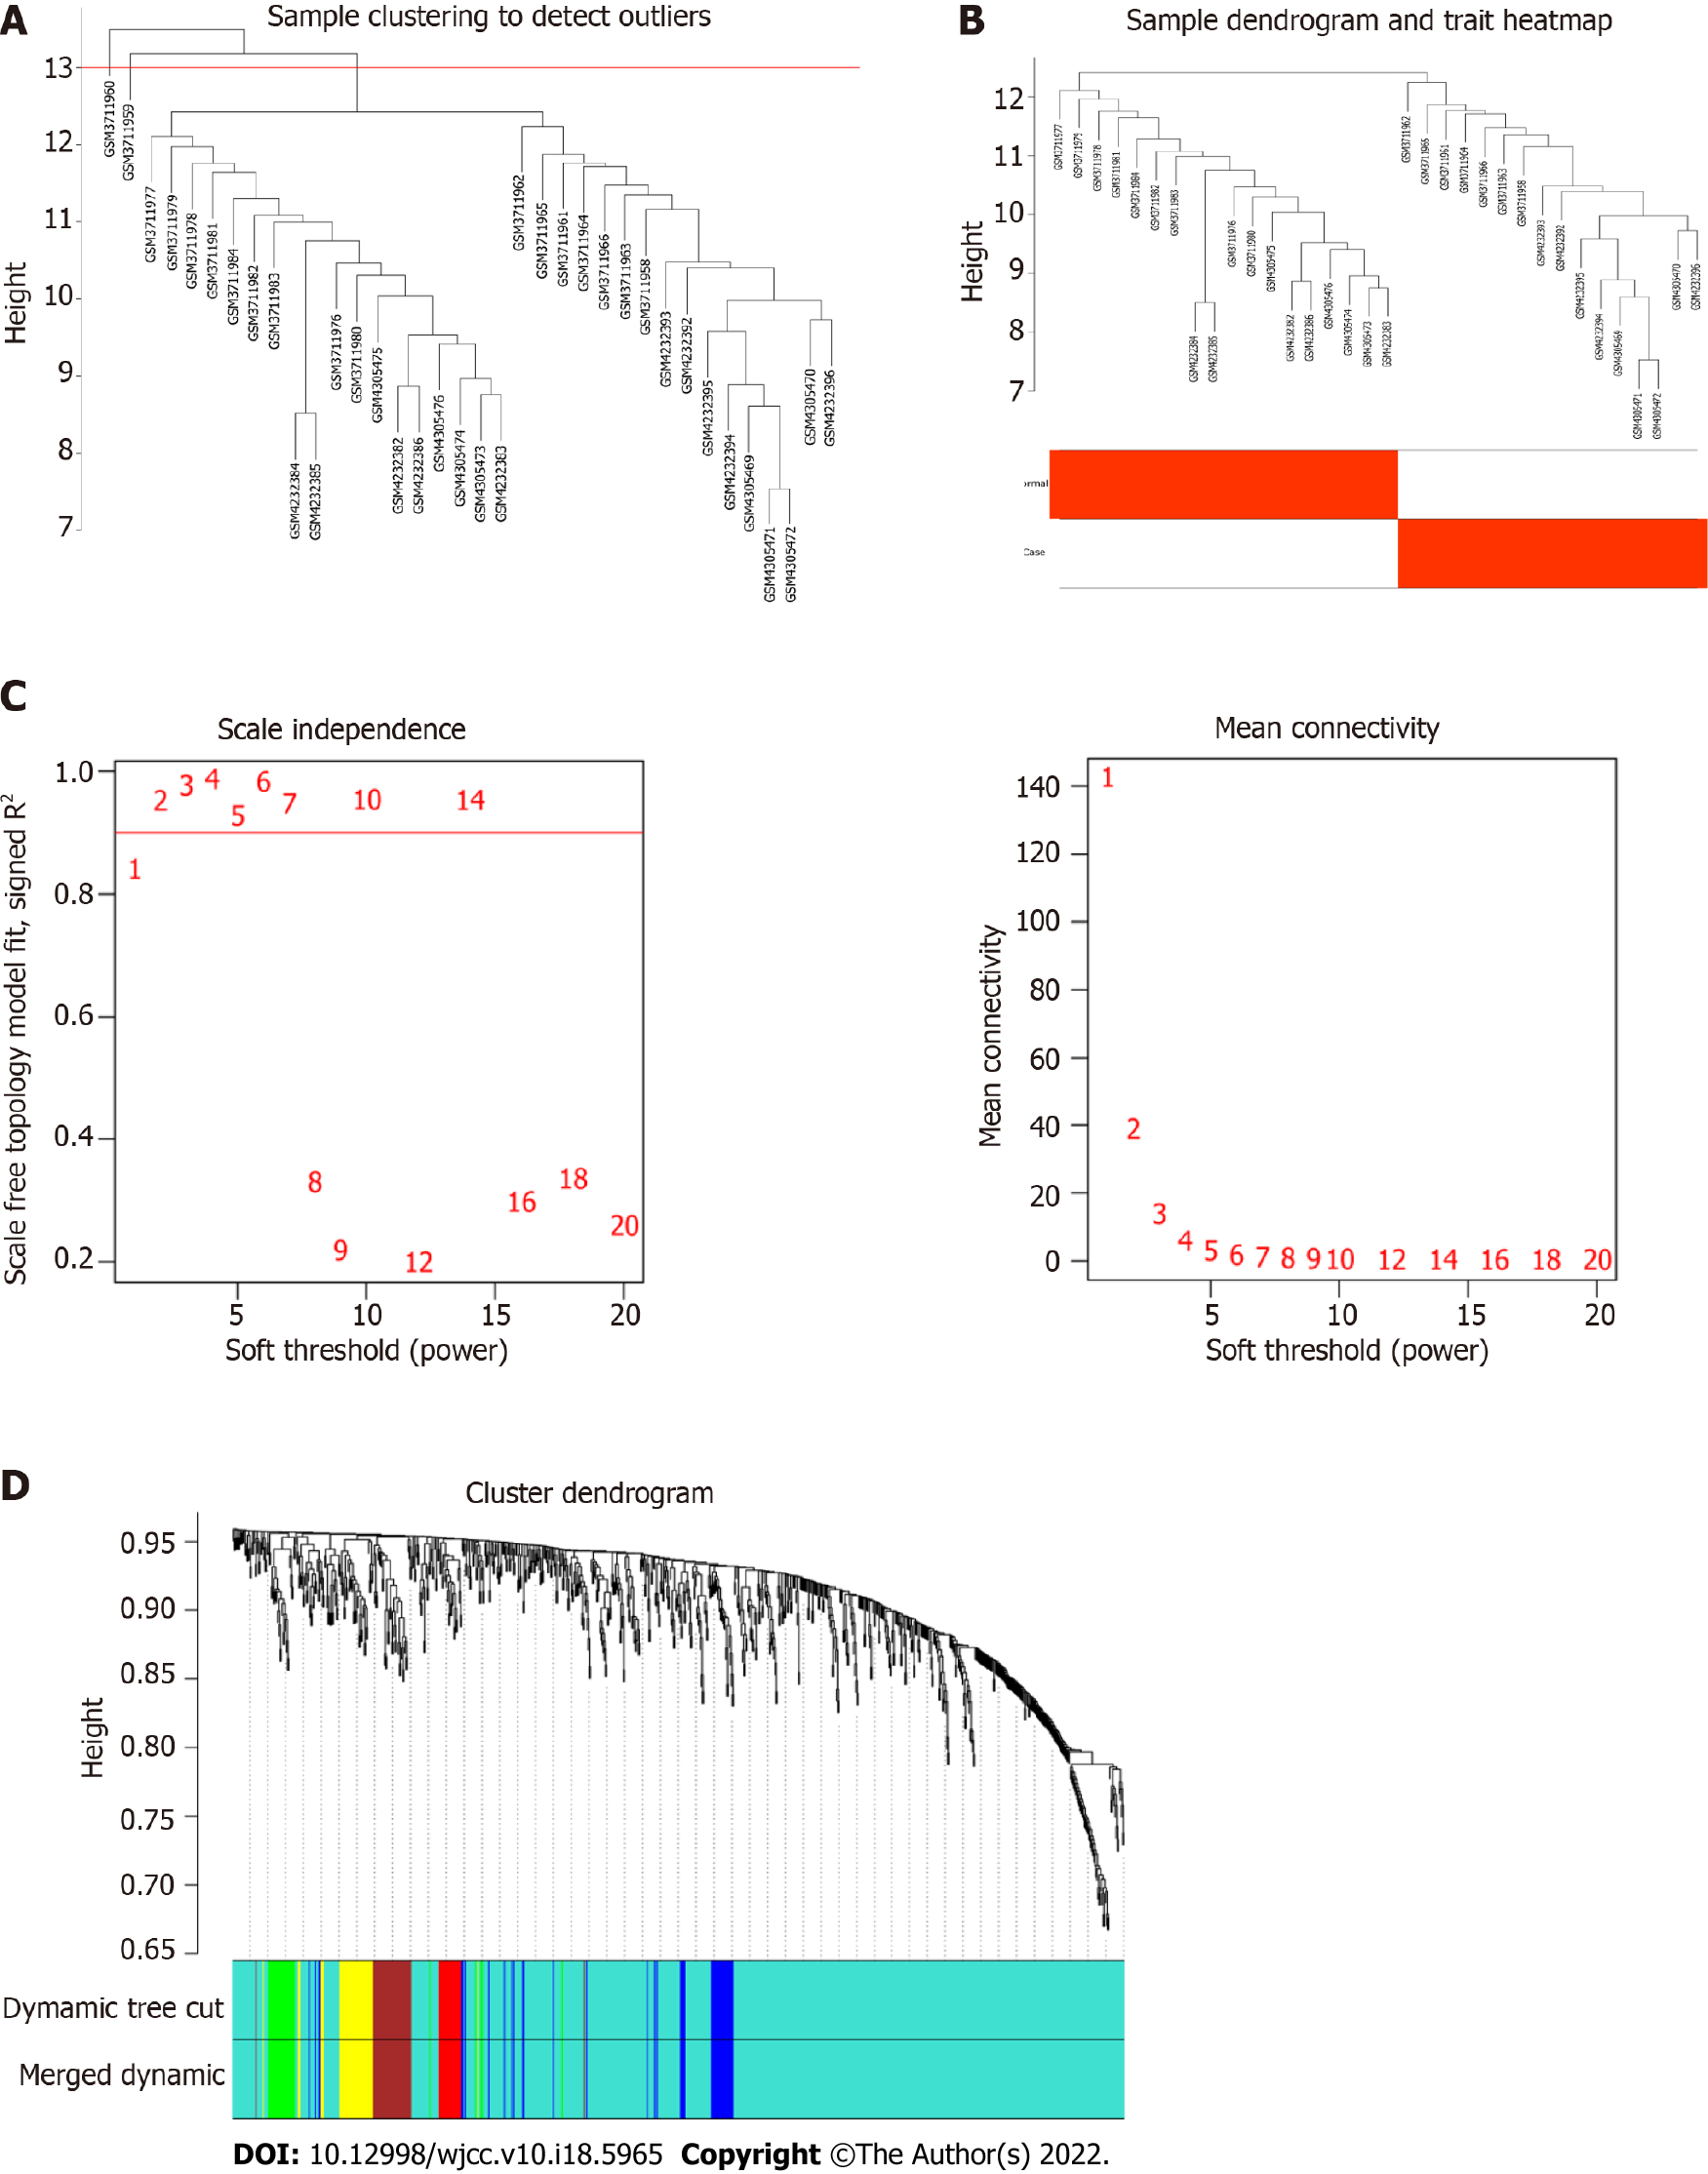
Figure 4 Construction of weighted gene co-expression network.
A: Sample screening dendrogram; B: Sample dendrogram and trait heat map; C: Scale-free fit index of different soft threshold power (β) and mean connectivity of various soft threshold power; D: The cluster dendrogram of the miRNAs. Each branch represents one gene, and every color below represents one module.
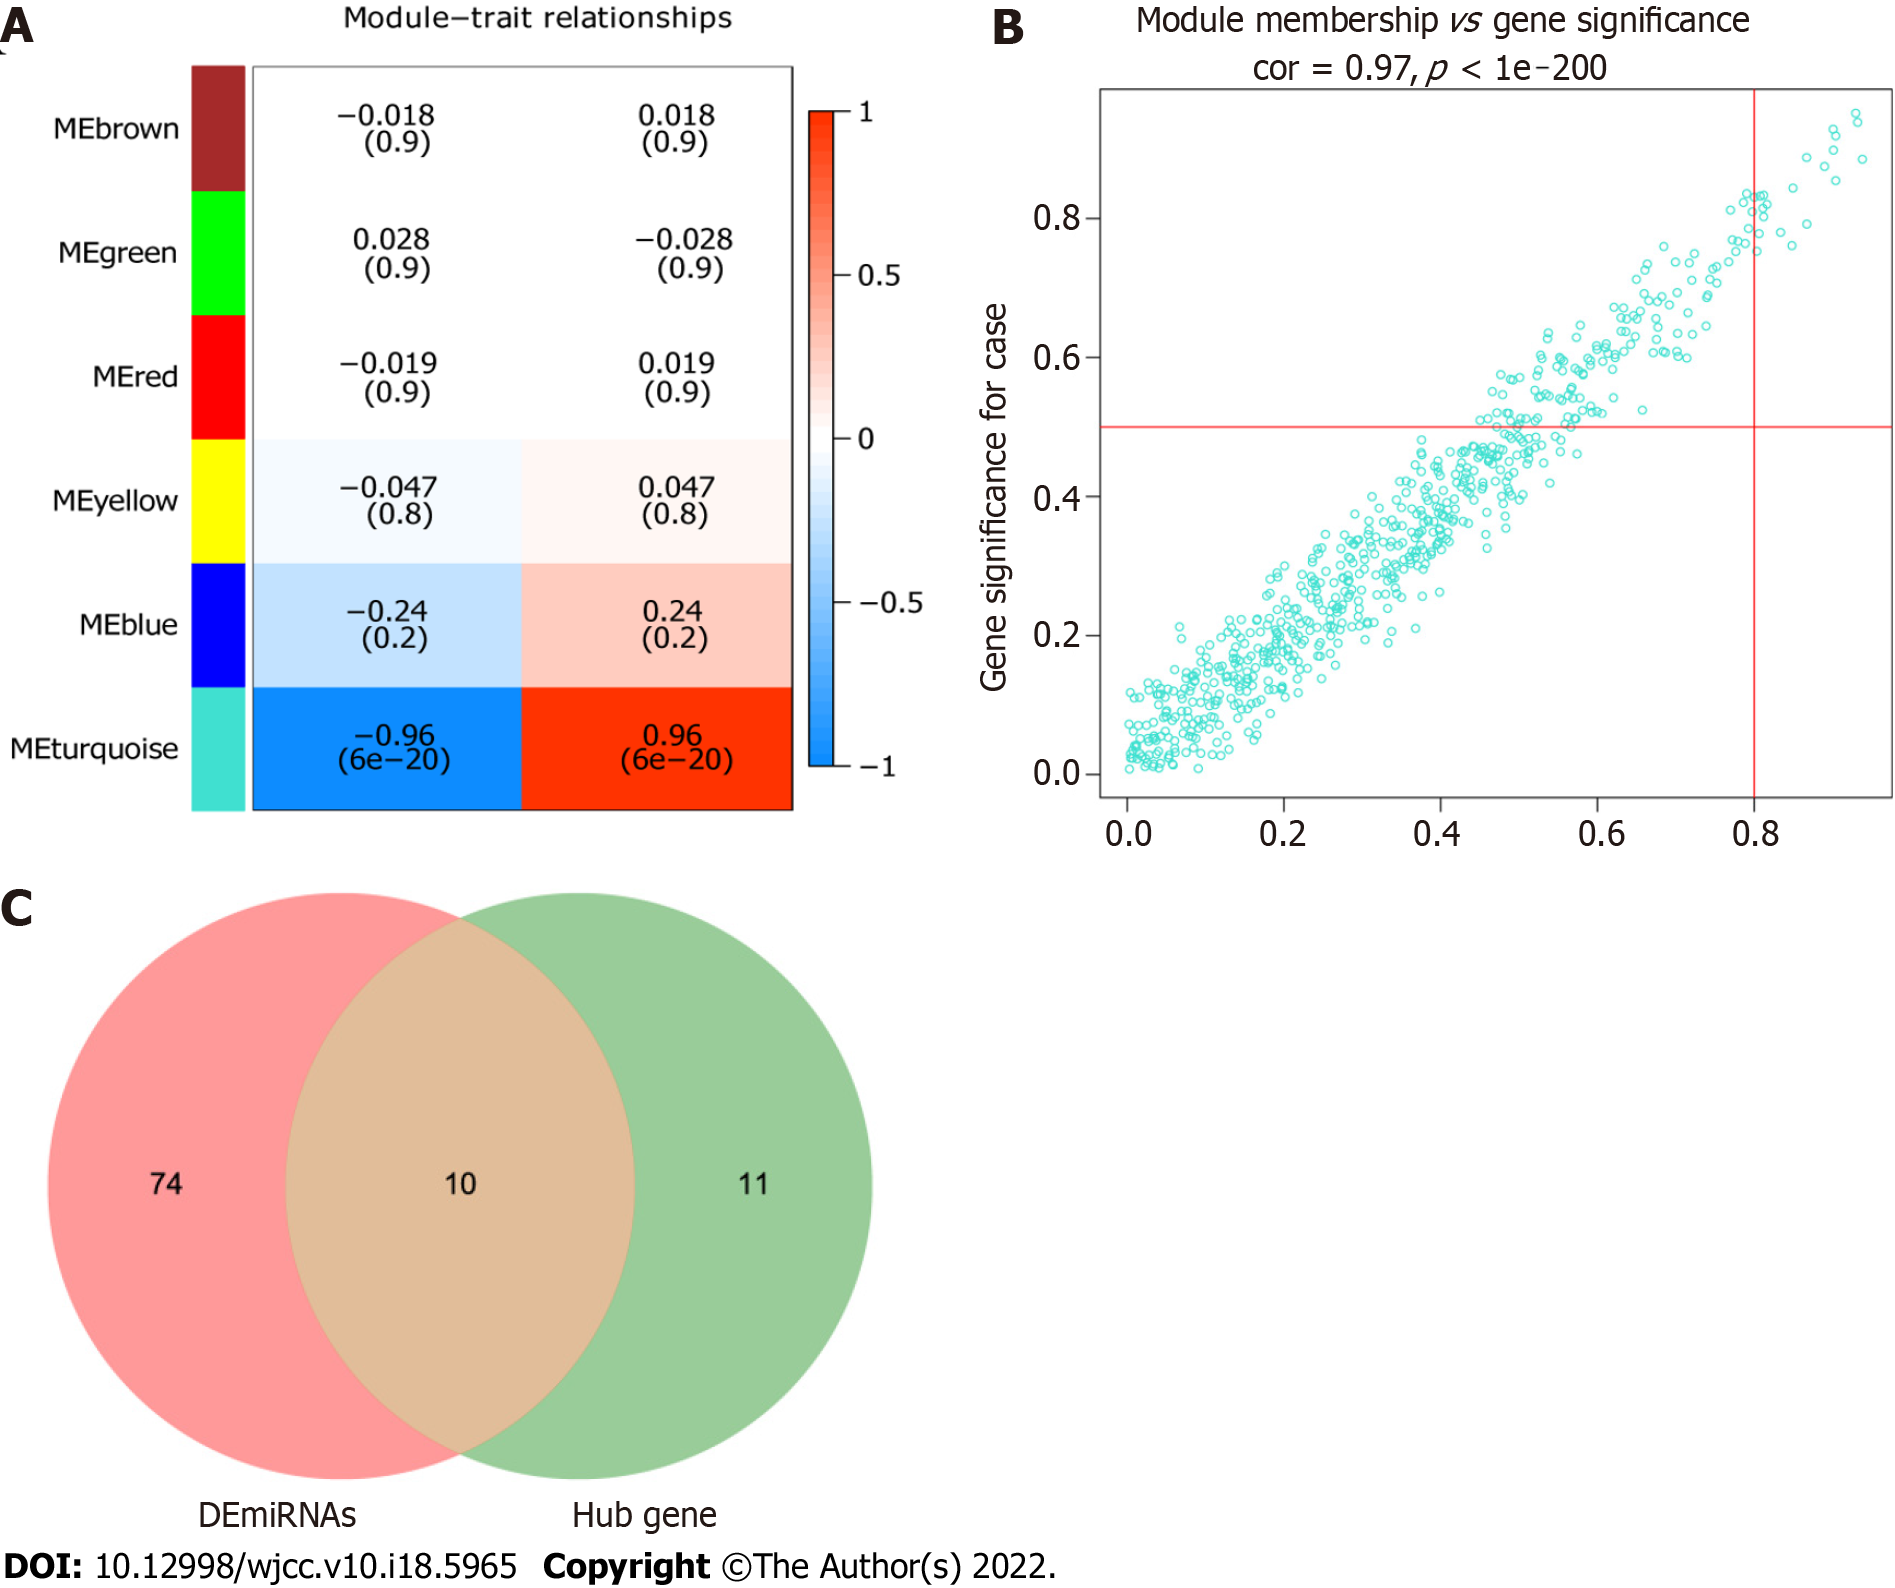
Figure 5 Hub module and hub miRNAs.
A: Heat map of the correlation between module eigengene and psoriasis. The correlation between turquoise module and psoriasis was highest; B: Scatter plot of miRNAs in the turquoise module. MiRNAs with module connectivity > 0.8 and clinical trait relationship > 0.5 were selected as candidate hub miRNAs; C: The 10 intersecting miRNAs were identified as real hub miRNAs.
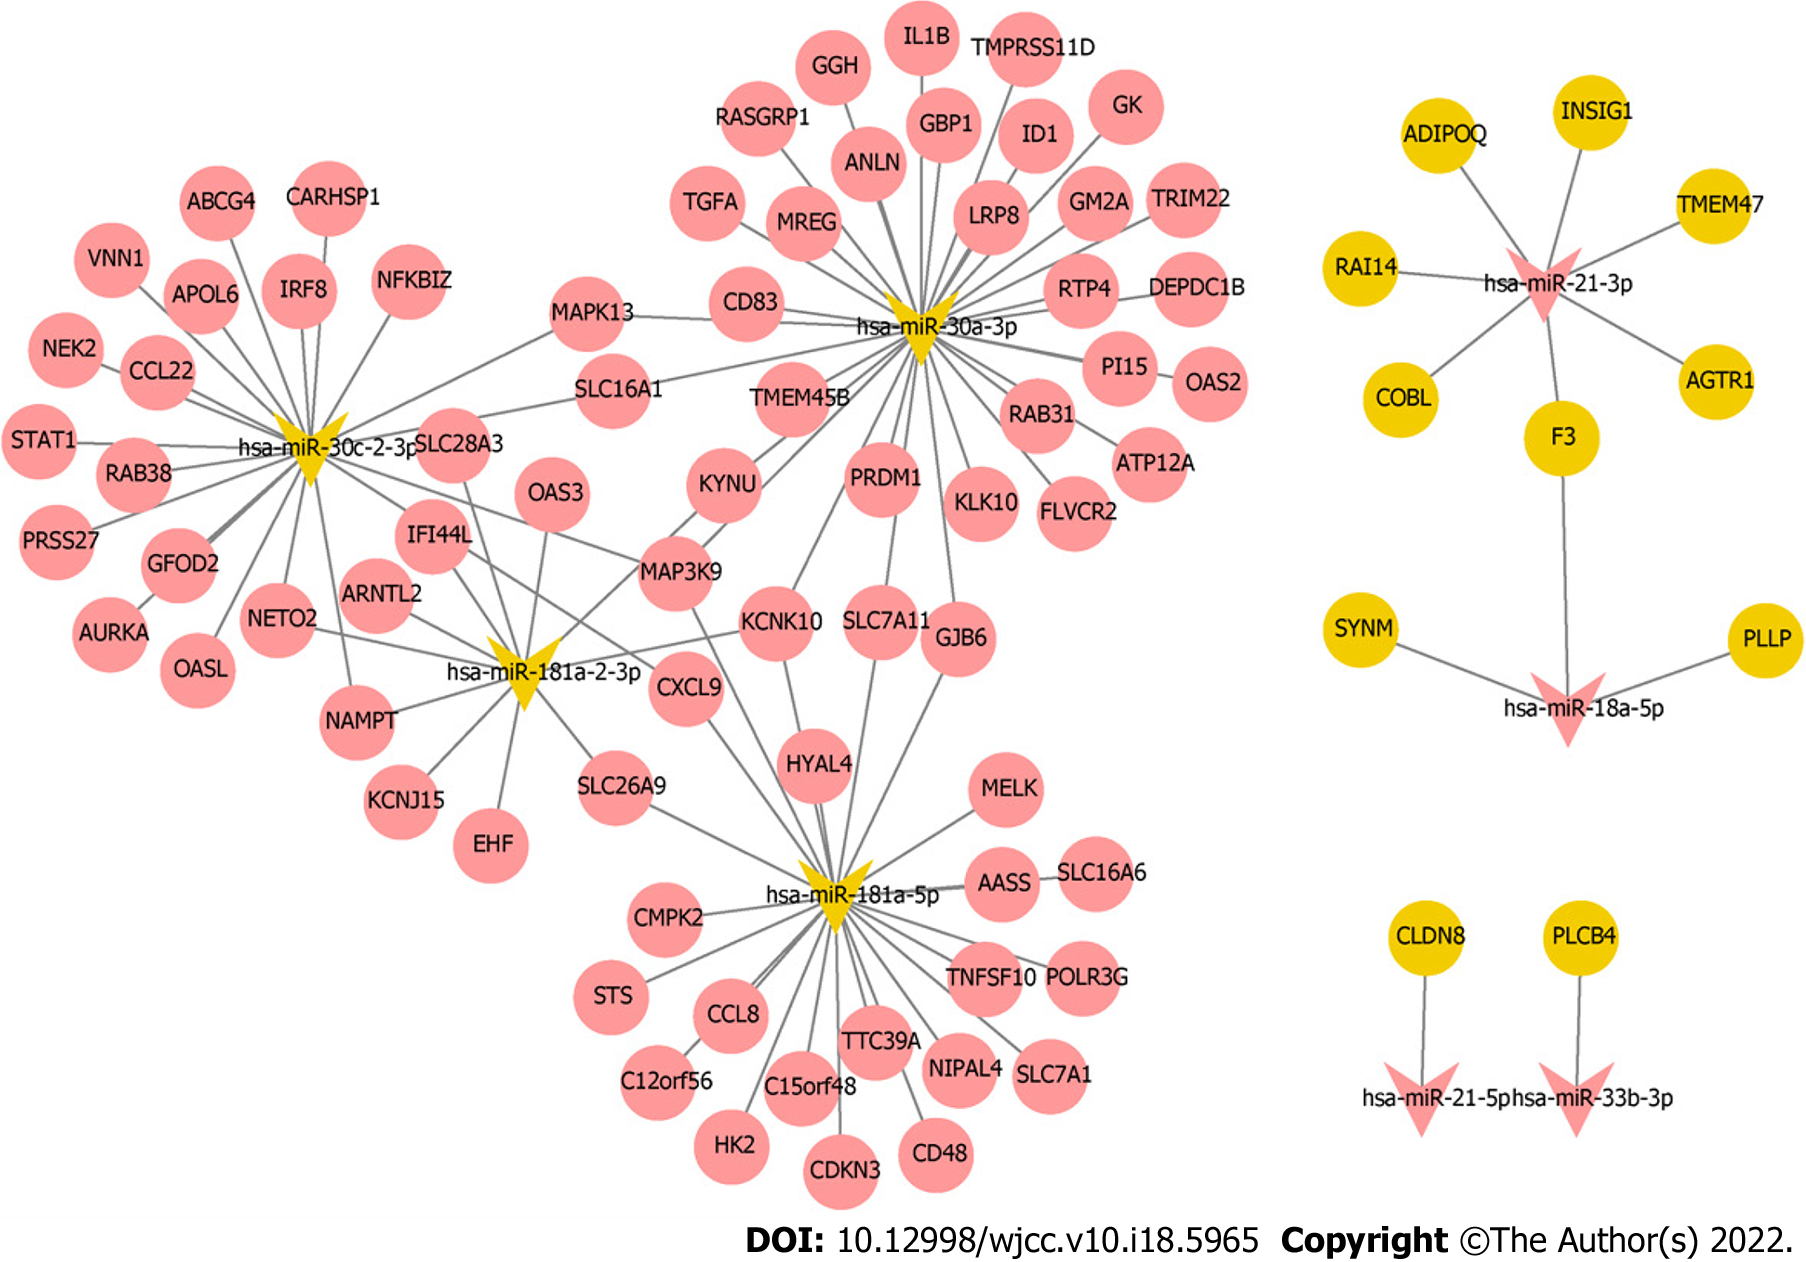
Figure 6 Regulatory network of miRNA-mRNA.
Red, yellow, oval, and V-shaped represent up-regulated, down-regulated, differentially expressed mRNAs, and hub differentially expressed miRNAs, respectively.
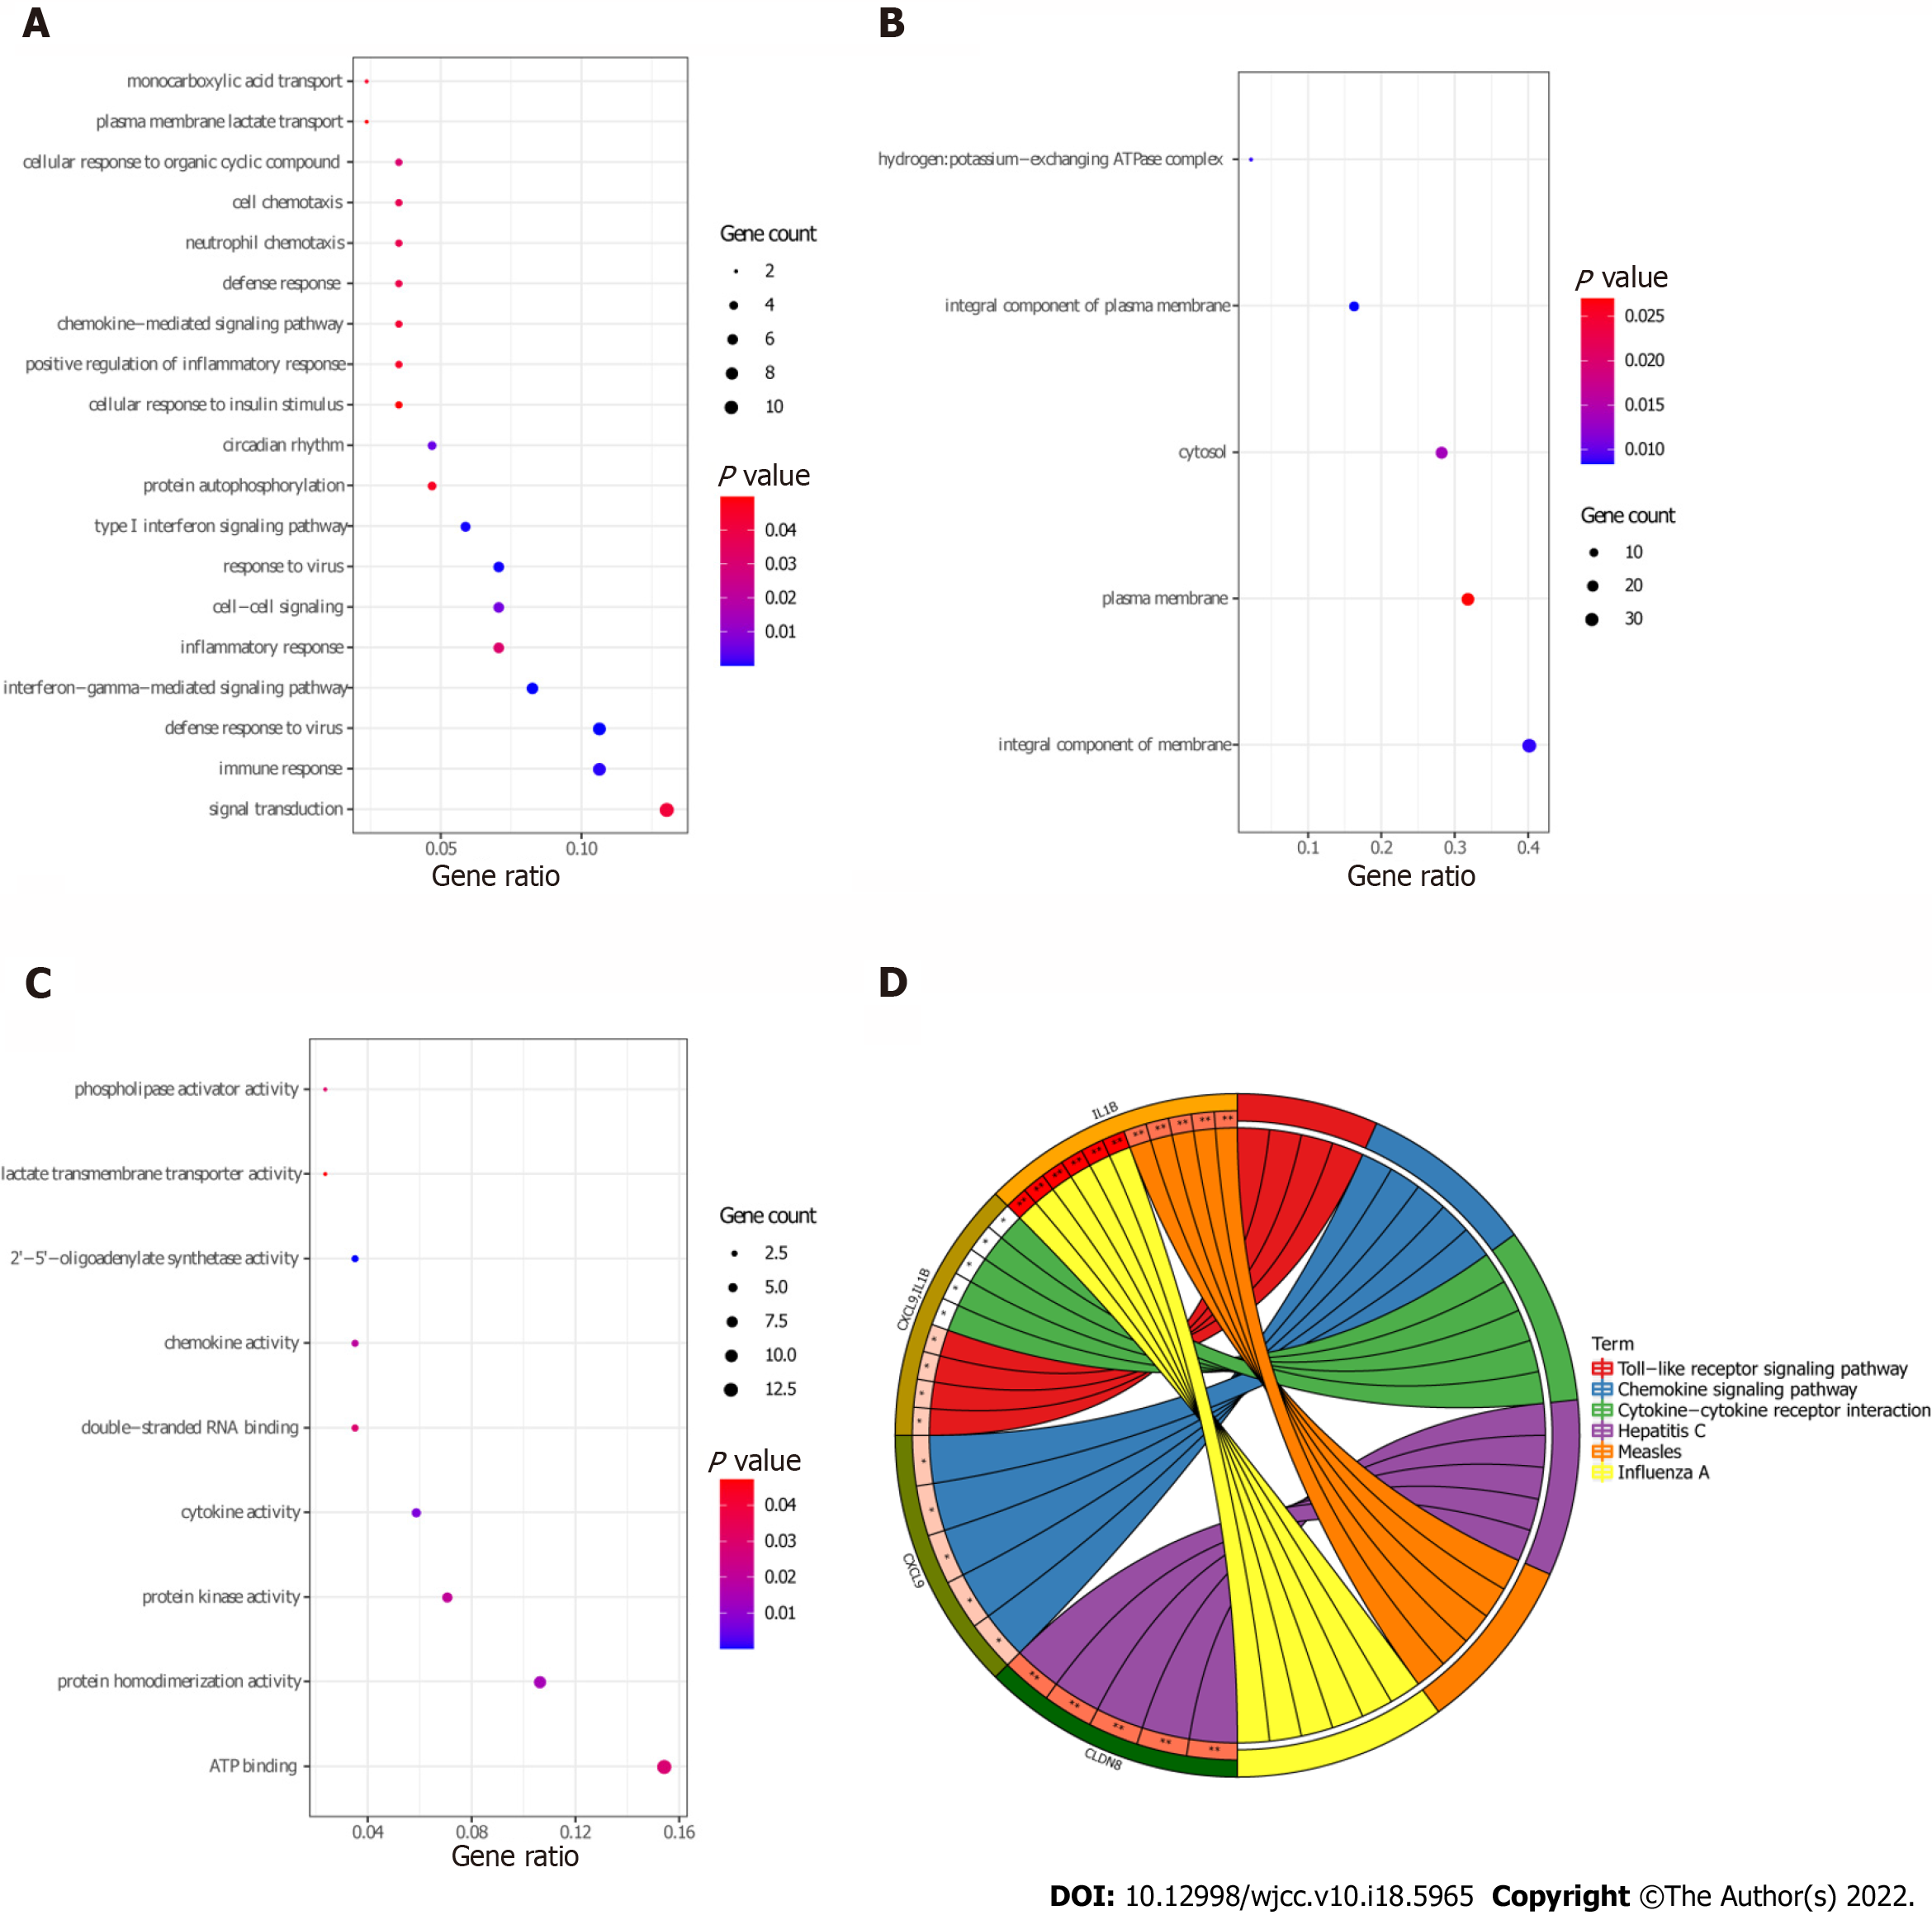
Figure 7 Gene Ontology and Kyoto Encyclopedia of Genes and Genomics analysis of target differentially expressed mRNAs.
A: biological processes terms were enriched of target differentially expressed mRNAs (DEmRNAs) by Gene Ontology (GO) function analysis; B: Cellular components terms were enriched of target DEmRNAs by GO function analysis; C: Molecular functions terms were enriched of target DEmRNAs by GO function analysis; D: Kyoto Encyclopedia of Genes and Genomics enrichment of target DEmRNAs.
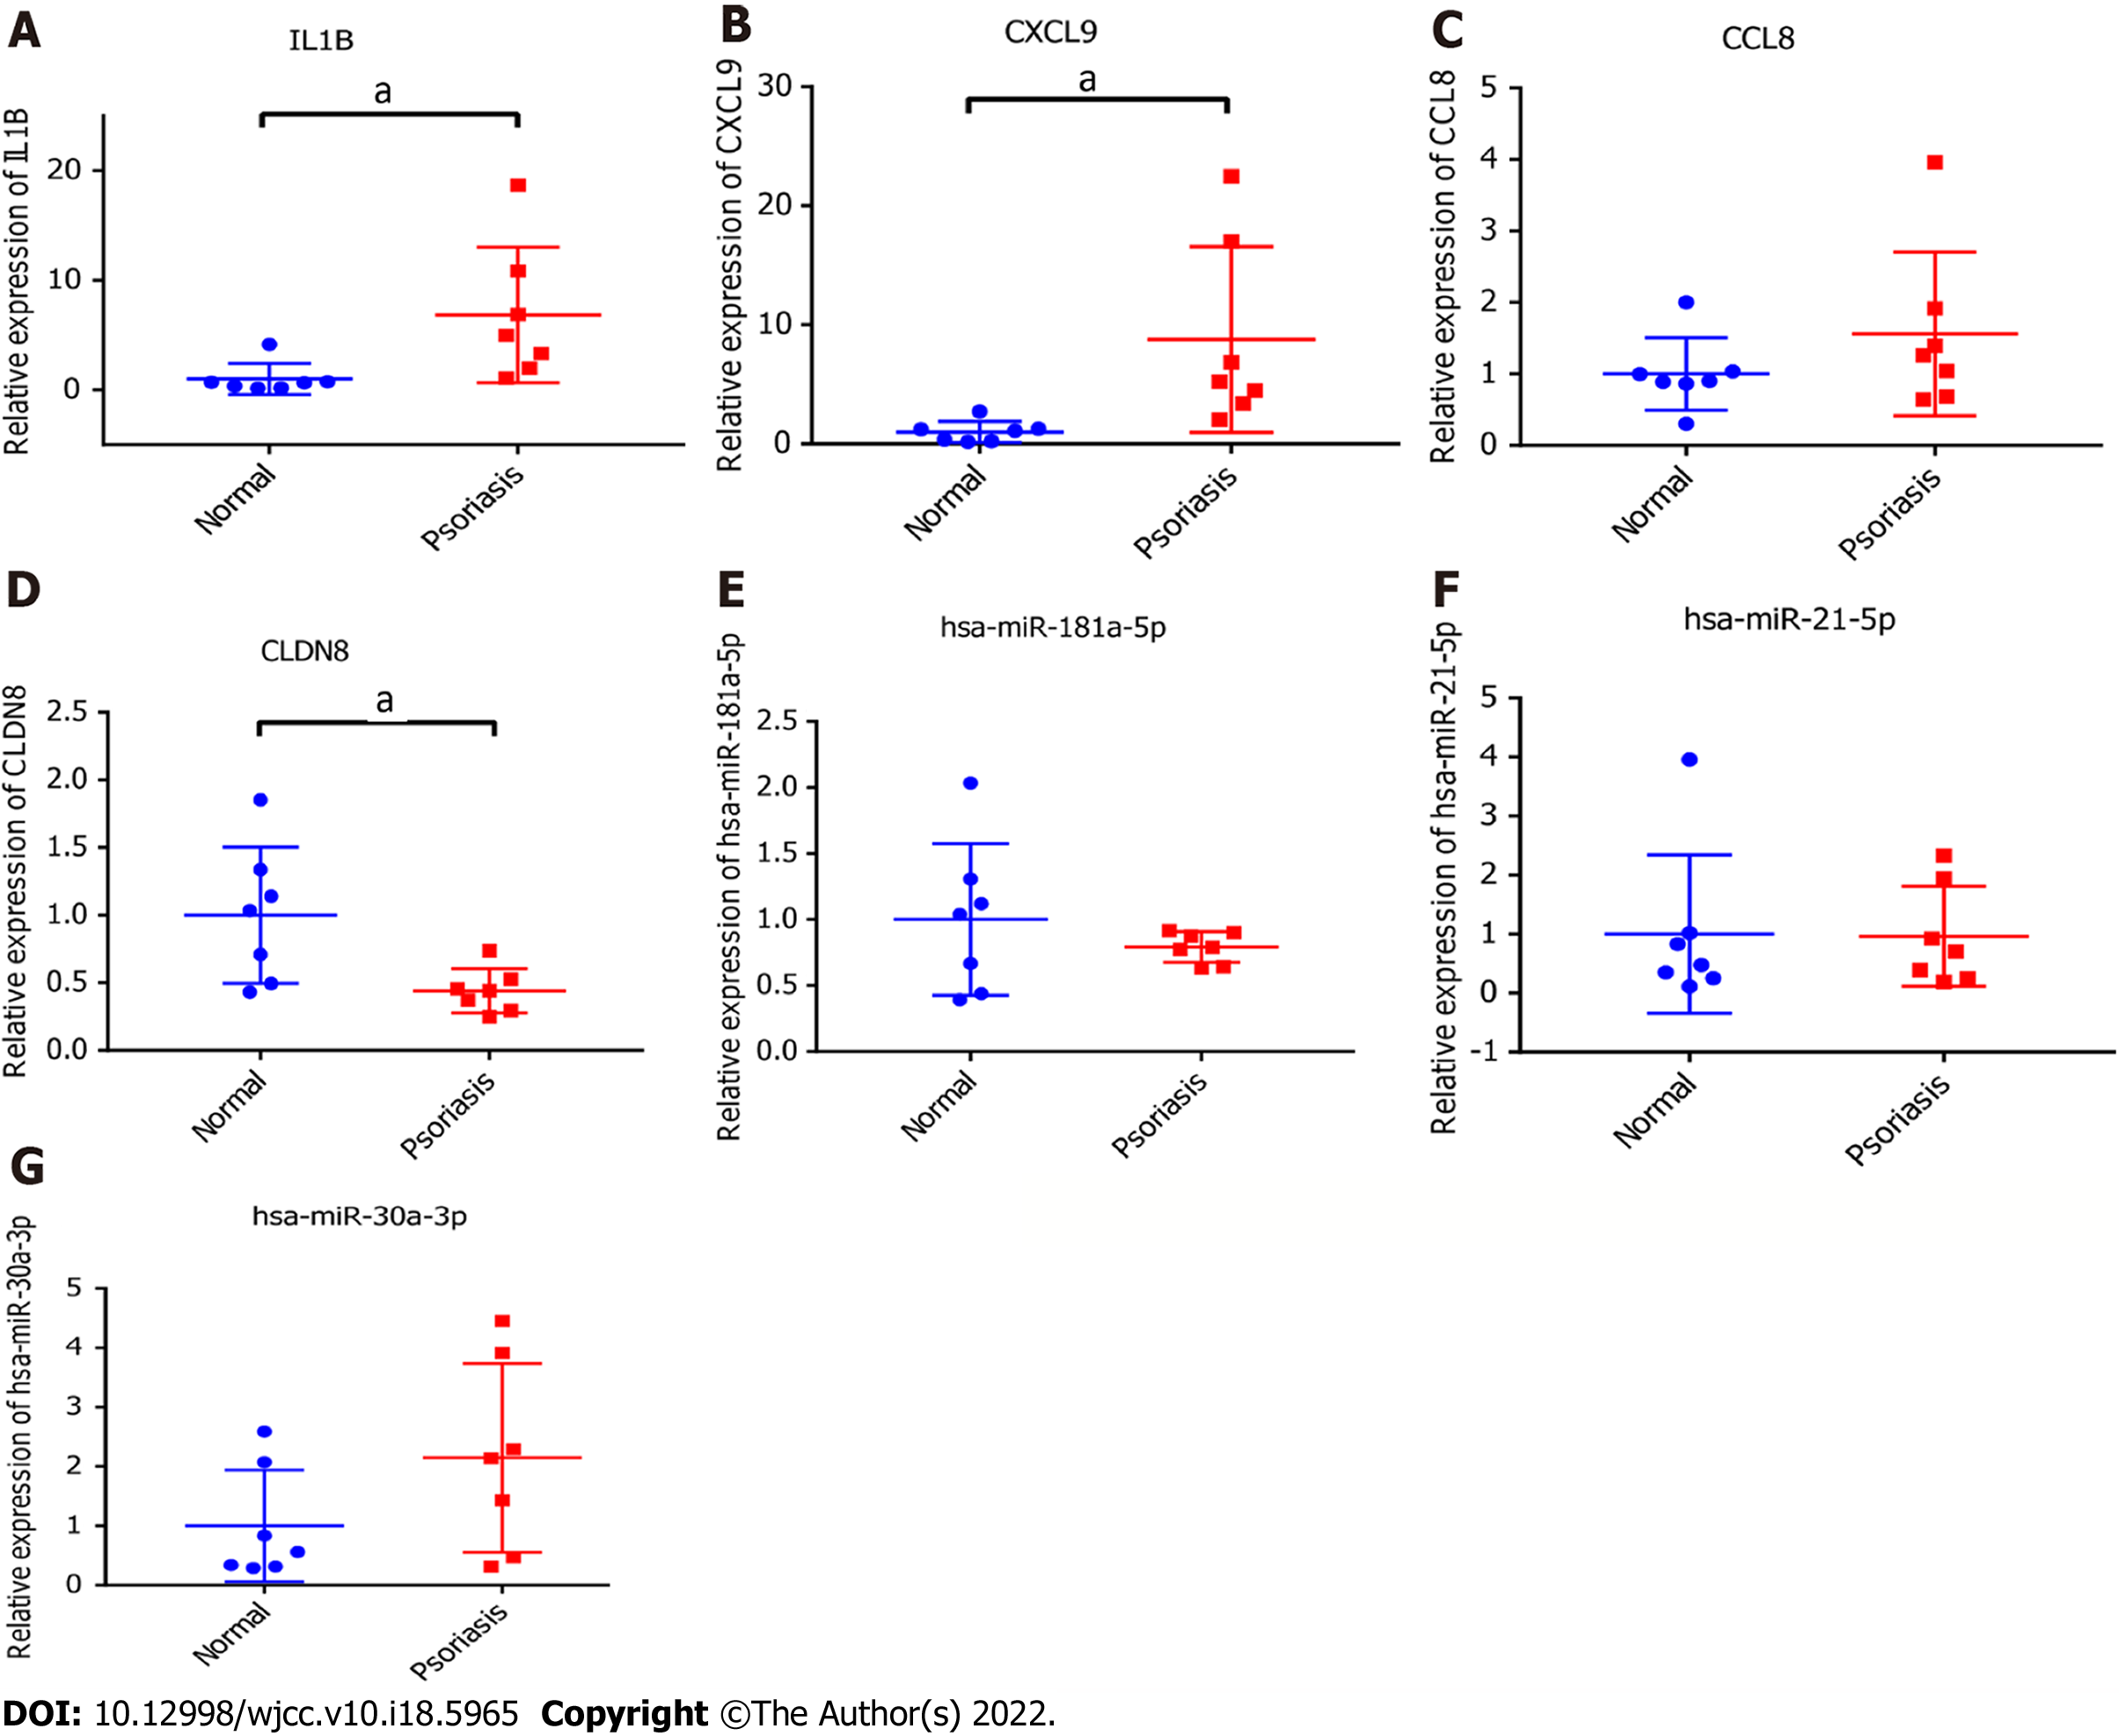
Figure 8 Real-time polymerase chain reaction validation.
A: Interleukin-1β; B: C-X-C motif chemokine ligand 9; C: C-C motif chemokine ligand 8; D: Claudin 8; E: hsa-miR-181a-5p; F: hsa-miR-21-5p; G: hsa-miR-30a-3p. aP < 0.05, P < 0.05 was considered significant.
- Citation: Shu X, Chen XX, Kang XD, Ran M, Wang YL, Zhao ZK, Li CX. Identification of potential key molecules and signaling pathways for psoriasis based on weighted gene co-expression network analysis. World J Clin Cases 2022; 10(18): 5965-5983
- URL: https://www.wjgnet.com/2307-8960/full/v10/i18/5965.htm
- DOI: https://dx.doi.org/10.12998/wjcc.v10.i18.5965


