Copyright
©The Author(s) 2022.
World J Clin Cases. Apr 26, 2022; 10(12): 3907-3915
Published online Apr 26, 2022. doi: 10.12998/wjcc.v10.i12.3907
Published online Apr 26, 2022. doi: 10.12998/wjcc.v10.i12.3907
Figure 1 Preoperative oral situation of a 50-year-old Chinese woman with posterior mandibular defect dentition.
A: Mandibular occlusal view; B: Buccal view from the left side; C: Mandibular occlusal view with the U shape tube fixed to the left dentition defect; D: Panoramic radiograph with the U-shaped tube fixed to the dentition defect.
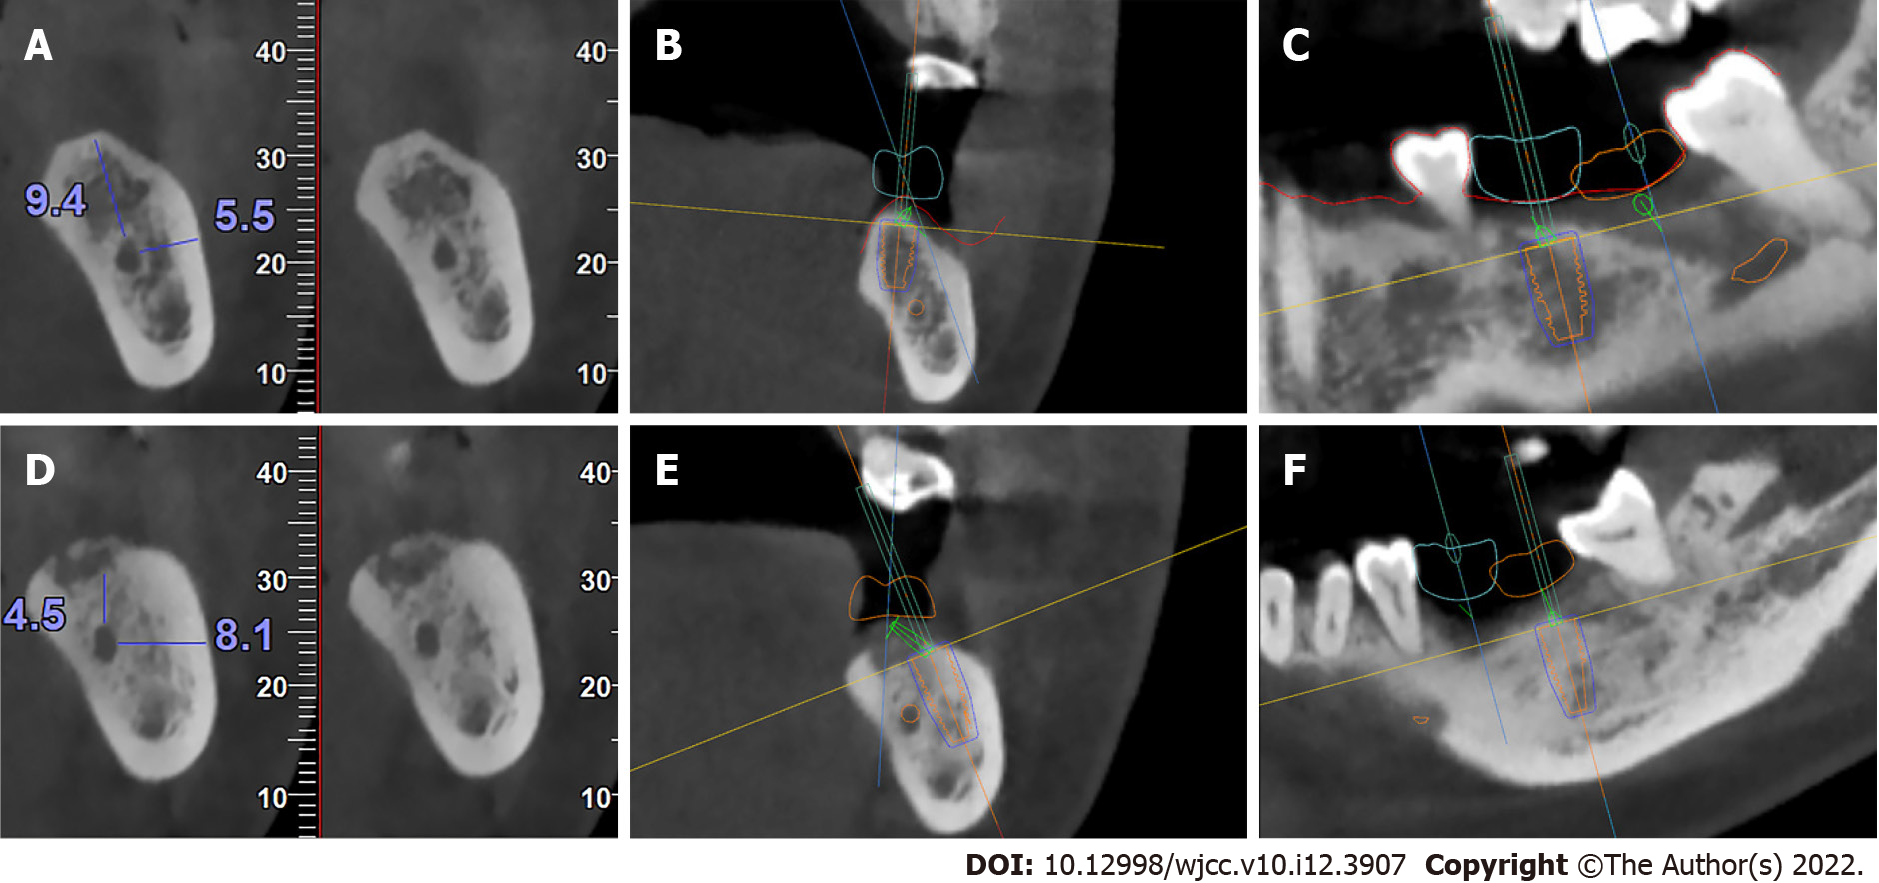
Figure 2 Arranging the proper position, length, diameter, and abutment for each implant.
A: The cone-beam computed topography (CBCT) results showed that the distance from the inferior alveolar nerve (IAN) to the crestal ridge was 9.4 mm, and the distance from the IAN to the buccal cortical bone wall was 5.5 mm in the first molar position; B: The sagittal view of the designed implant for the first molar; C: The coronal view of the designed implant for the first molar; D: The CBCT results showed that the distance from the IAN to the crestal ridge was 4.5 mm, and the distance from the IAN to the buccal cortical bone wall was 8.1 mm in the second molar position; E: The sagittal view of the designed implant for the second molar; F: The coronal view of the designed implant for the second molar.
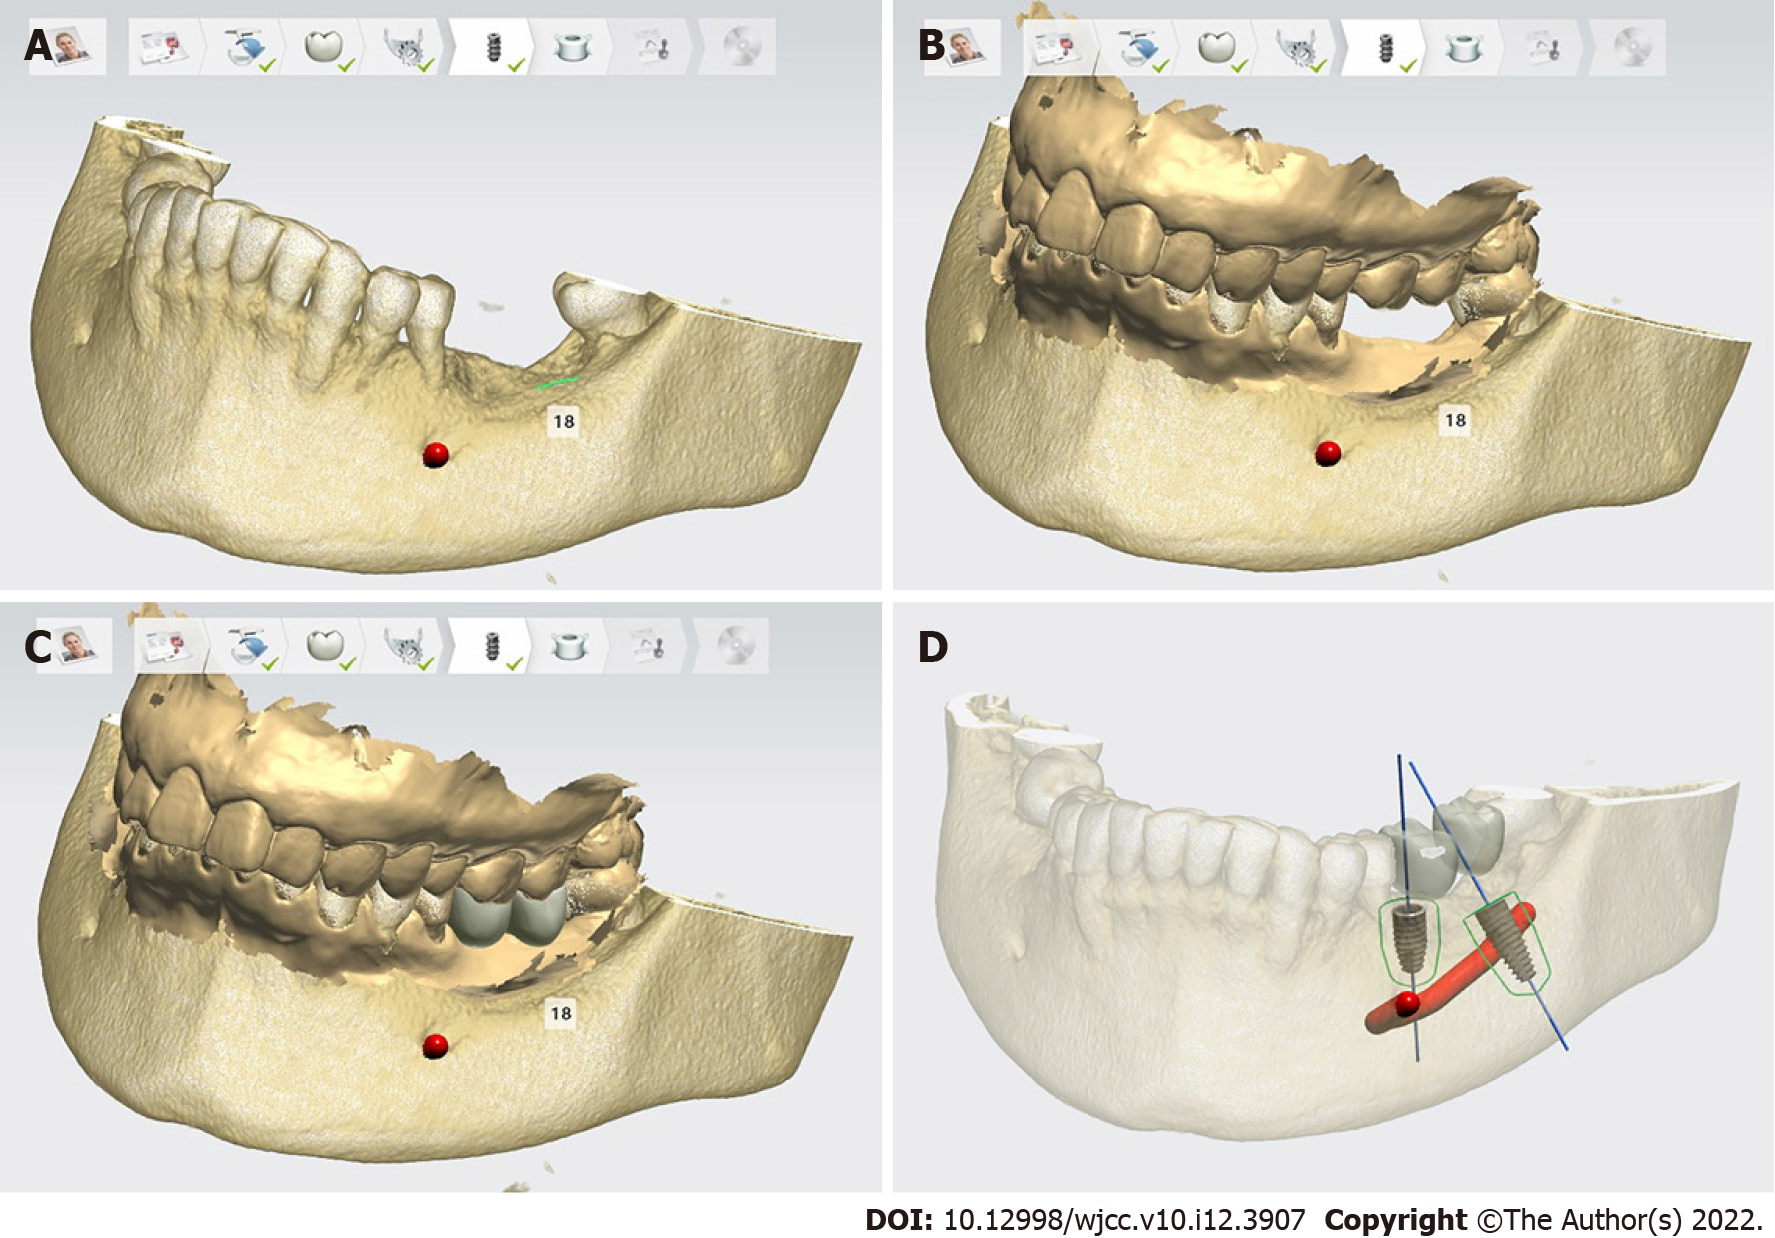
Figure 3 Prosthodontic treatment planning software.
A: The osseous and dental tissue of mandible; B: Hard tissue, soft tissue and occlusion as a merged file; C: Placing suitable prosthesis at the dentition defect site; D: Arranging the implants below the crowns.
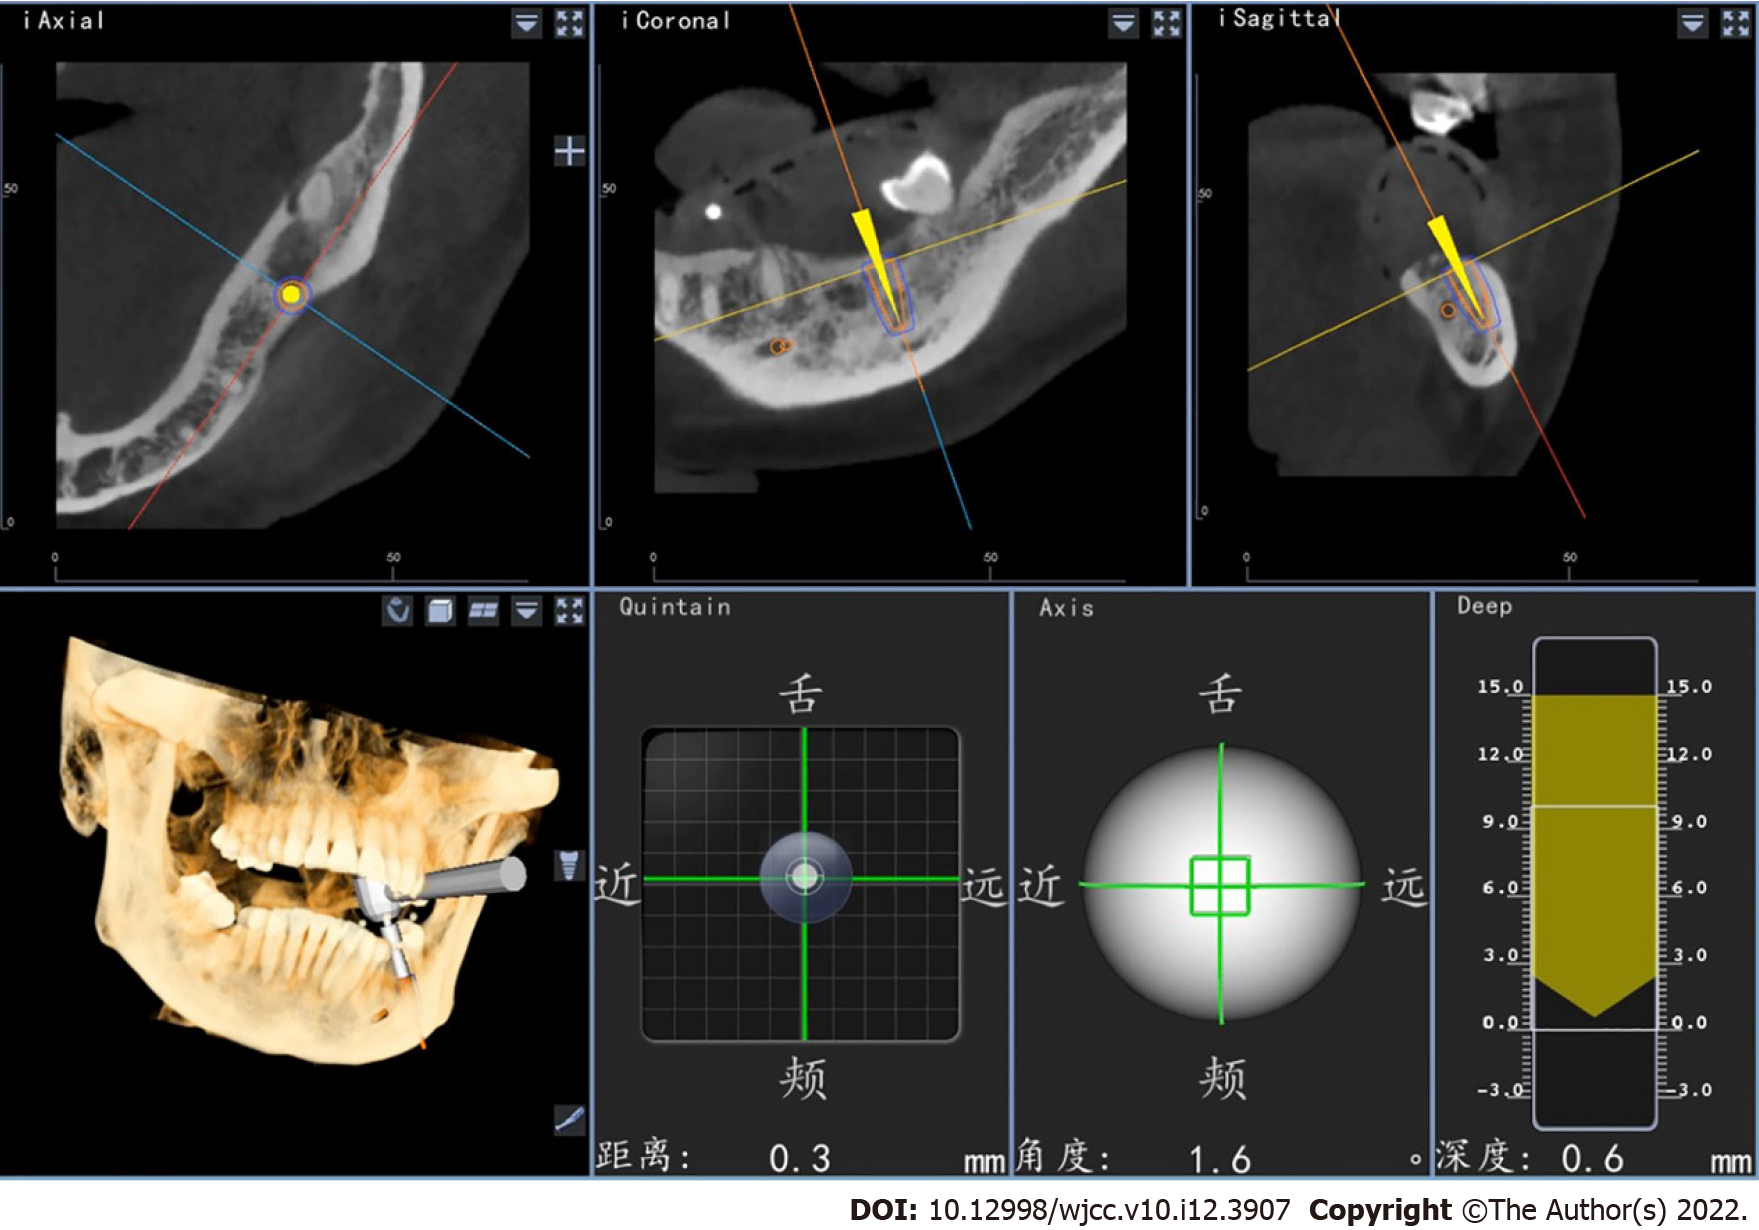
Figure 4 The navigation operation views are divided into dynamic and static views (Upper column is dynamic view, bottom columns are static views).
Upper column: 2D dynamic view: slice maps of the implant drill location (axial, coronal and sagittal views); Bottom column left 1: 3D reconstruction graph: hard tissue model; Bottom column left 2: Distance graph of the drill tip deviates from the designed implant entry point; Bottom column right 2: Angle graph of the drill deviates from the designed implant axis; Bottom column right 1: Depth map of the drill tip in the designed implant direction, green indicates that it can continue drilling, yellow indicates vigilance, red indicates excess (tolerance value can be artificially set).
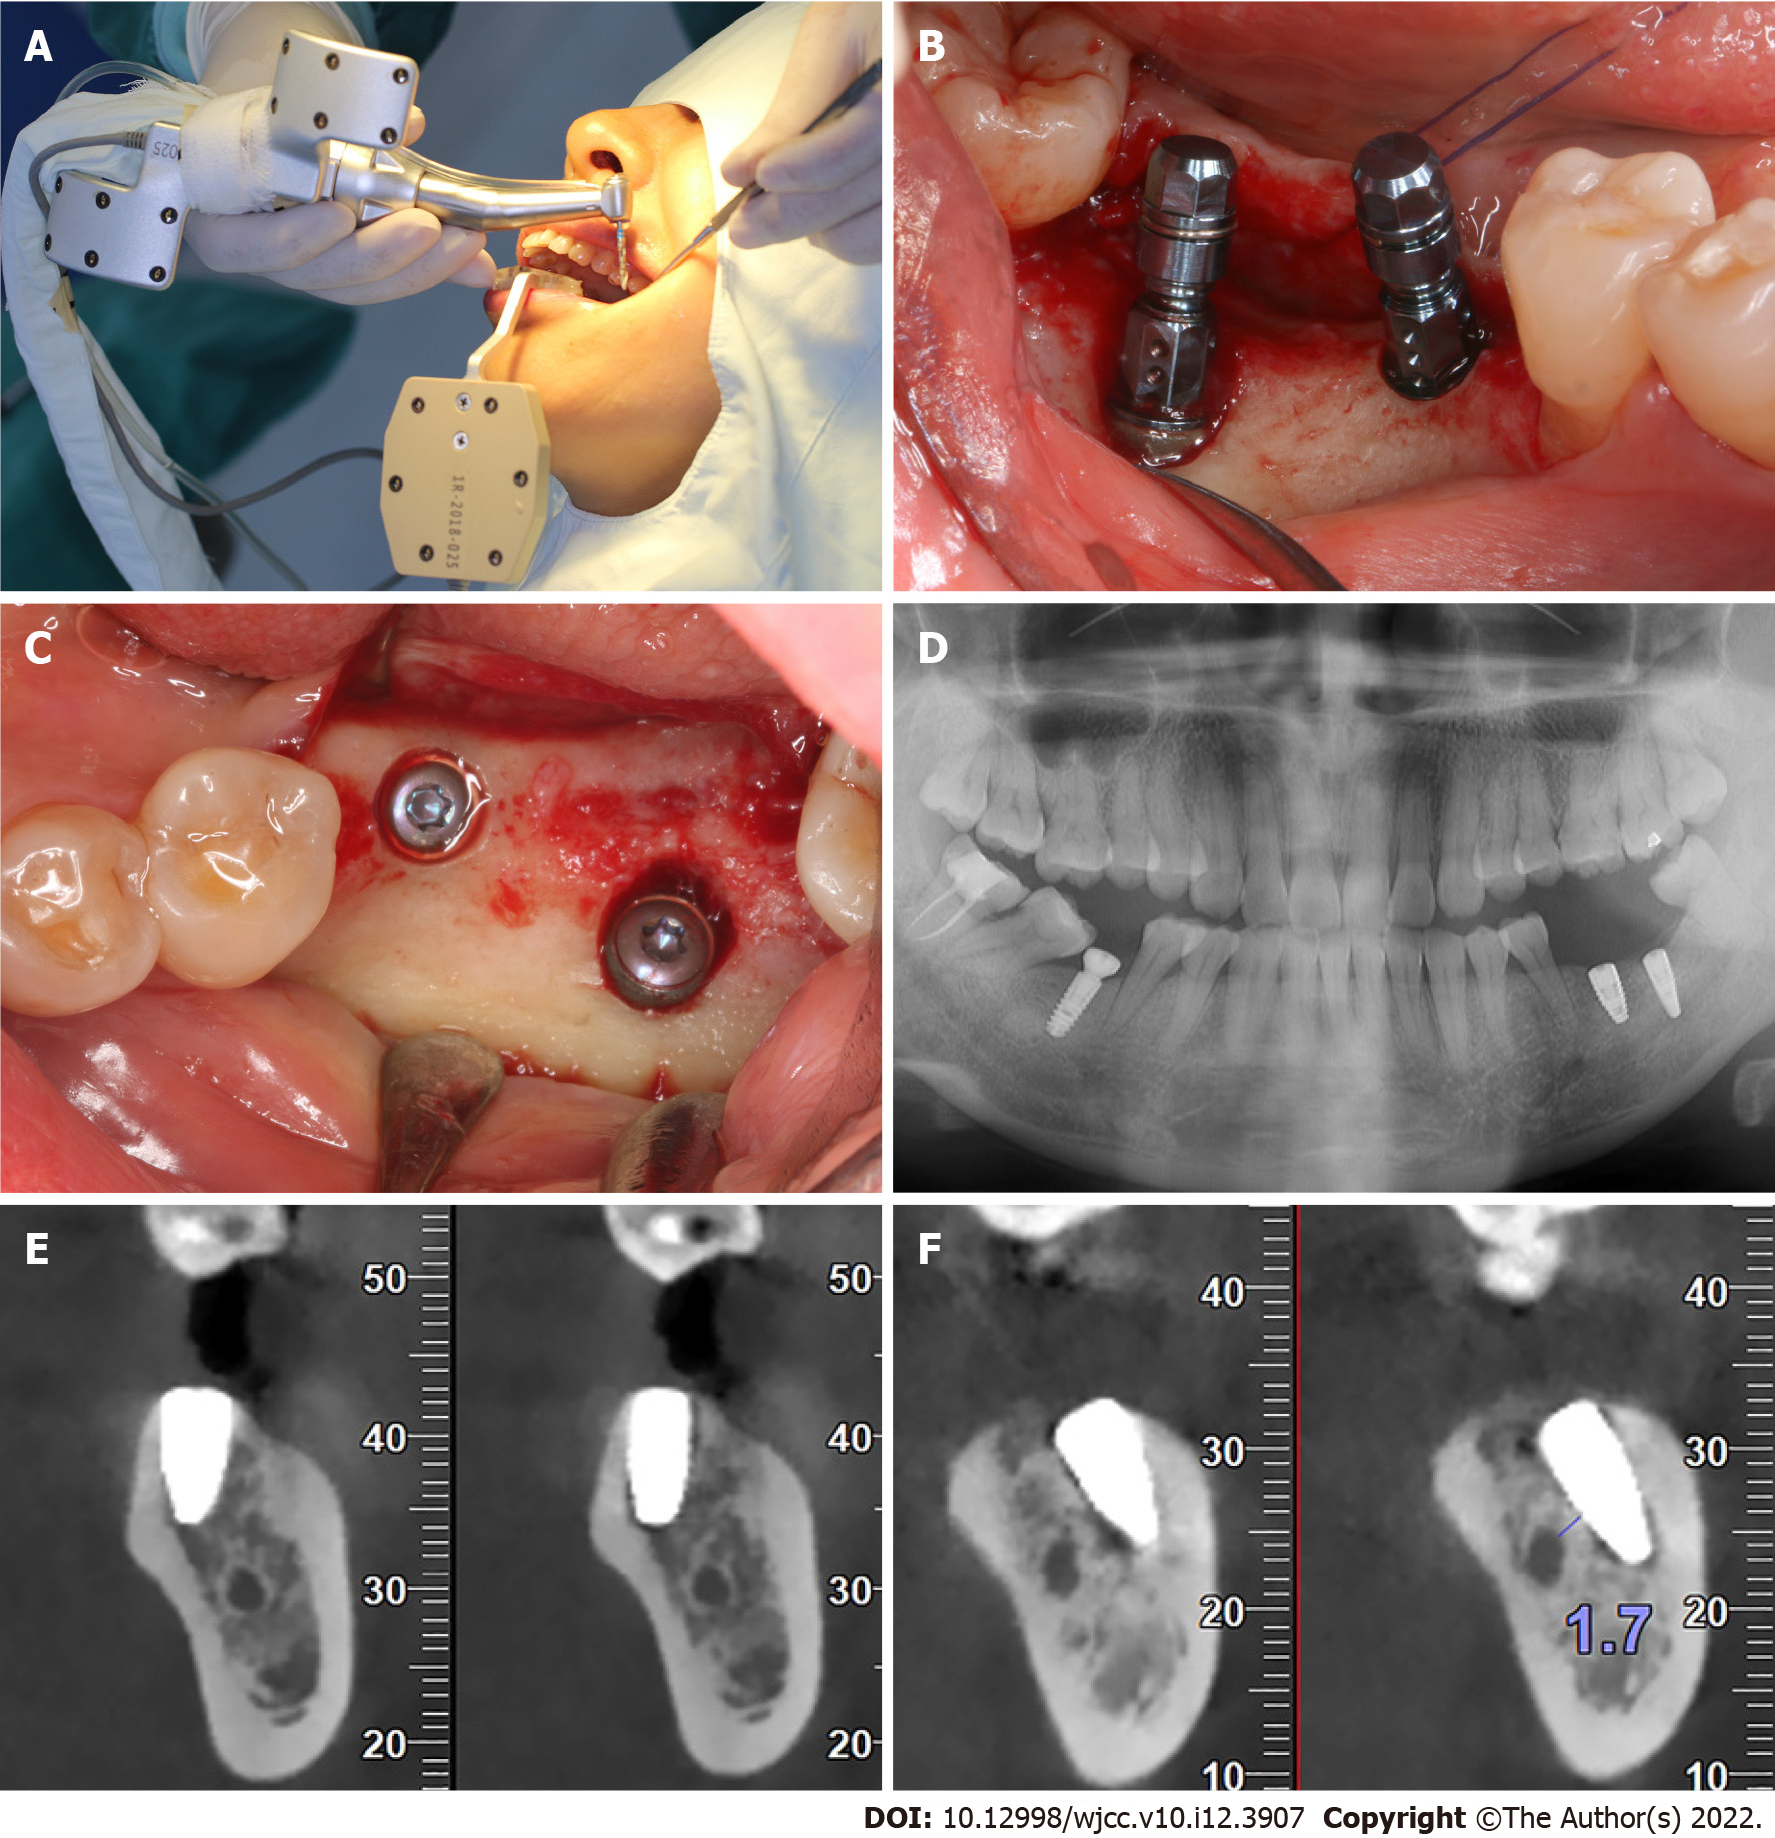
Figure 5 Implant placement surgery.
A: Surgical process; B: Buccal view of the implants; C: Occlusal view of the implant entry points; D: Panoramic radiograph after the surgery; E: Sagittal view of the first molar; F: Sagittal view of the second molar. The implant was 1.7 mm away from inferior alveolar nerve.
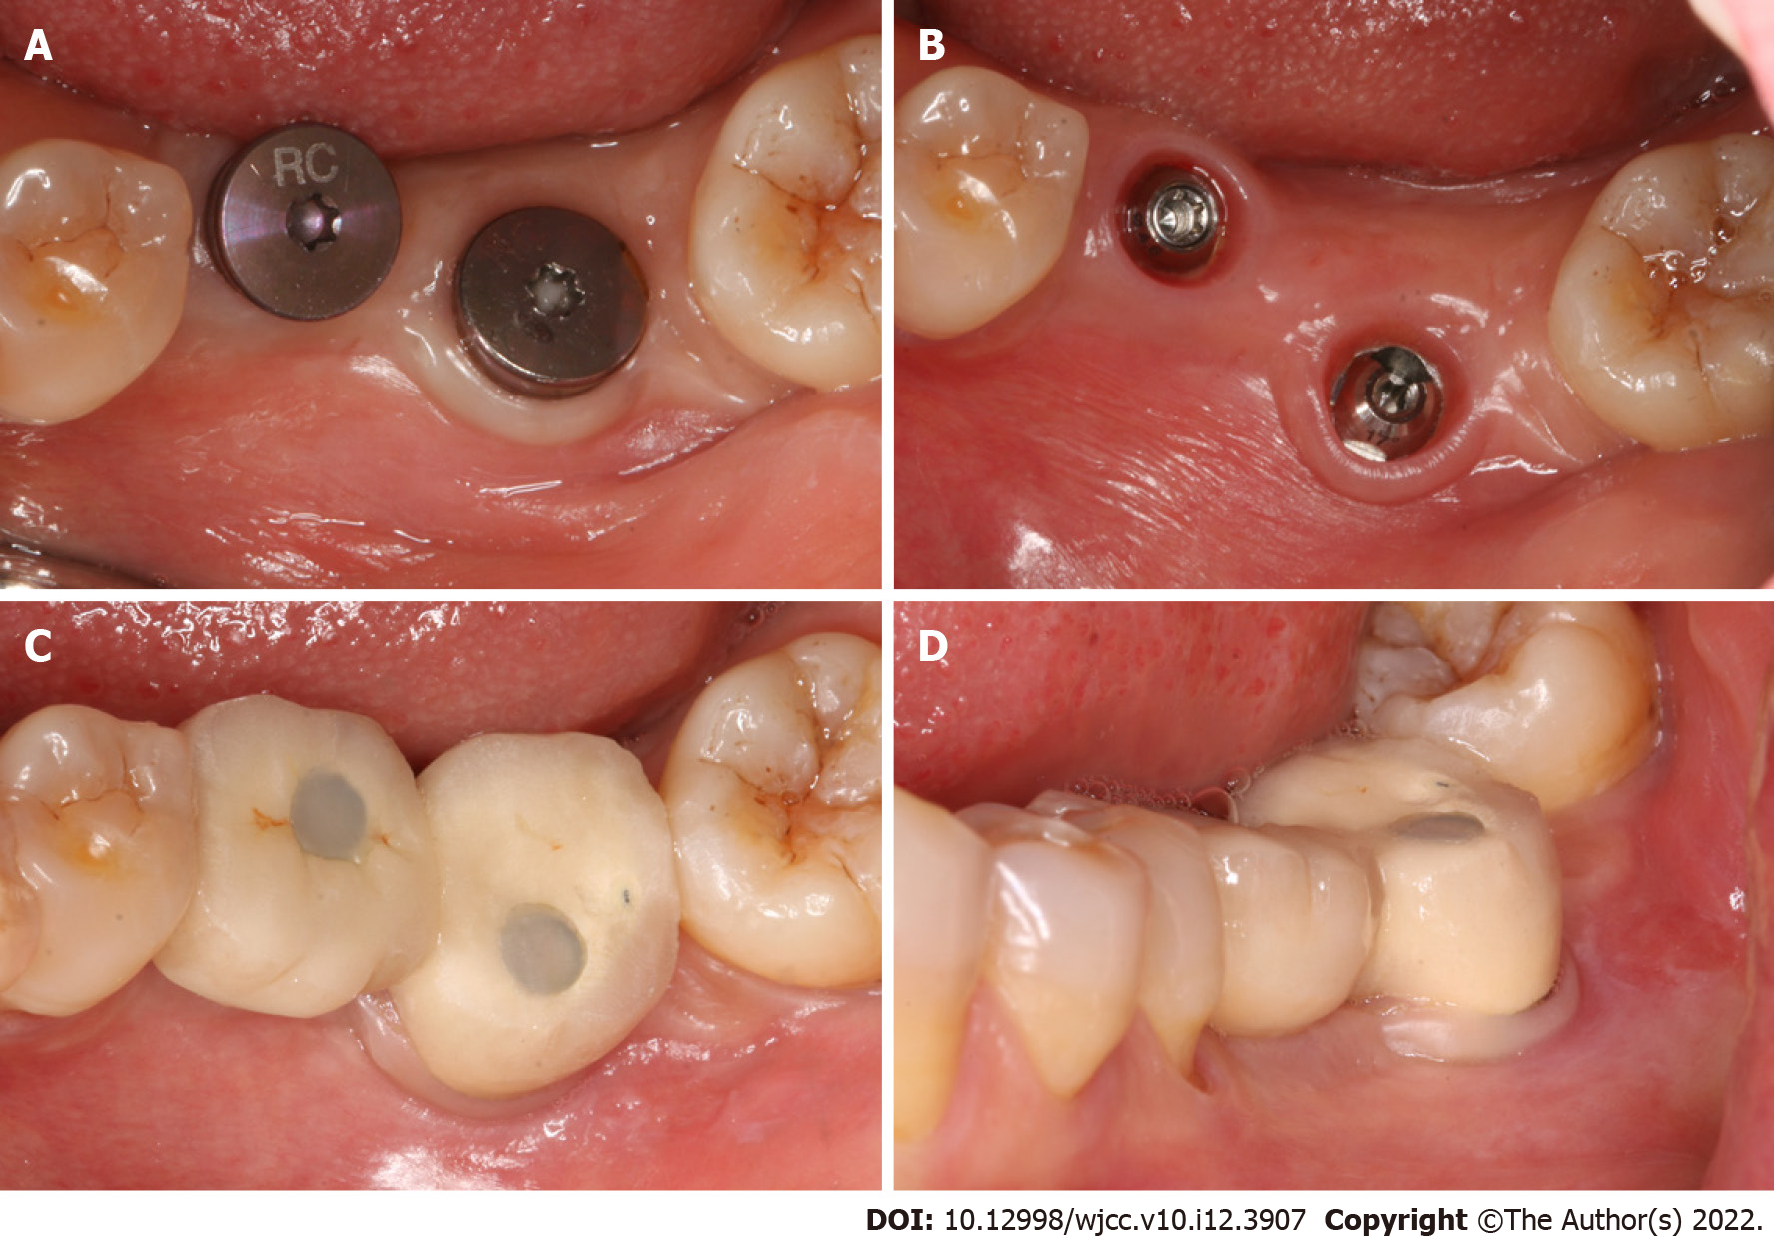
Figure 6 Prosthesis complement.
A: Occlusal view before impression taken; B: Occlusal view of the composite abutments; C: Occlusal view of the final prosthesis; D: Buccal view of the final prosthesis.
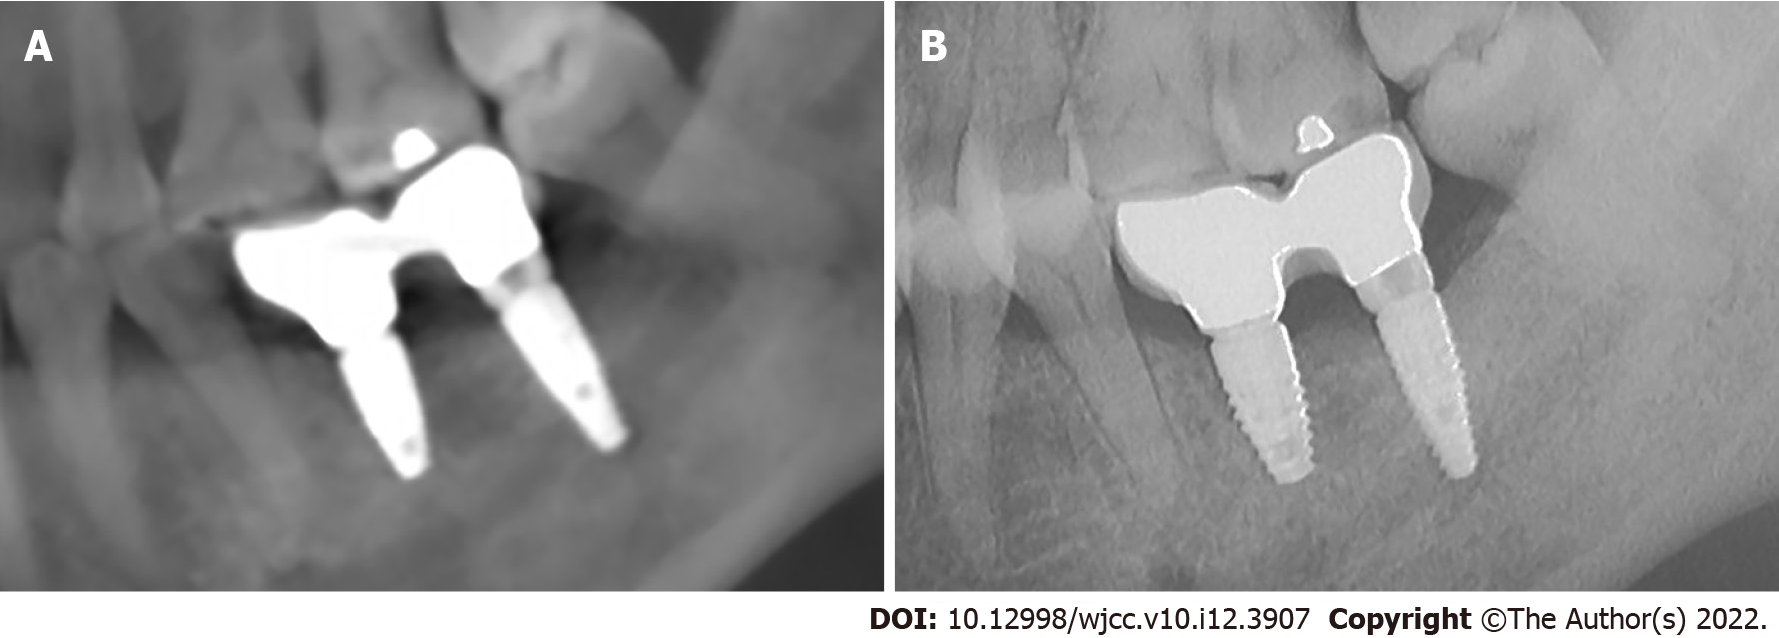
Figure 7 X-ray examination results.
A: Immediately after the prosthesis fixation; B: Six month after the prosthesis fixation.
- Citation: Chen LW, Zhao XE, Yan Q, Xia HB, Sun Q. Dynamic navigation system-guided trans-inferior alveolar nerve implant placement in the atrophic posterior mandible: A case report. World J Clin Cases 2022; 10(12): 3907-3915
- URL: https://www.wjgnet.com/2307-8960/full/v10/i12/3907.htm
- DOI: https://dx.doi.org/10.12998/wjcc.v10.i12.3907


