Copyright
©The Author(s) 2022.
World J Clin Cases. Apr 26, 2022; 10(12): 3773-3786
Published online Apr 26, 2022. doi: 10.12998/wjcc.v10.i12.3773
Published online Apr 26, 2022. doi: 10.12998/wjcc.v10.i12.3773
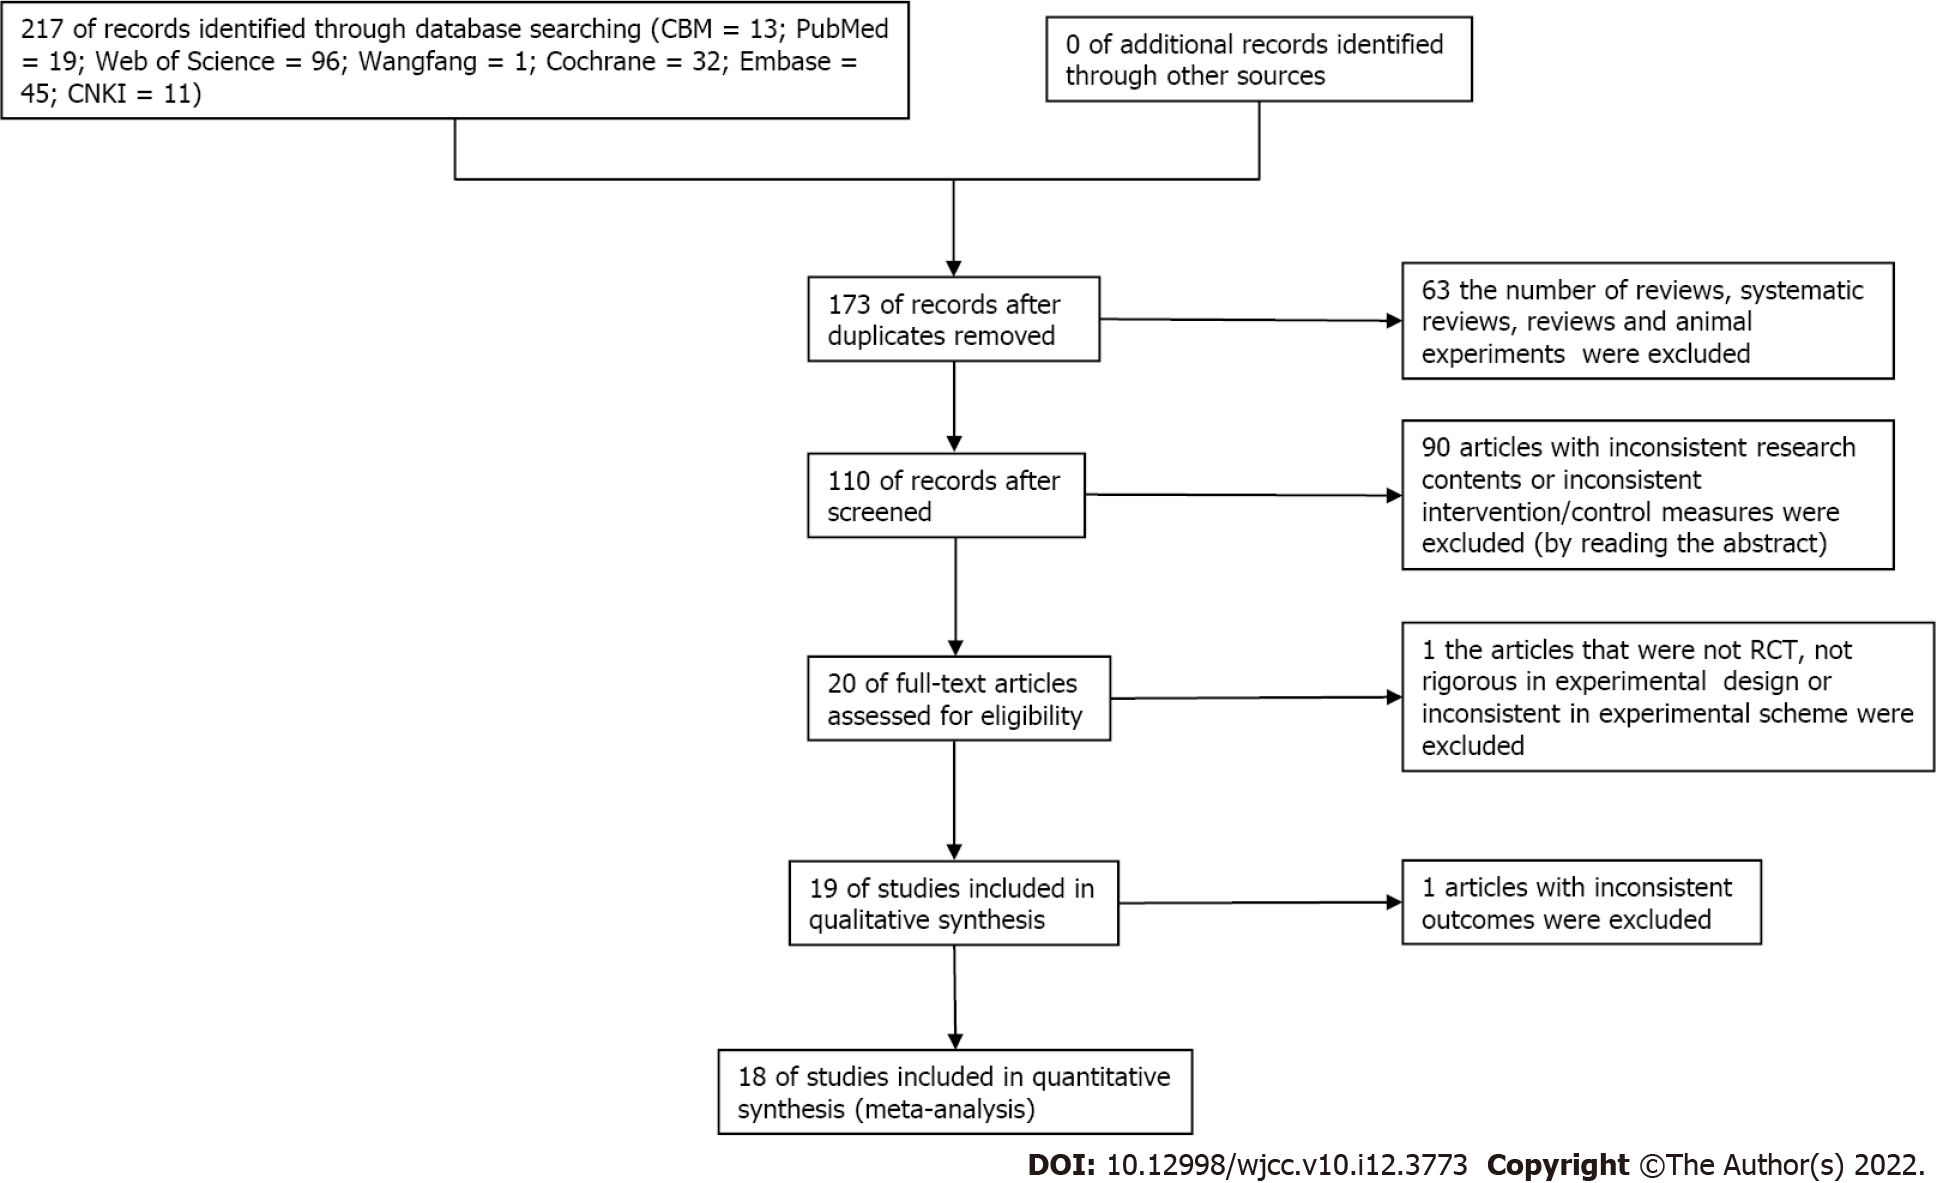
Figure 1 Flow diagram of study selection (up to June 2021).
CBM: Chinese Biological Medical database; CNKI: China National Knowledge Infrastructure; VIP: China Science and Technology Journal database; WF: Wanfang database and foreign language databases including PubMed, Embase, Cochrane Library, Web of Science, etc.
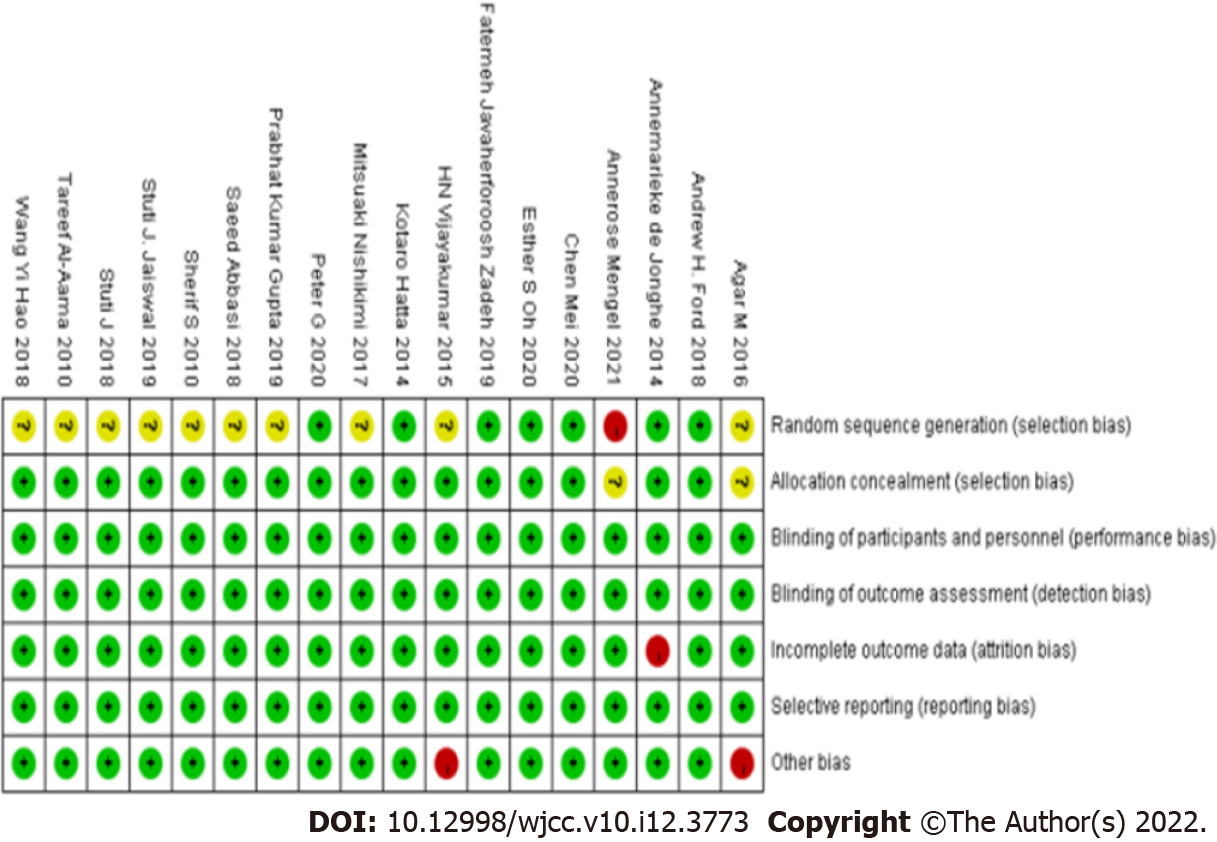
Figure 2 Methodological quality of the included studies.
Category: "+" up to standard, "-" not up to standard.
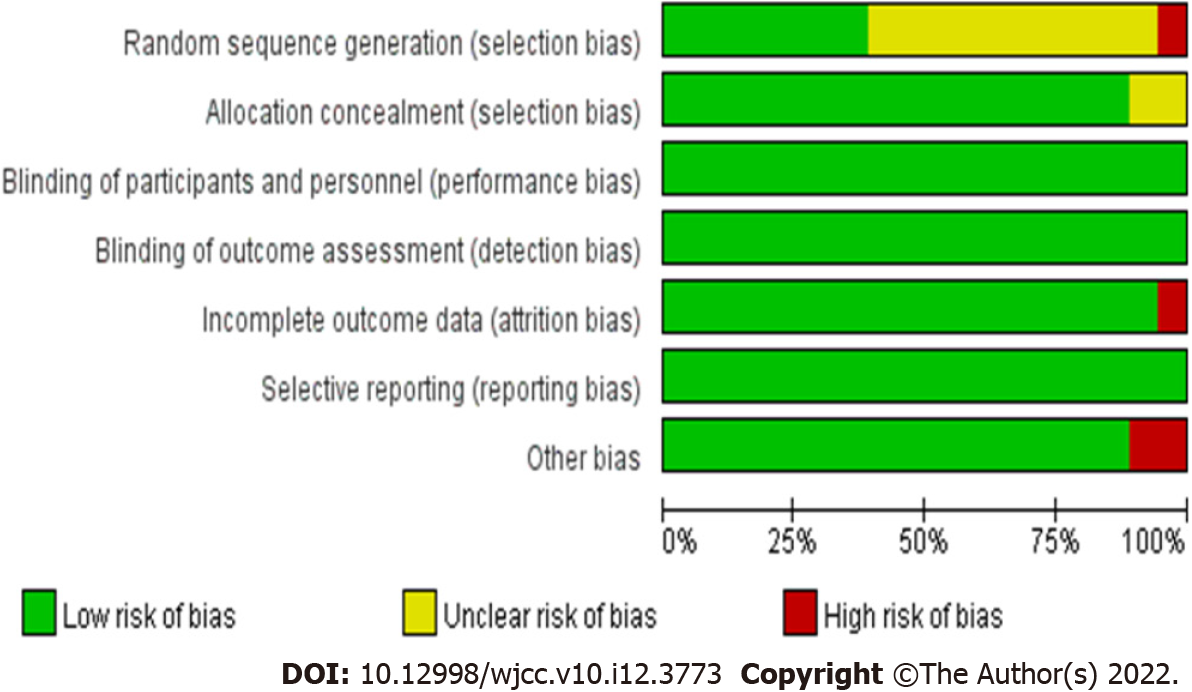
Figure 3 Distribution of the methodological quality of the included studies.
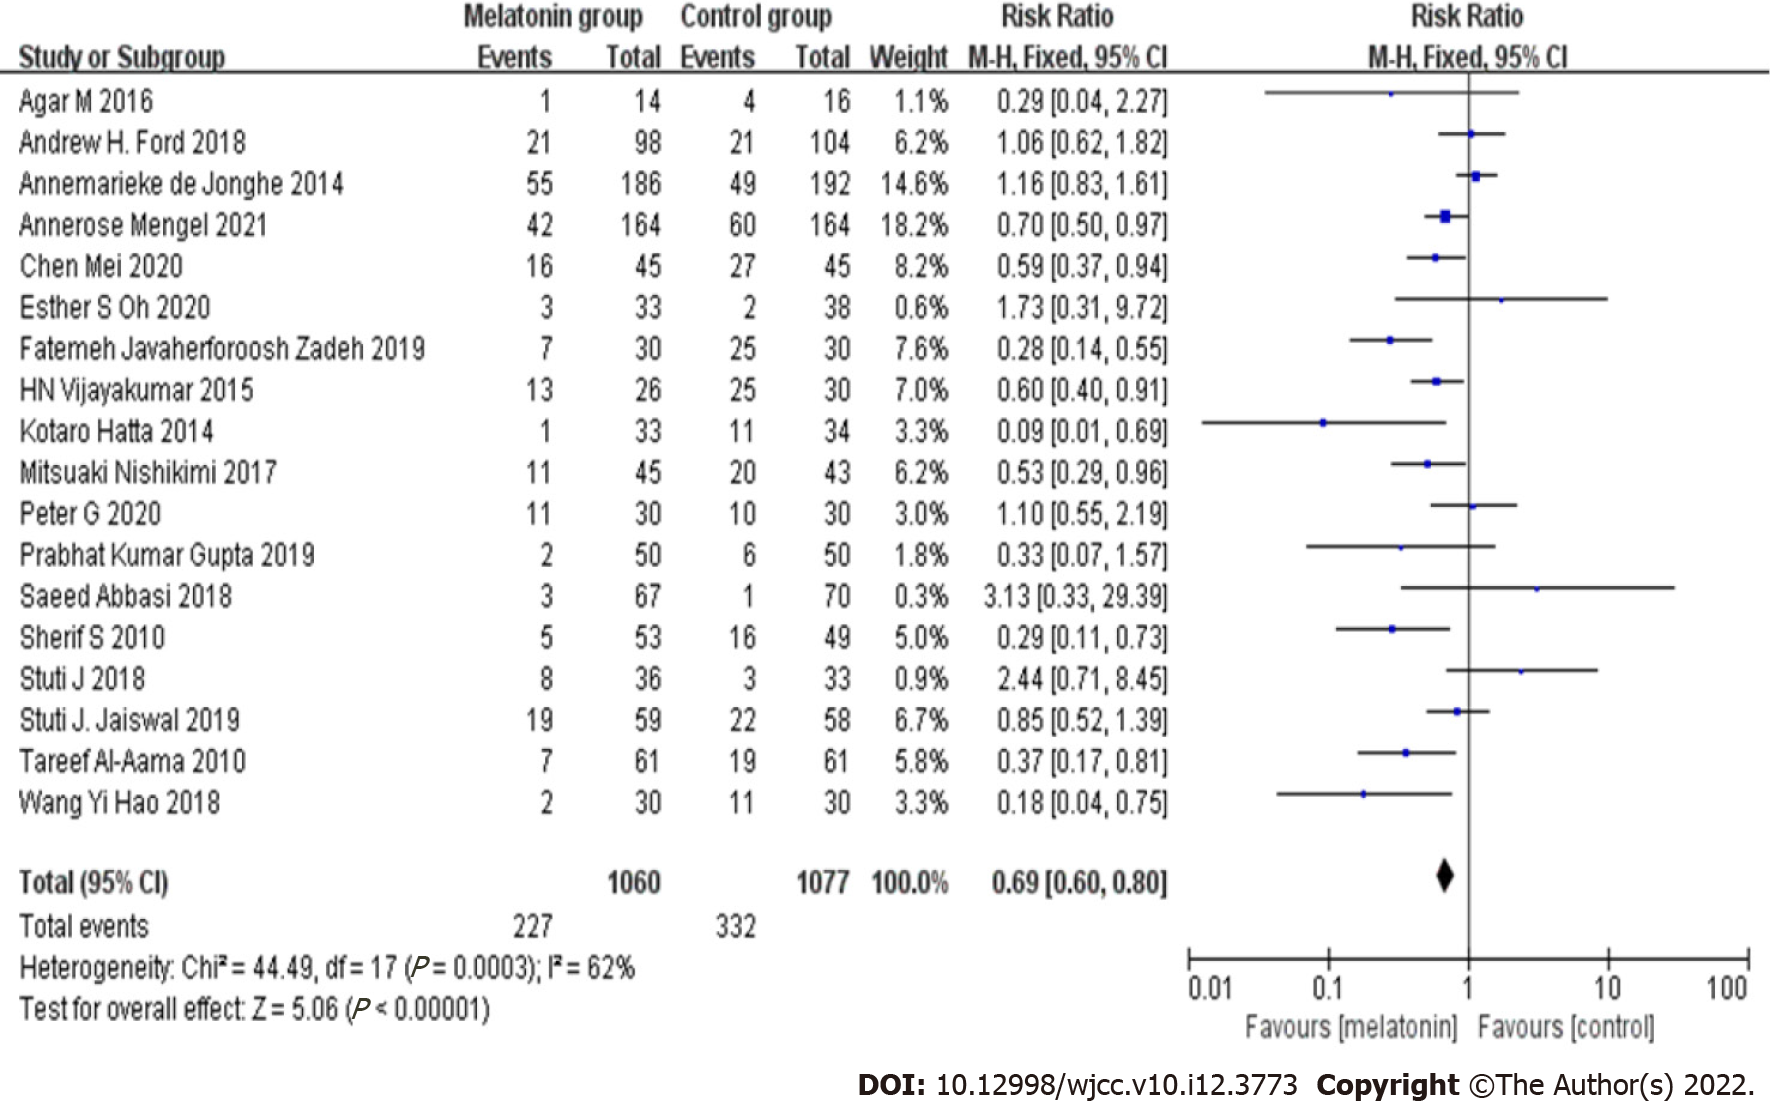
Figure 4 Meta-analysis forest diagram of melatonin in the prevention of delirium in hospitalized patients in this study.
CI: Confidence interval.
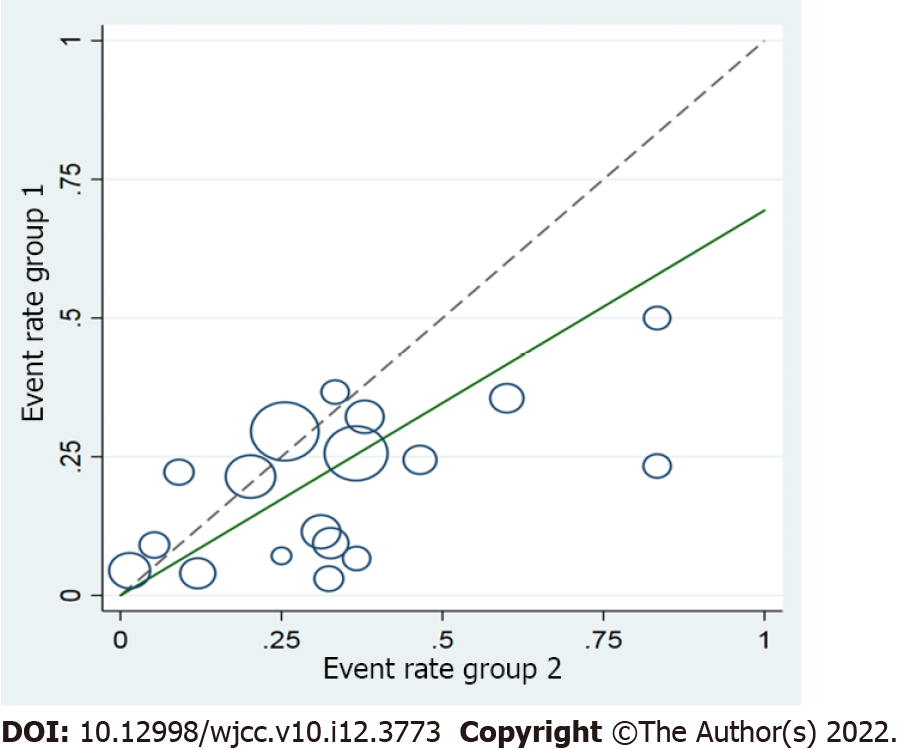
Figure 5 Diagram of melatonin in the prevention of delirium in hospitalized patients in this study.
It can see that the small circles and the middle circles are distributed on both sides of the oblique line in the figure, indicating that the heterogeneity is small, the large circles are not aligned, and the heterogeneity is strong.
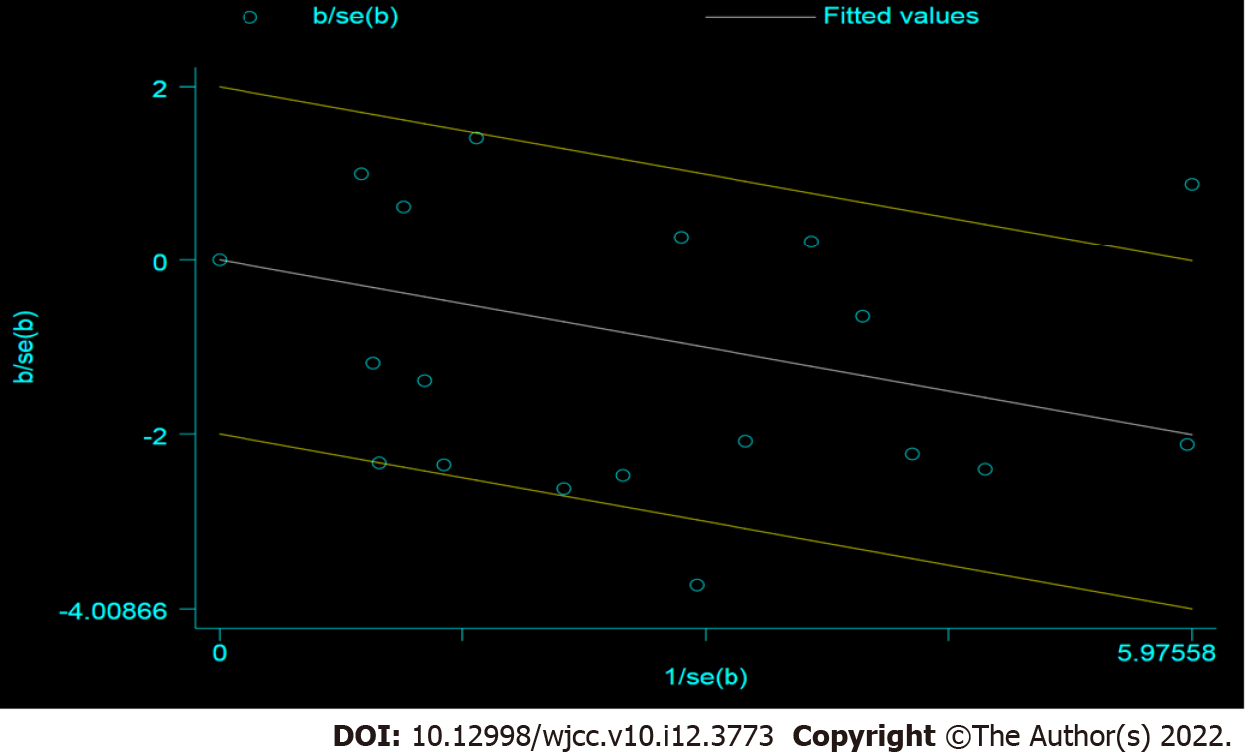
Figure 6 Galbraith diagram of melatonin in the prevention of delirium in hospitalized patients in this study (star chart).
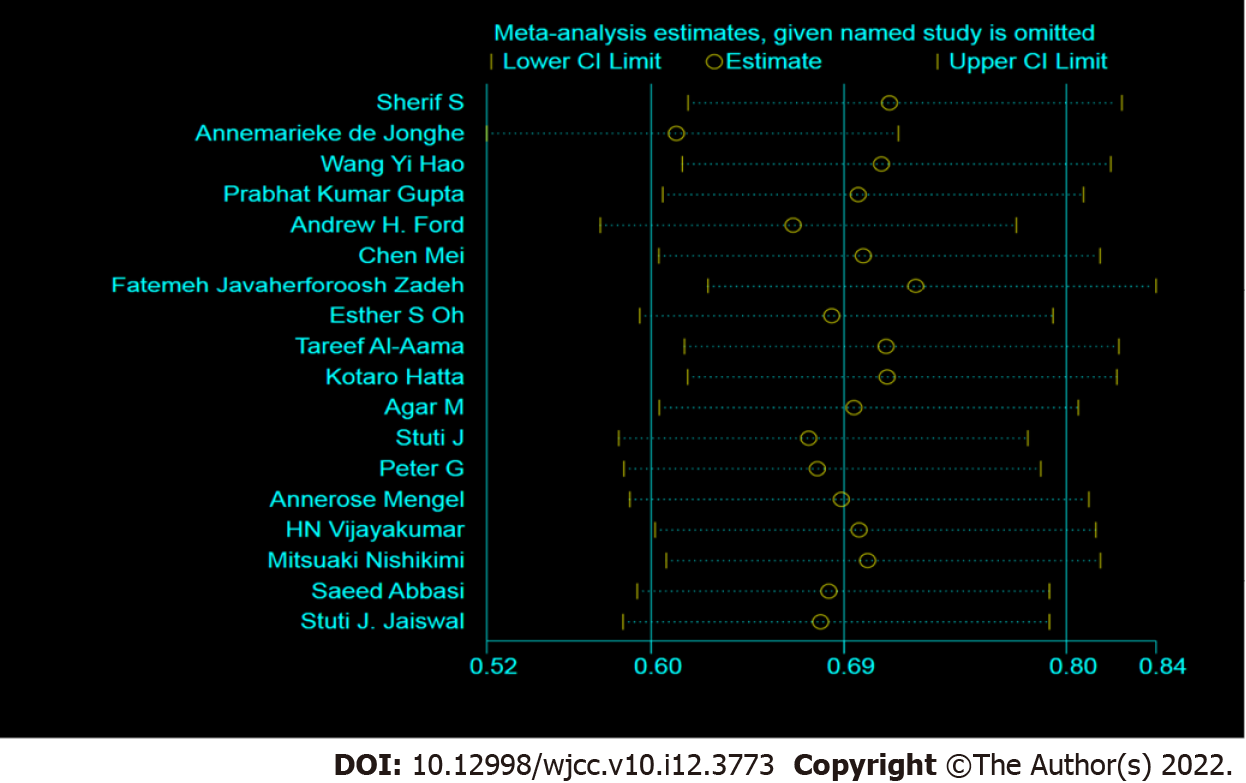
Figure 7 Sensitivity analysis of melatonin in the prevention of delirium in hospitalized patients.
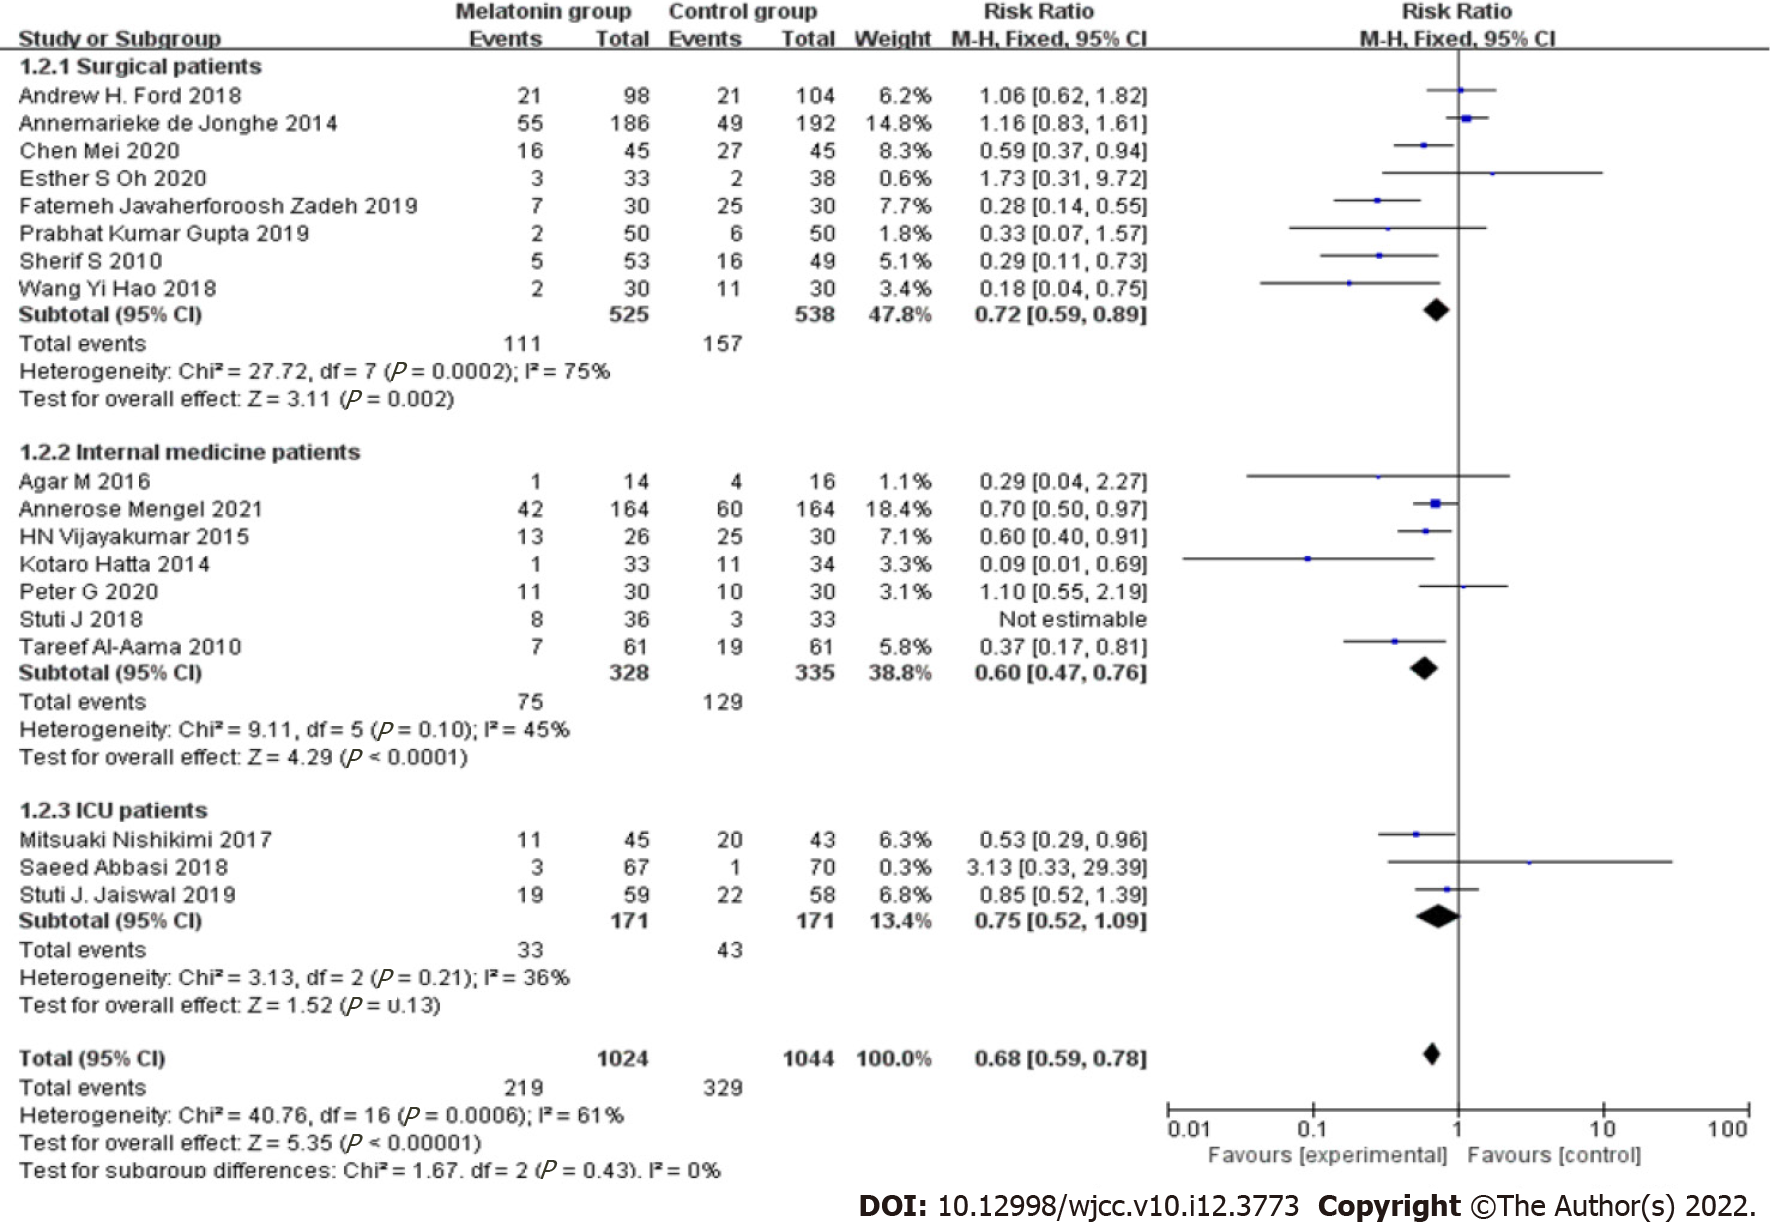
Figure 8 Forest diagram of subgroup analysis according to the type of inpatients (surgery, internal medicine, and intensive care unit).
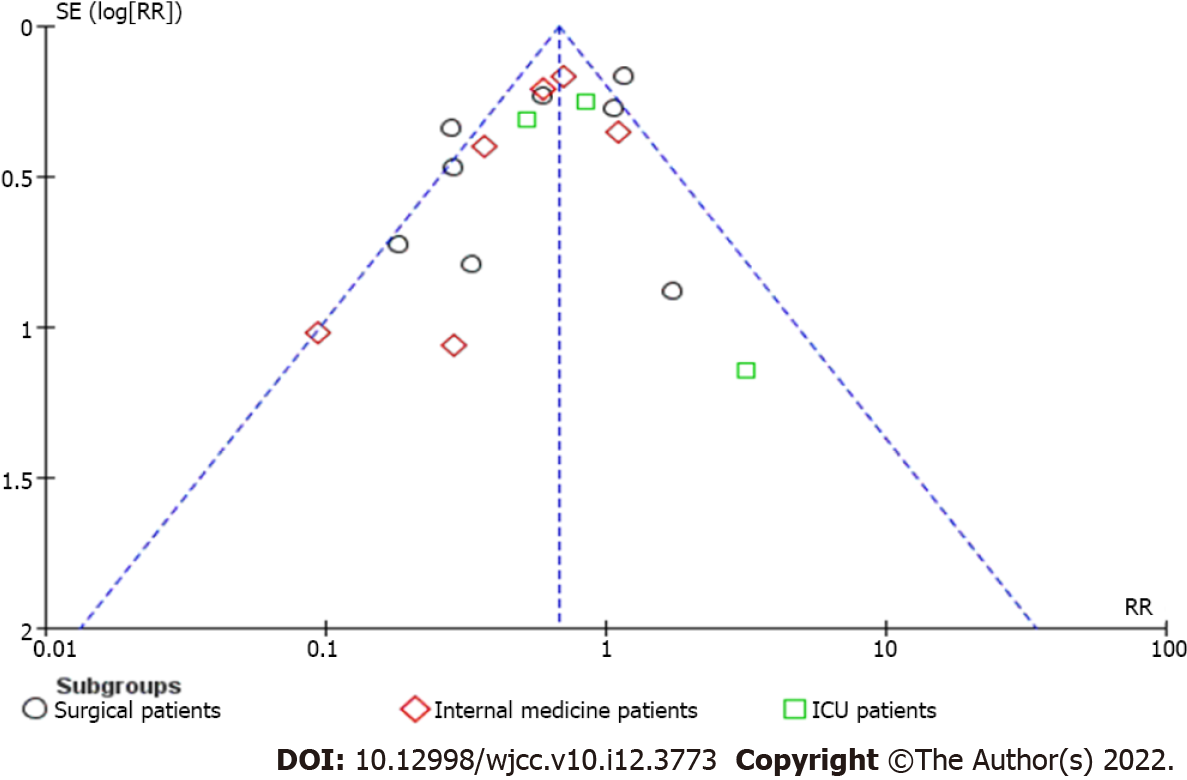
Figure 9 Funnel chart of subgroup analysis according to the type of hospitalized patients (surgery, internal medicine, and intensive care unit).
- Citation: You W, Fan XY, Lei C, Nie CC, Chen Y, Wang XL. Melatonin intervention to prevent delirium in hospitalized patients: A meta-analysis. World J Clin Cases 2022; 10(12): 3773-3786
- URL: https://www.wjgnet.com/2307-8960/full/v10/i12/3773.htm
- DOI: https://dx.doi.org/10.12998/wjcc.v10.i12.3773


