Copyright
©The Author(s) 2022.
World J Clin Cases. Apr 26, 2022; 10(12): 3739-3753
Published online Apr 26, 2022. doi: 10.12998/wjcc.v10.i12.3739
Published online Apr 26, 2022. doi: 10.12998/wjcc.v10.i12.3739
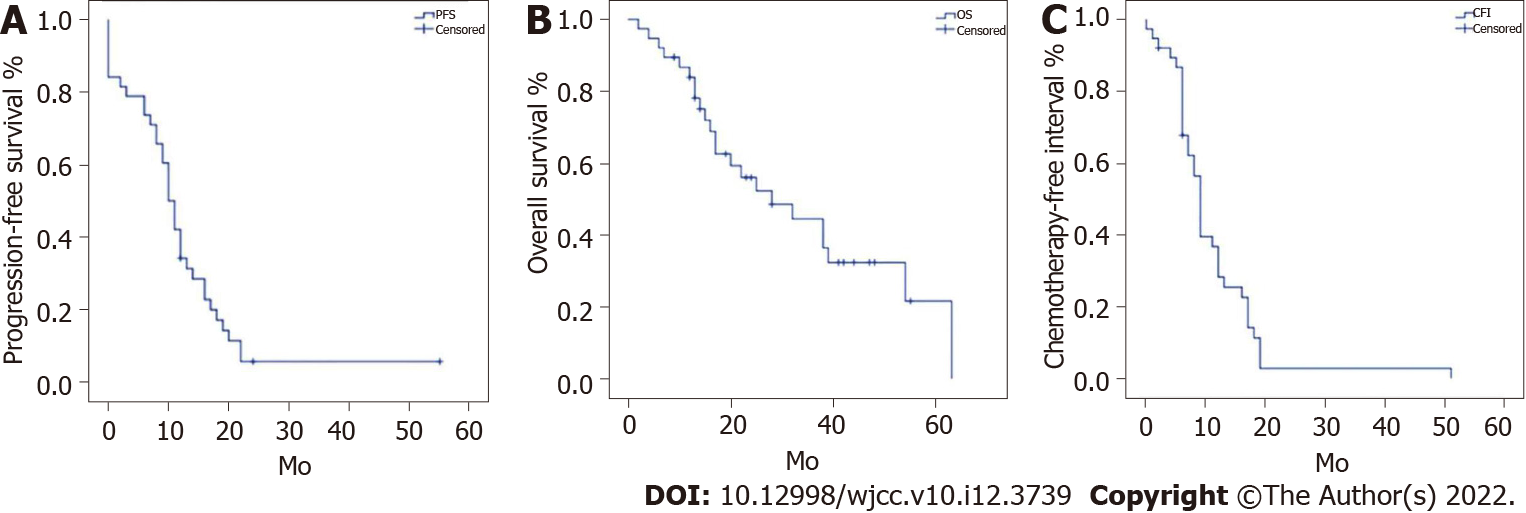
Figure 1 Survival curves.
A: Progression-free survival (PFS); B: Overall survival (OS); C: Chemotherapy-free interval (CFI) after secondary surgery for platinum-resistant recurrent epithelial ovarian carcinoma. Median PFS was 10 (95%CI: 8.27-11.73) months. Median OS was 28 (95%CI: 12.75-43.25) months. Median CFI was 9 (95%CI: 8.06-9.94) months.
Figure 2 Kaplan-Meier survival curves for subgroup analysis of progression-free survival.
The absence of residual lesions after cytoreductive surgery (P = 0.001) and postoperative chemotherapy (P = 0.018) were associated with improved progression-free survival. A: Age (P = 0.824); B: Eastern collaborative oncology group score (P = 0.381); C: Pathological type (P = 0.114); D: Tumor differentiation (P = 0.708); E: Absence of residual lesions after cytoreductive surgery (P = 0.001); F: Postoperative chemotherapy (P = 0.018); G: Number of chemotherapy lines (P = 0.542); H: The number of previous surgeries (P = 0.543); I: Targeted drugs (P = 0.196). ECOG: Eastern collaborative oncology group.
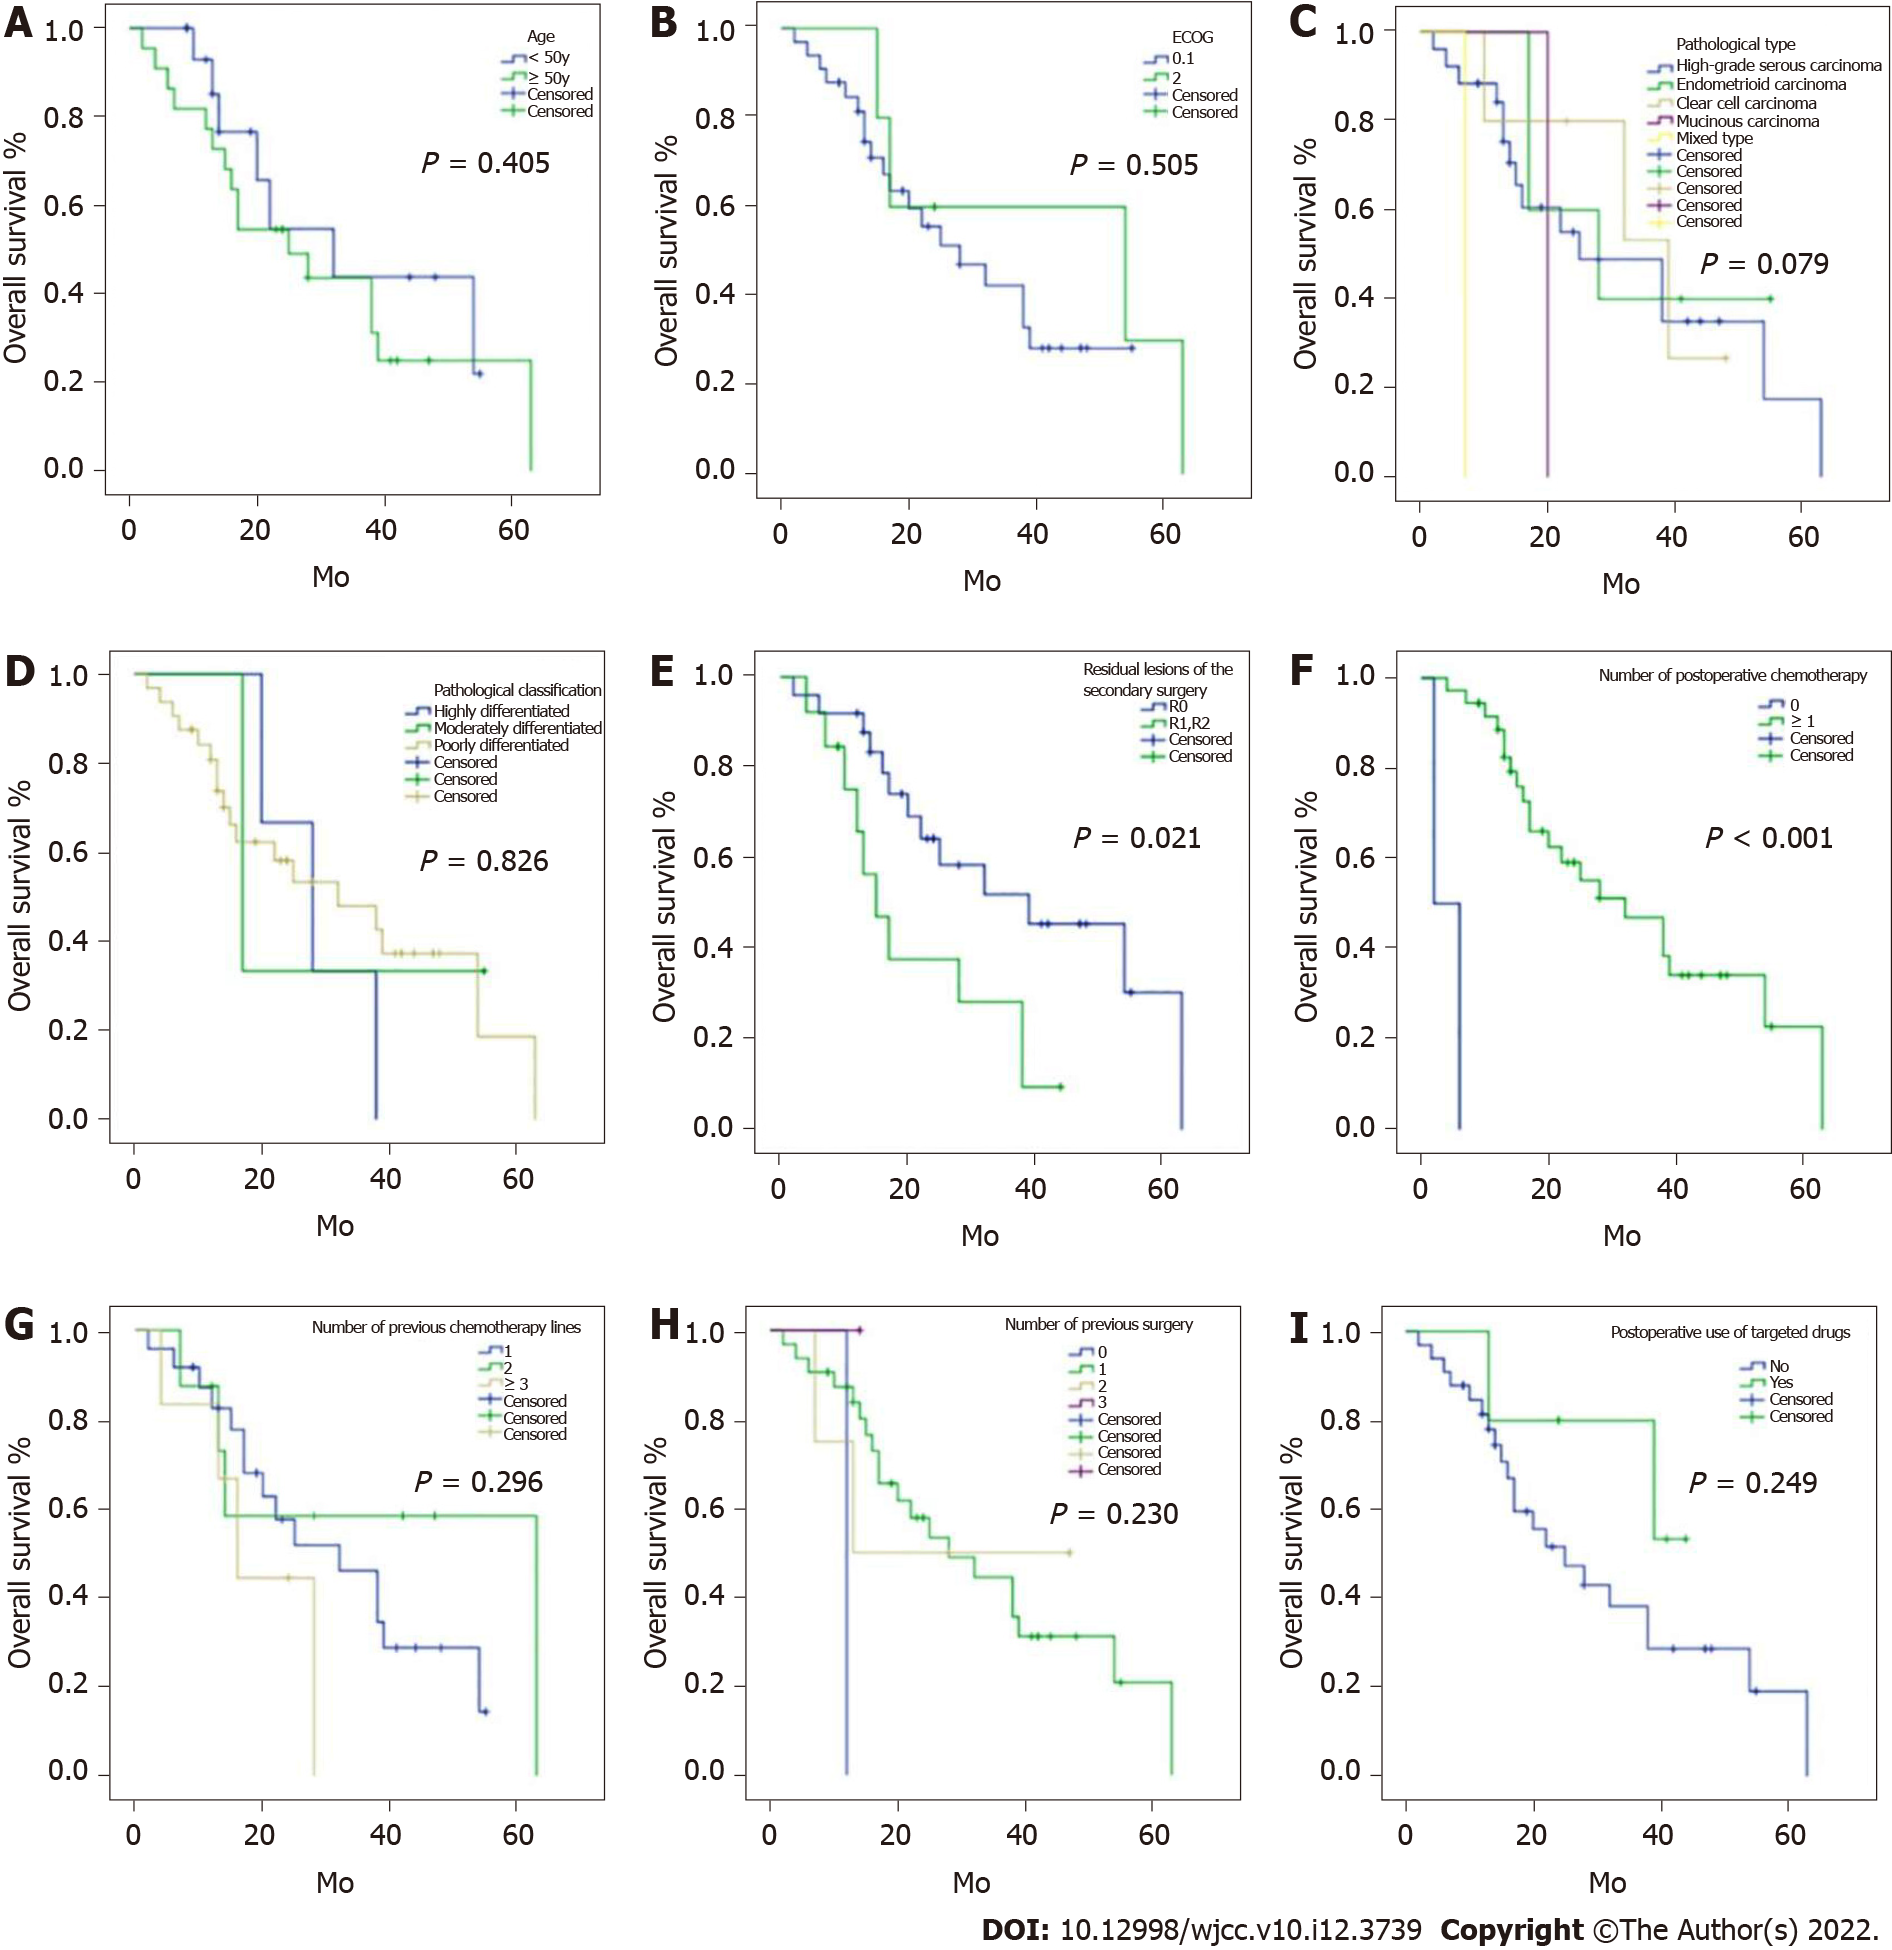
Figure 3 Kaplan-Meier survival curves for subgroup analysis of overall survival.
The absence of residual lesions after cytoreductive surgery (P = 0.021) and postoperative chemotherapy (P < 0.001) were associated with improved overall survival. A: Age (P = 0.405); B: Eastern collaborative oncology group score (P = 0.505); C: Pathological type (P = 0.079); D: Tumor differentiation (P = 0.826); E: Absence of residual lesions after cytoreductive surgery (P = 0.021); F: Postoperative chemotherapy (P < 0.001); G: the number of chemotherapy lines (P = 0.296); H: The number of previous surgeries (P = 0.230); I: Targeted drugs (P = 0.249). ECOG: Eastern collaborative oncology group.
Figure 4 Kaplan-Meier survival curves for subgroup analysis of chemotherapy-free interval.
The absence of residual lesions after cytoreductive surgery (P = 0.013) was associated with improved chemotherapy-free interval. A: Age (P = 0.852); B: Eastern collaborative oncology group score (P = 0.200); C: Pathological type (P = 0.071); D: Tumor differentiation (P = 0.200); E: Residual lesions after cytoreductive surgery (P = 0.013); F: Number of chemotherapy lines (P = 0.909); G: The number of previous surgeries (P = 0.142); H: Targeted drugs (P = 0.508). ECOG: Eastern collaborative oncology group.
- Citation: Zhao LQ, Gao W, Zhang P, Zhang YL, Fang CY, Shou HF. Surgery in platinum-resistant recurrent epithelial ovarian carcinoma. World J Clin Cases 2022; 10(12): 3739-3753
- URL: https://www.wjgnet.com/2307-8960/full/v10/i12/3739.htm
- DOI: https://dx.doi.org/10.12998/wjcc.v10.i12.3739


