Copyright
©The Author(s) 2022.
World J Clin Cases. Apr 6, 2022; 10(10): 3222-3231
Published online Apr 6, 2022. doi: 10.12998/wjcc.v10.i10.3222
Published online Apr 6, 2022. doi: 10.12998/wjcc.v10.i10.3222
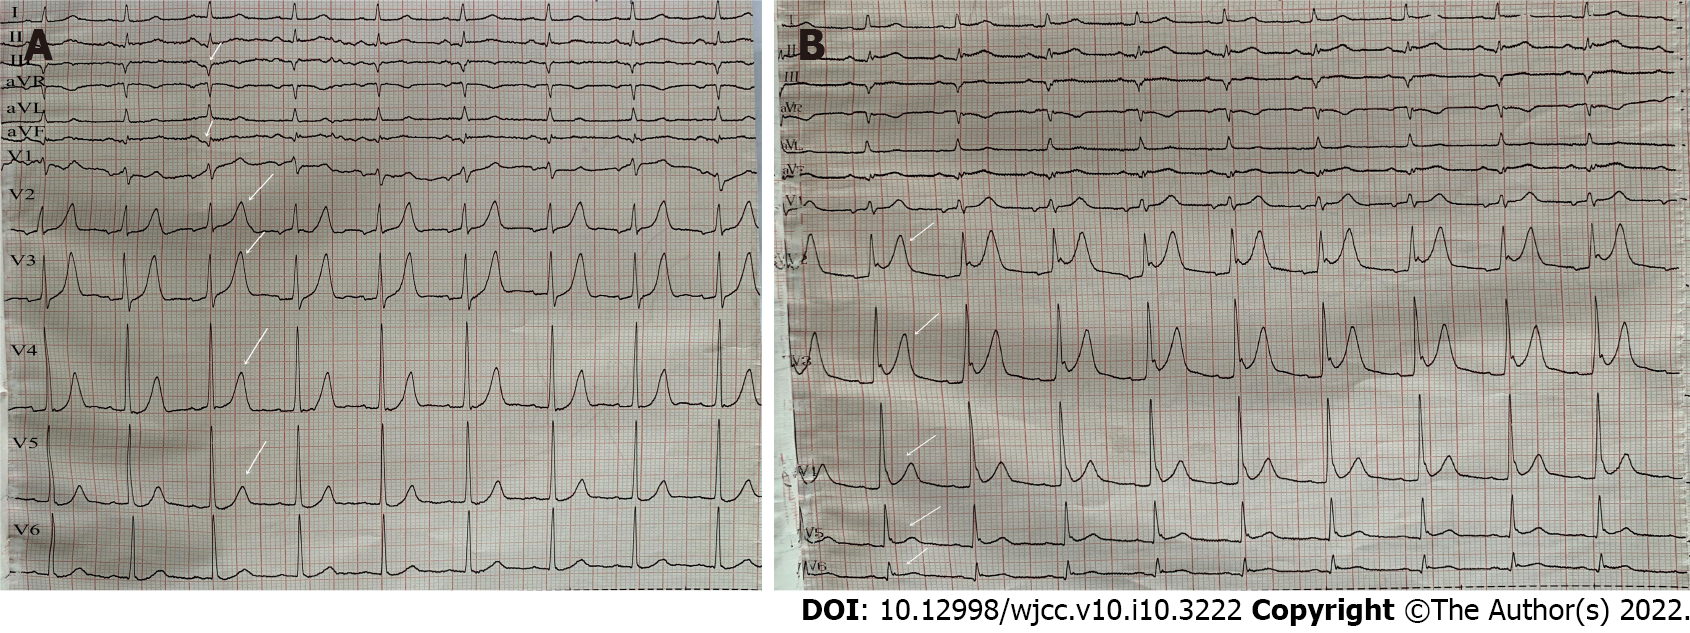
Figure 1 Electrocardiography of the patient.
A: Electrocardiography (ECG) at admission showed sinus rhythm, pathological Q waves on III, aVF leads and high and sharp T waves on V2-V5 leads (white arrow); B: Postoperative ECG showed sinus rhythm and ST-segment elevation on leads V2-V6 of the anterior wall (white arrow).
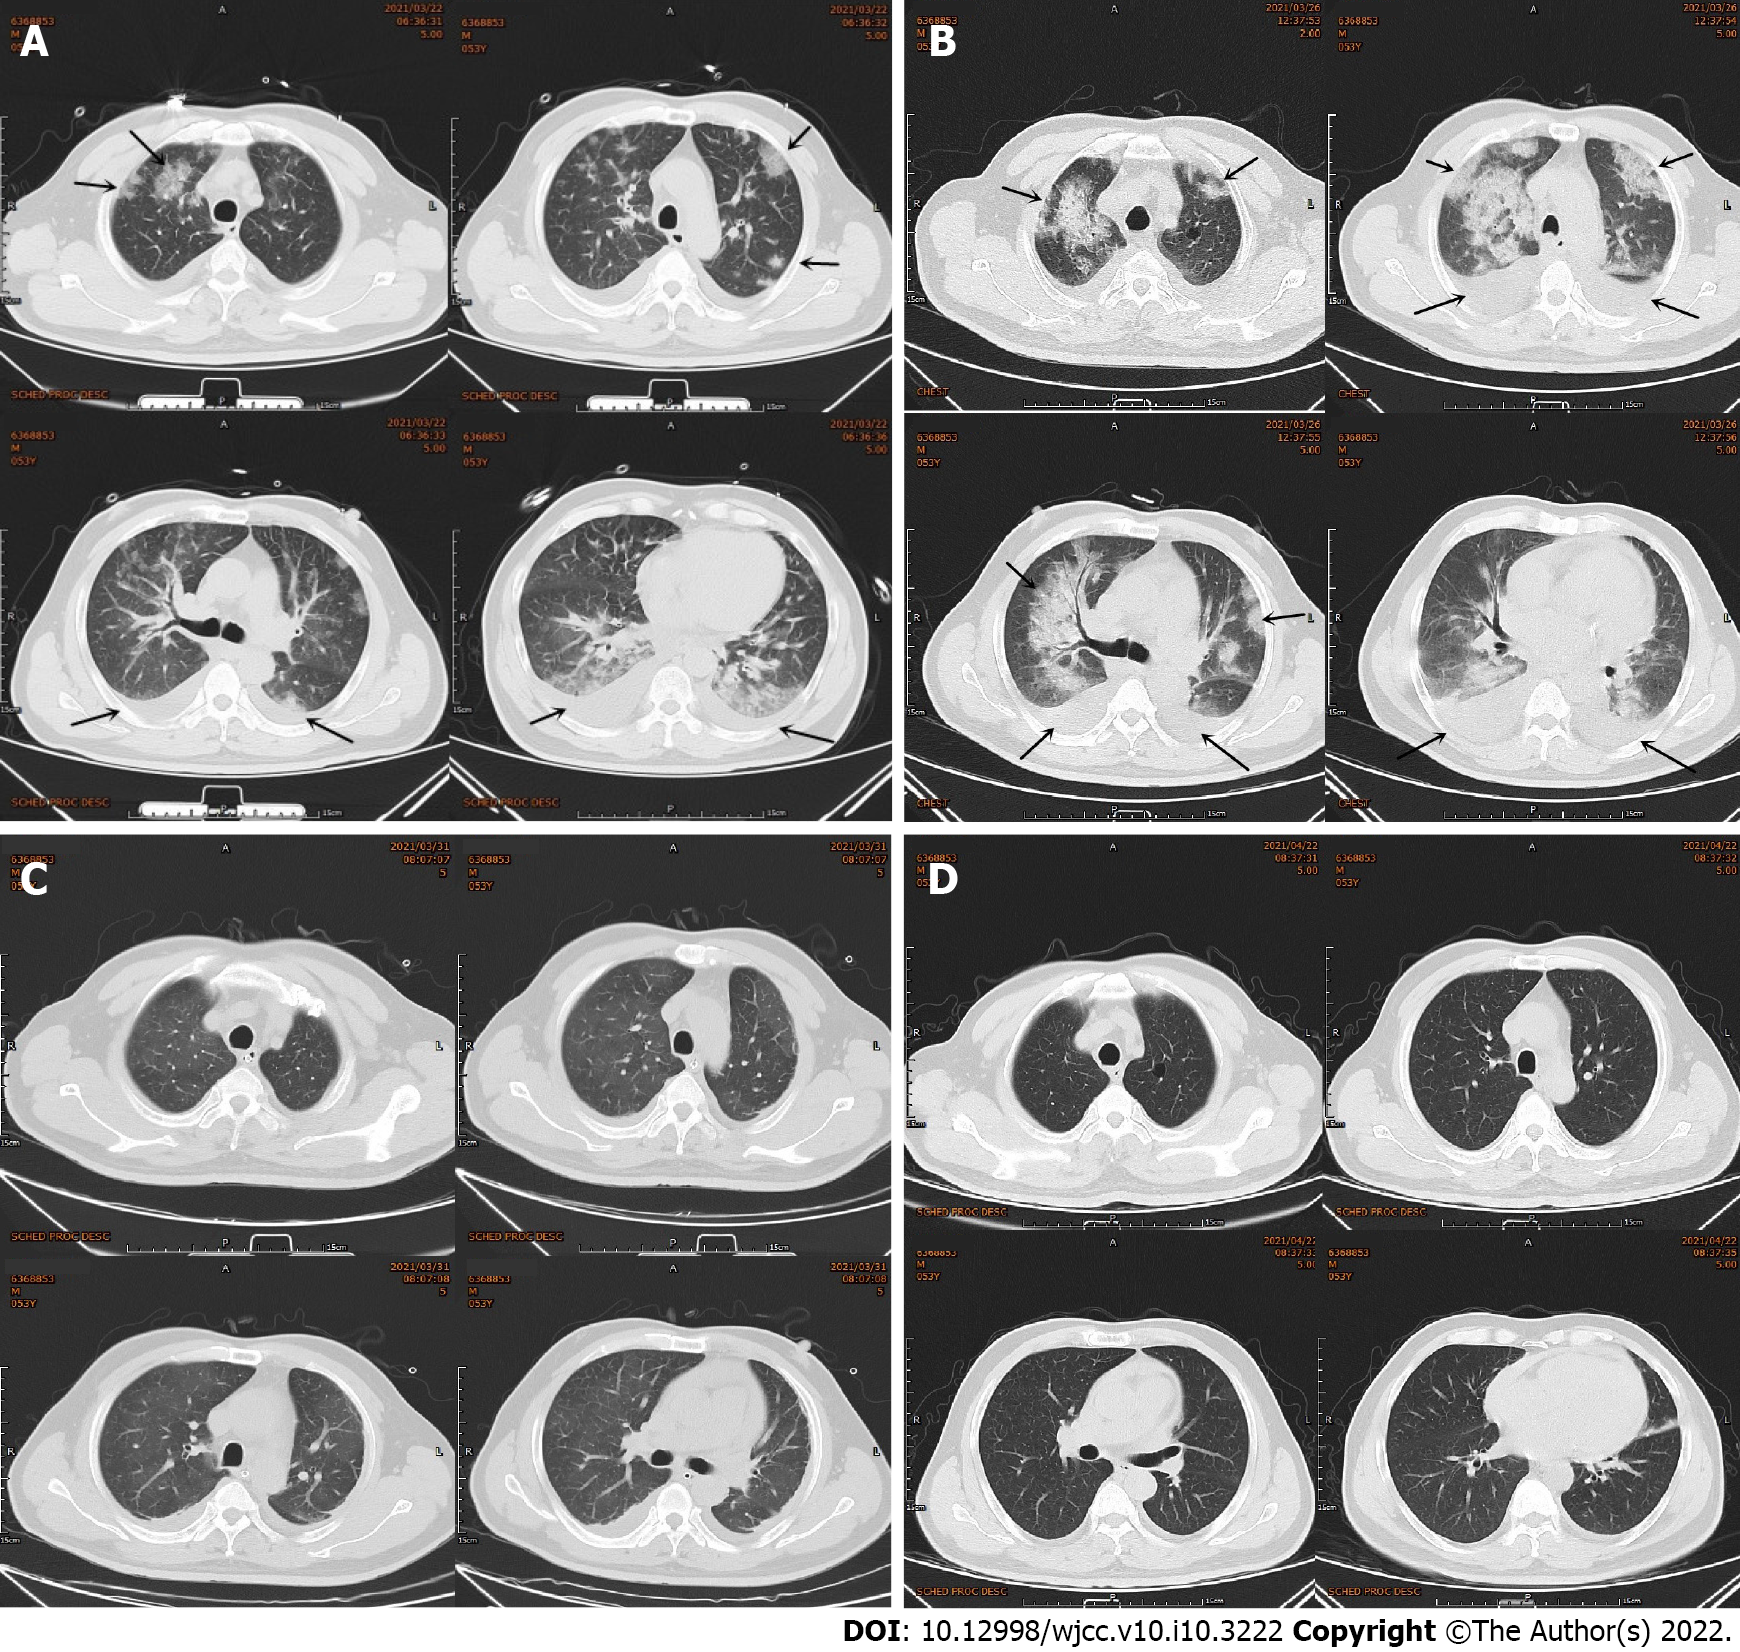
Figure 2 Chest computed tomography of the patient.
A: Chest computed tomography (CT) showed multiple patchy high-density shadows in both lungs, and bilateral pleural effusion and enlarged hilar shadows (black arrow); B: Repeated chest CT showed multiple patchy high-density shadows in both lungs and bilateral pleural effusion, which was significantly worse than before (black arrow); C: Repeated chest CT showed the multiple patchy high-density shadows and the pleural effusion were obviously absorbed; D: Repeated Chest CT showed that the patchy high-density shadows and the pleural effusion were almost absorbed.
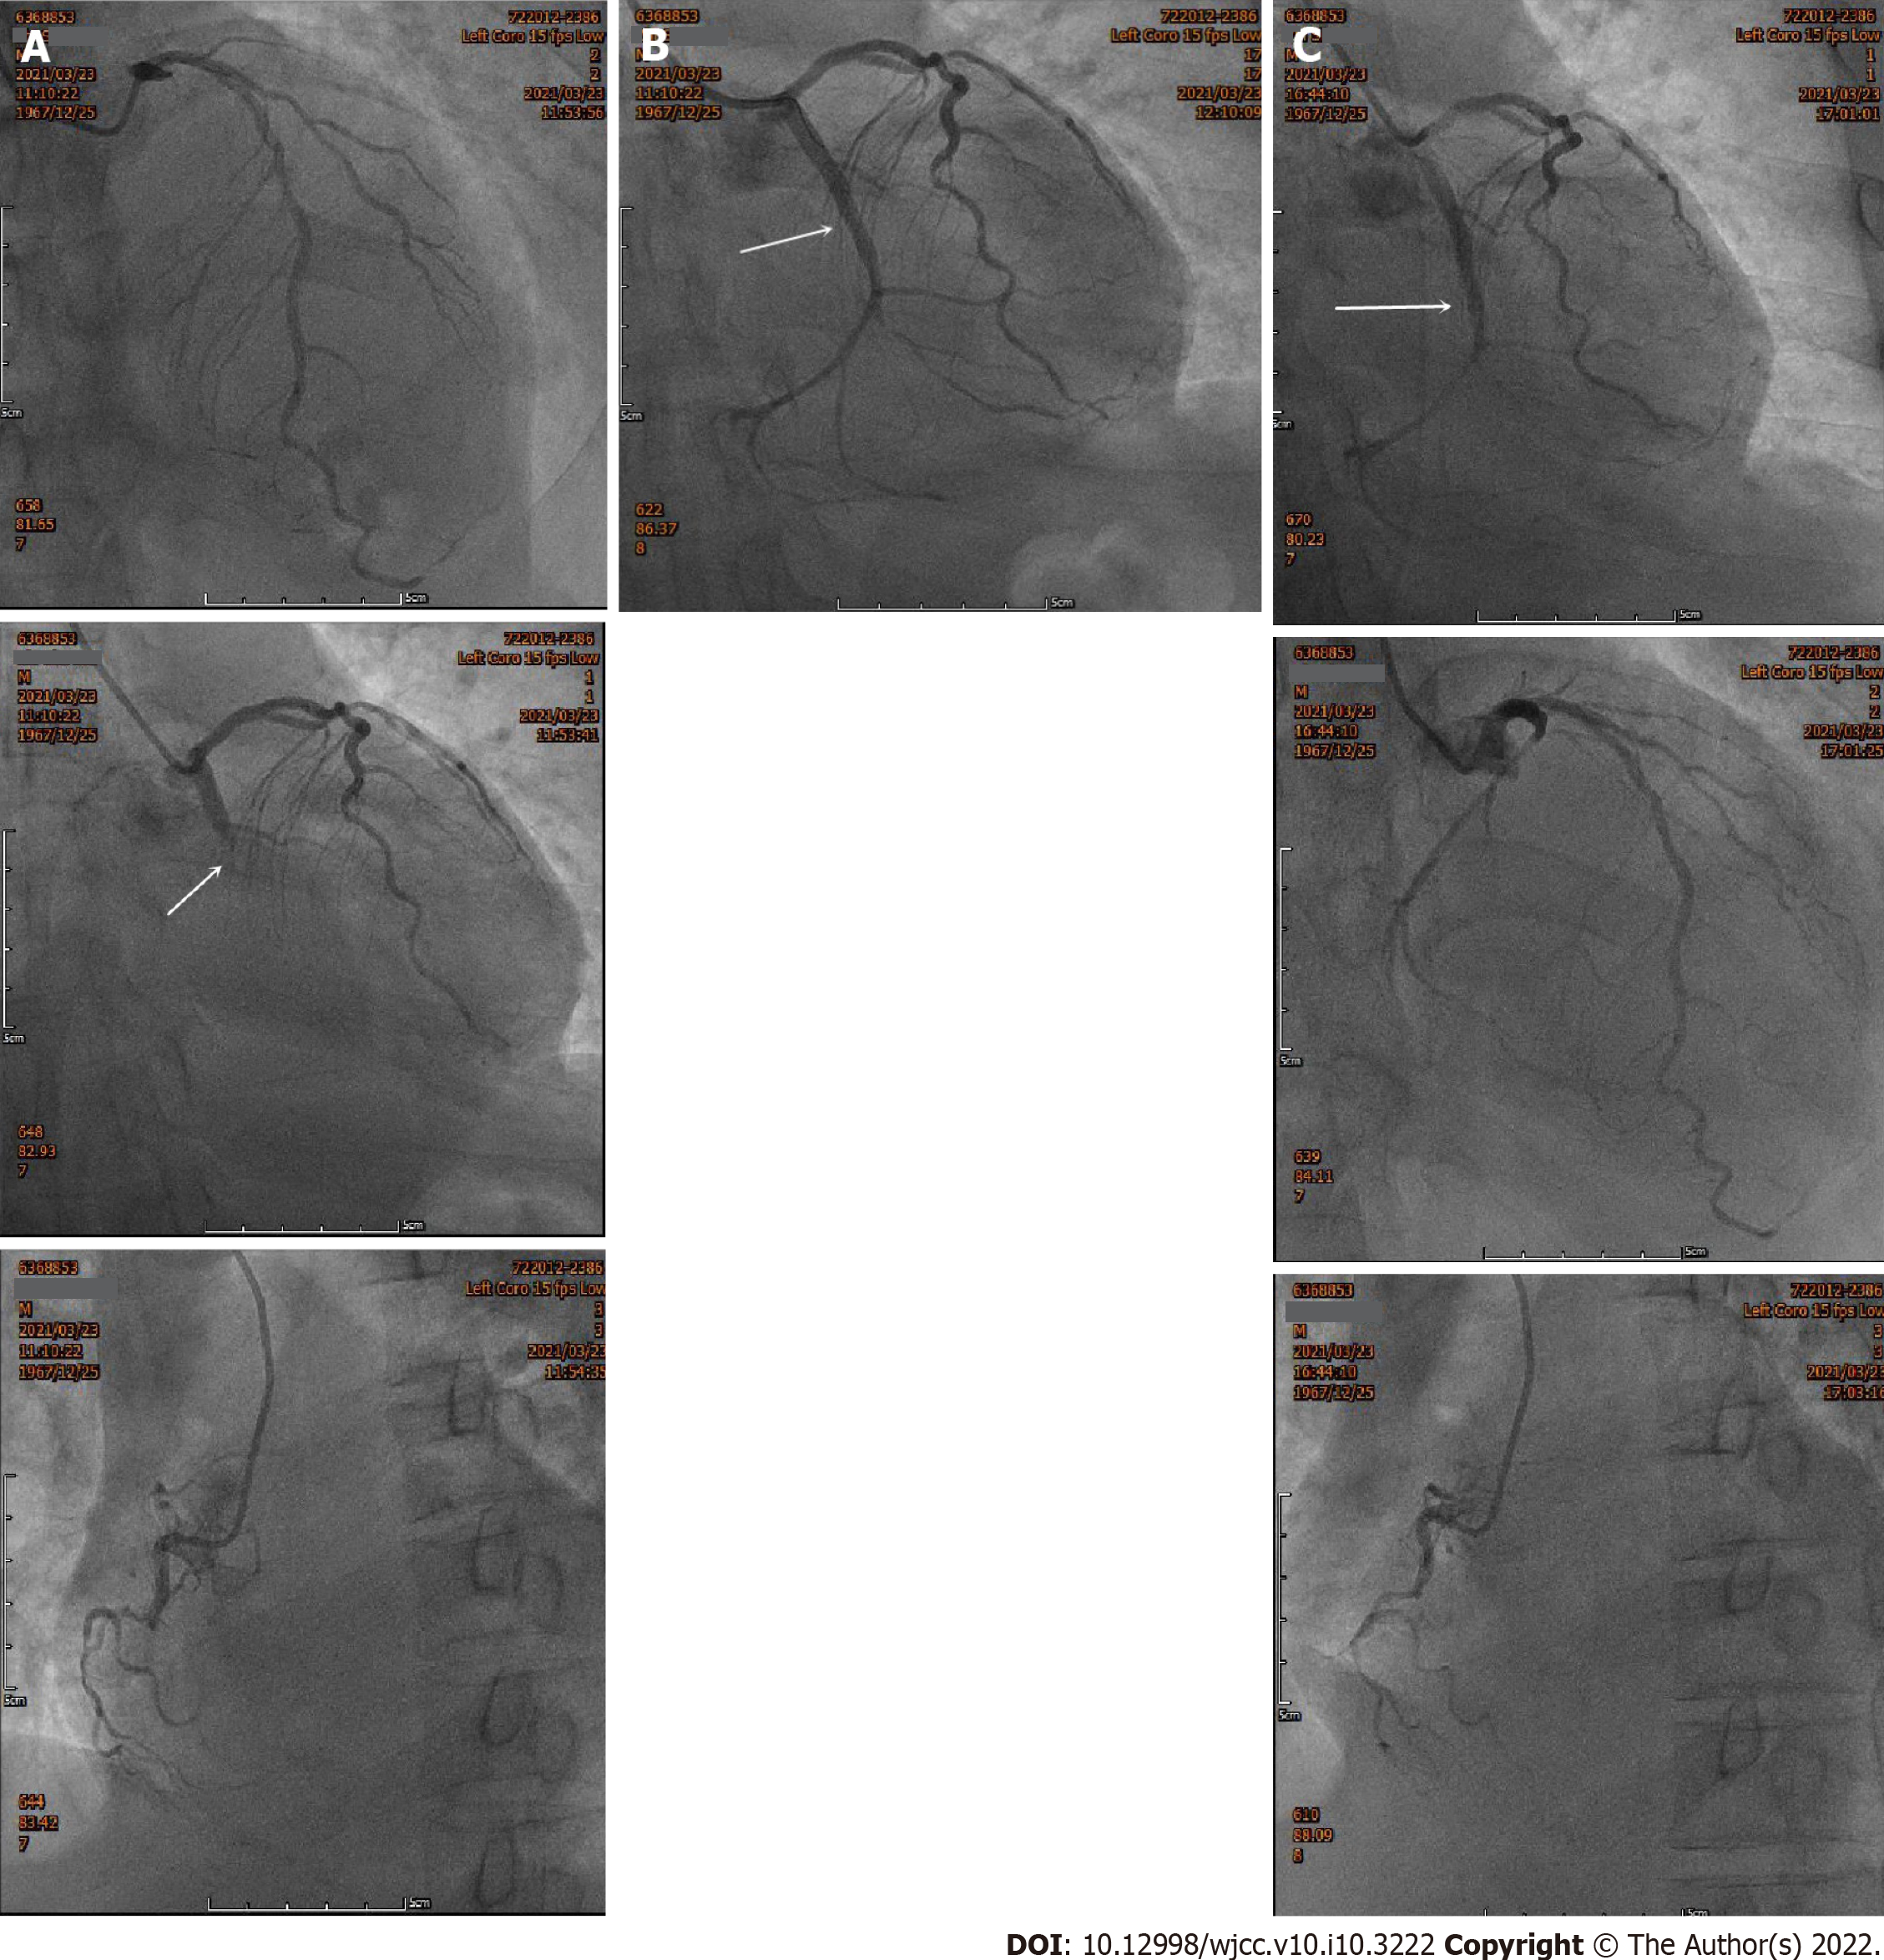
Figure 3 Emergency coronary angiography images of the patient.
A: Emergency coronary angiography (CAG) showed that the coronary arteries were left dominant with localized mild stenosis at the proximal left anterior descending branch (LAD), complete occlusion at the proximal circumflex branch (LCX) (white arrow) and diffuse stenosis at the distal RCA, the heaviest of which was about 90%; B: CAG after reperfusion therapy showed that there was no residual stenosis or dissection of the LCX and the TIMI blood flow was grade 3 (white arrow); C: Secondary CAG showed that the original stent of the proximal LCX was unobstructed (white arrow) and there were no significant dynamic changes or thrombus in the LAD and the RCA.
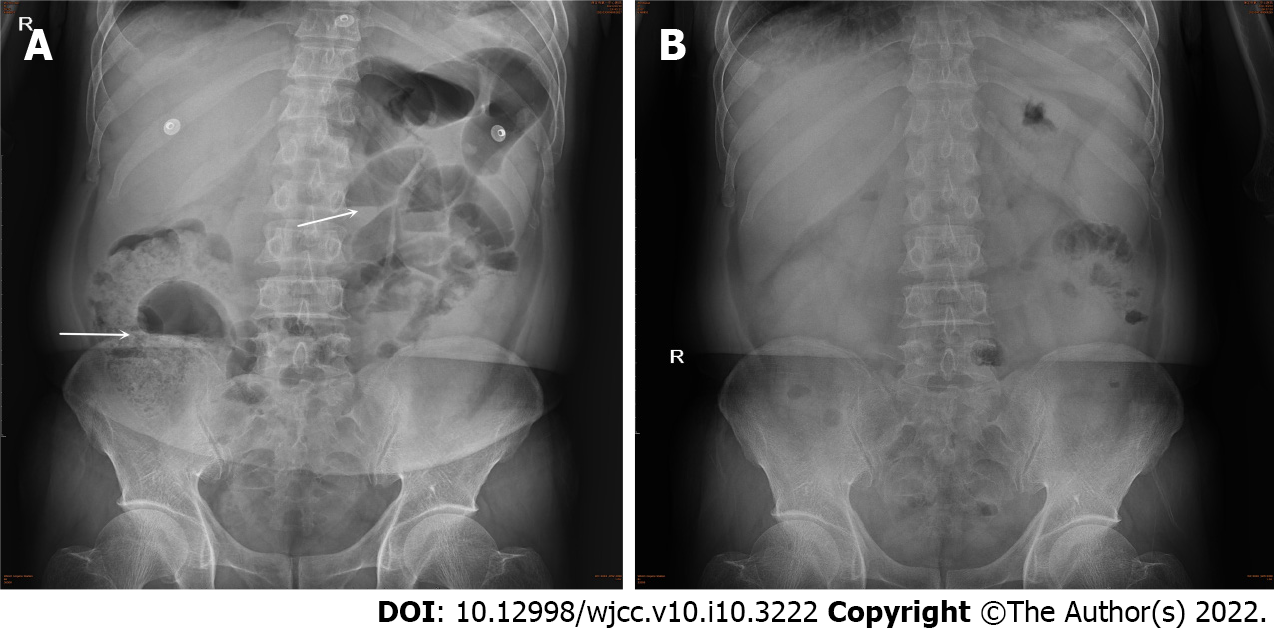
Figure 4 Abdominal X-ray images of the patient.
A: Beside abdominal X-ray showed intestinal dilatation and gas-fluid levels, which supported the diagnosis of intestinal obstruction (white arrow); B: Repeated abdominal X-ray showed that the intestinal obstruction disappeared.
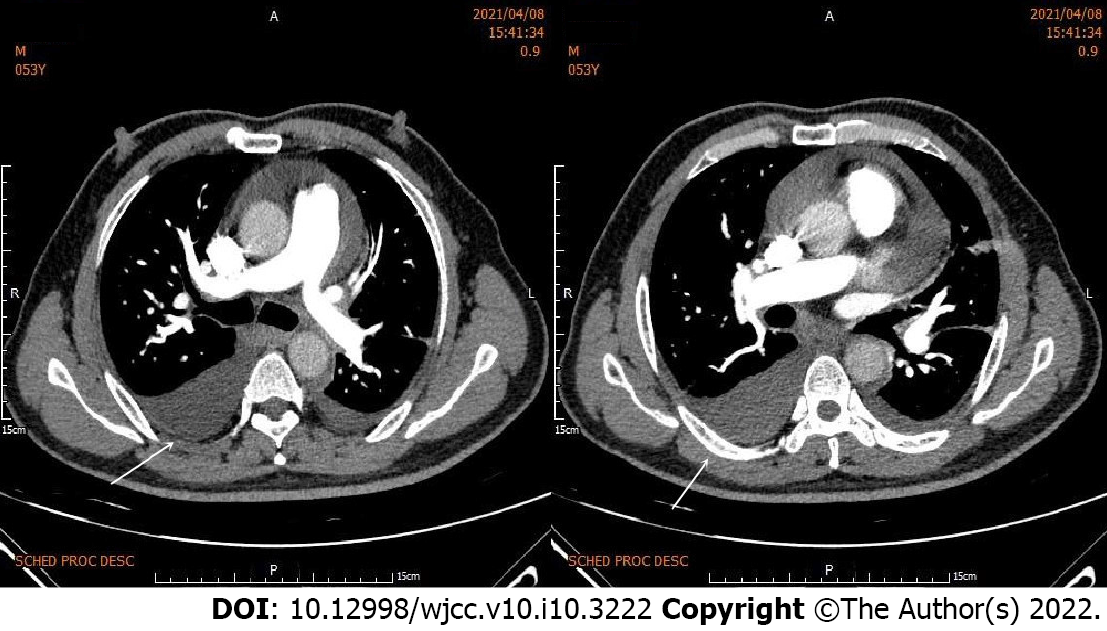
Figure 5 Pulmonary embolism was not seen on enhanced pulmonary computed tomography, but the pleural effusion increased (white arrow).
- Citation: Liu WC, Li SB, Zhang CF, Cui XH. Severe pneumonia and acute myocardial infarction complicated with pericarditis after percutaneous coronary intervention: A case report . World J Clin Cases 2022; 10(10): 3222-3231
- URL: https://www.wjgnet.com/2307-8960/full/v10/i10/3222.htm
- DOI: https://dx.doi.org/10.12998/wjcc.v10.i10.3222


