Copyright
©The Author(s) 2022.
World J Clin Cases. Jan 7, 2022; 10(1): 91-103
Published online Jan 7, 2022. doi: 10.12998/wjcc.v10.i1.91
Published online Jan 7, 2022. doi: 10.12998/wjcc.v10.i1.91
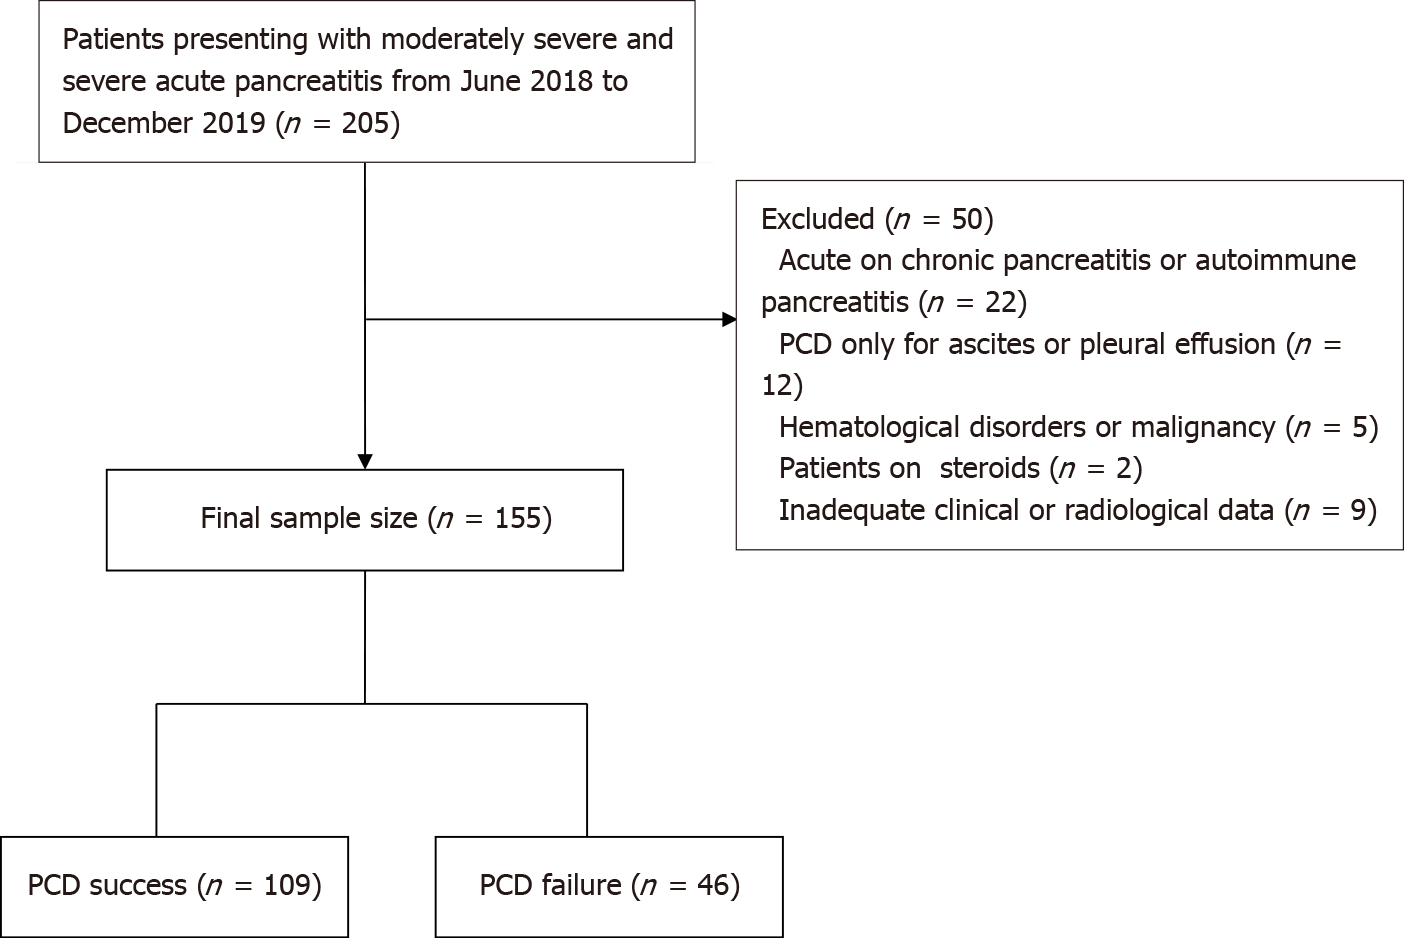
Figure 1 Flow chart shows patient recruitment.
PCD: Percutaneous catheter drainage.
Figure 2 Box plots showing serial white blood cell count and neutrophil-lymphocyte ratio.
A: White blood cell count; B: Neutrophil-lymphocyte ratio. WBC: White blood cell count; NLR: Neutrophil-lymphocyte ratio.
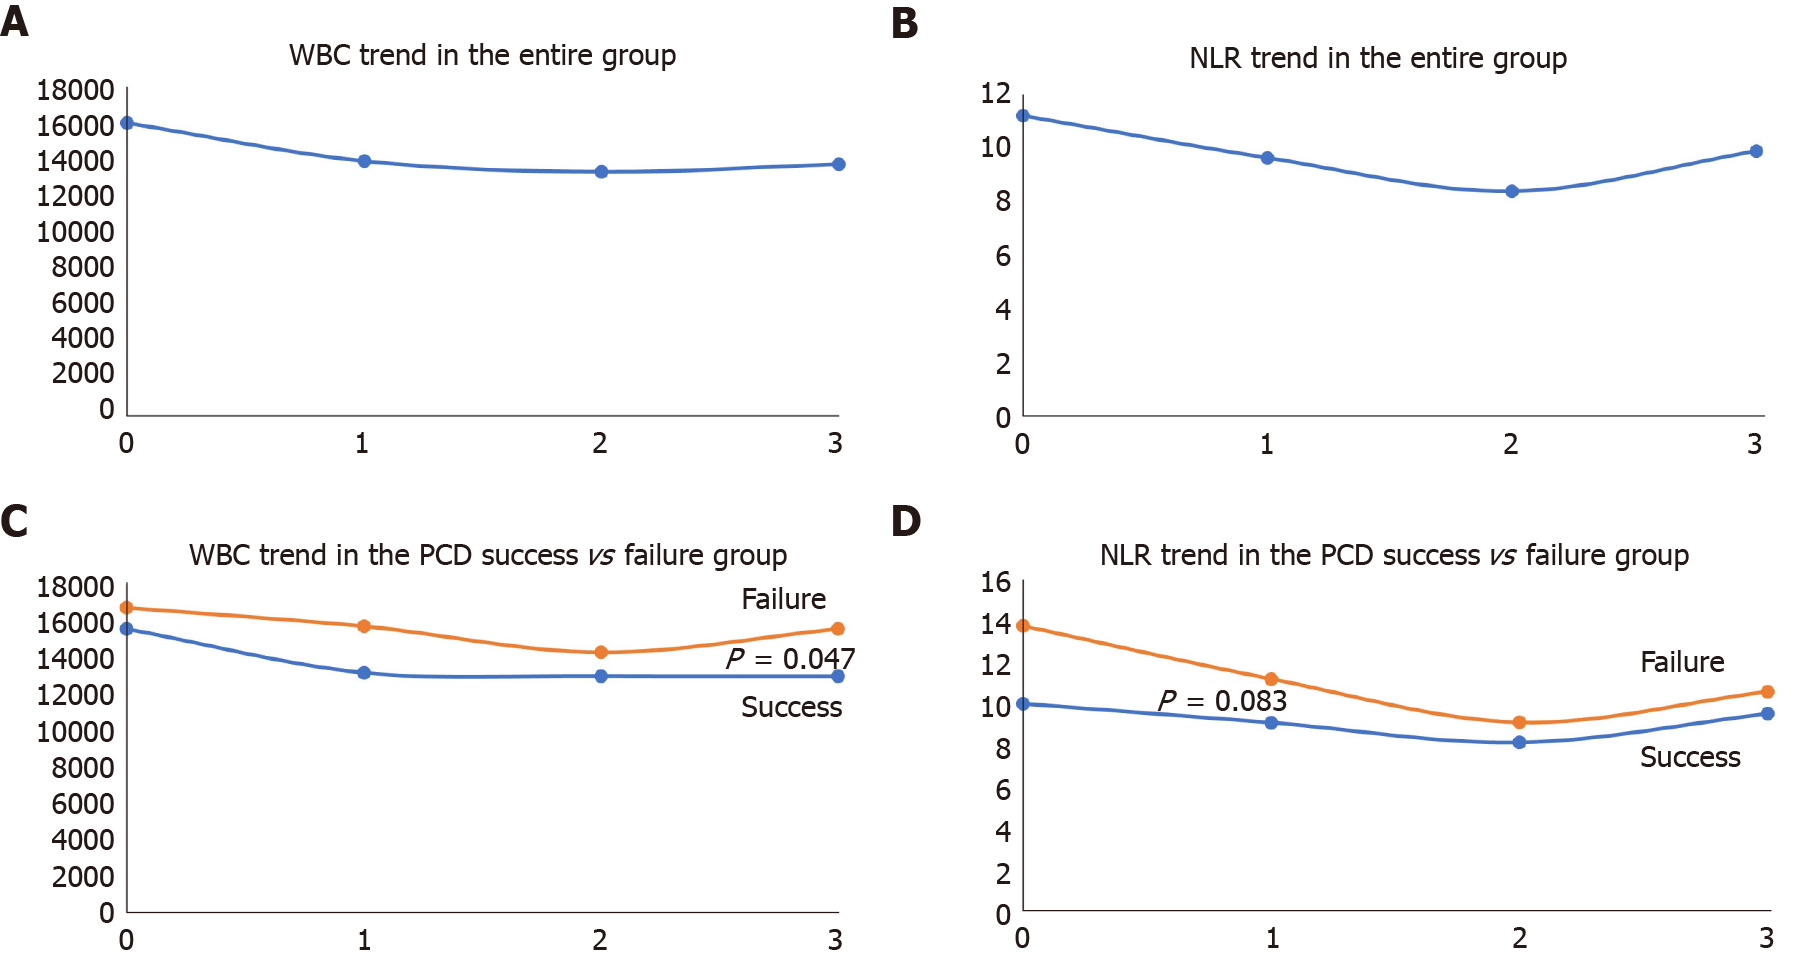
Figure 3 Trend of white blood cell count and neutrophil-lymphocyte ratio.
A and B: Trend of white blood cell count (WBC) and neutrophil-lymphocyte ratio (NLR) in the overall group; C and D: Comparison of trends of WBC and NLR in two groups. WBC: White blood cell count; NLR: Neutrophil-lymphocyte ratio; PCD: Percutaneous catheter drainage.
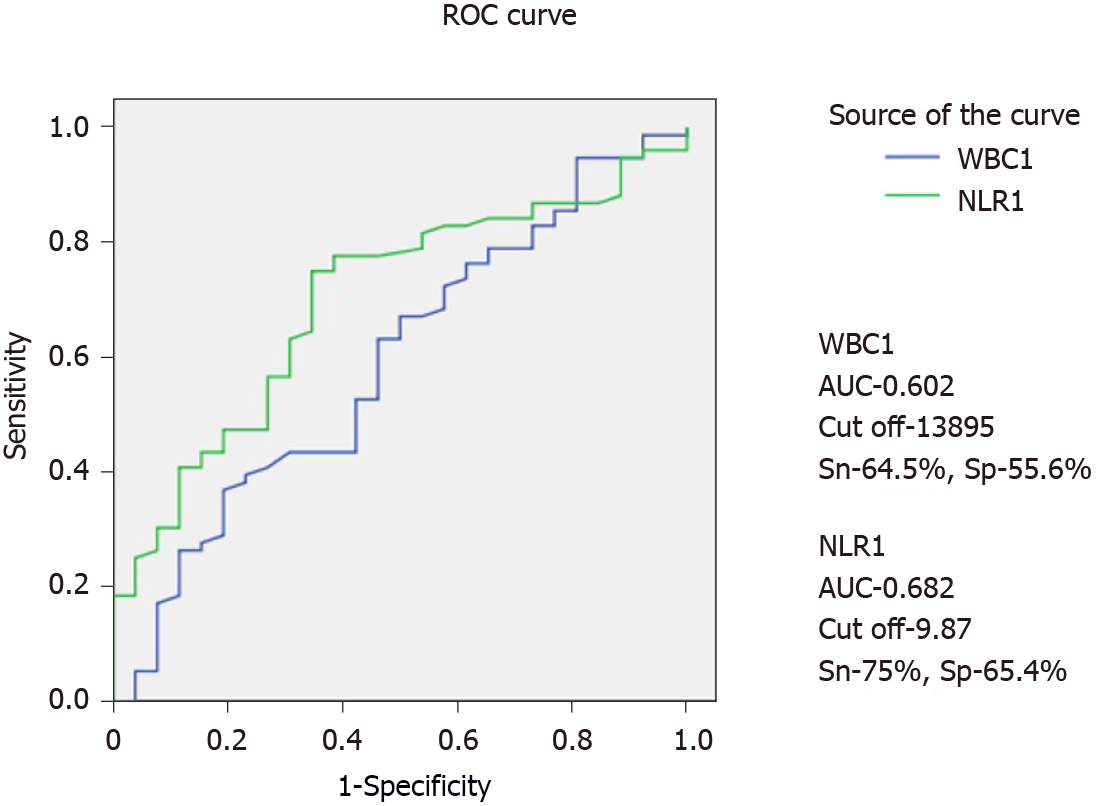
Figure 4 Receiver operating characteristics curves for white blood cell and neutrophil-lymphocyte ratio at day 1 after percutaneous catheter drainage.
WBC: White blood cell count; NLR: Neutrophil-lymphocyte ratio; AUC: Area under the curve.
- Citation: Gupta P, Das GC, Bansal A, Samanta J, Mandavdhare HS, Sharma V, Naseem S, Gupta V, Yadav TD, Dutta U, Varma N, Sandhu MS, Kochhar R. Value of neutrophil-lymphocyte ratio in evaluating response to percutaneous catheter drainage in patients with acute pancreatitis. World J Clin Cases 2022; 10(1): 91-103
- URL: https://www.wjgnet.com/2307-8960/full/v10/i1/91.htm
- DOI: https://dx.doi.org/10.12998/wjcc.v10.i1.91


