Copyright
©The Author(s) 2022.
World J Clin Cases. Jan 7, 2022; 10(1): 371-380
Published online Jan 7, 2022. doi: 10.12998/wjcc.v10.i1.371
Published online Jan 7, 2022. doi: 10.12998/wjcc.v10.i1.371
Figure 1 Anesthetic records.
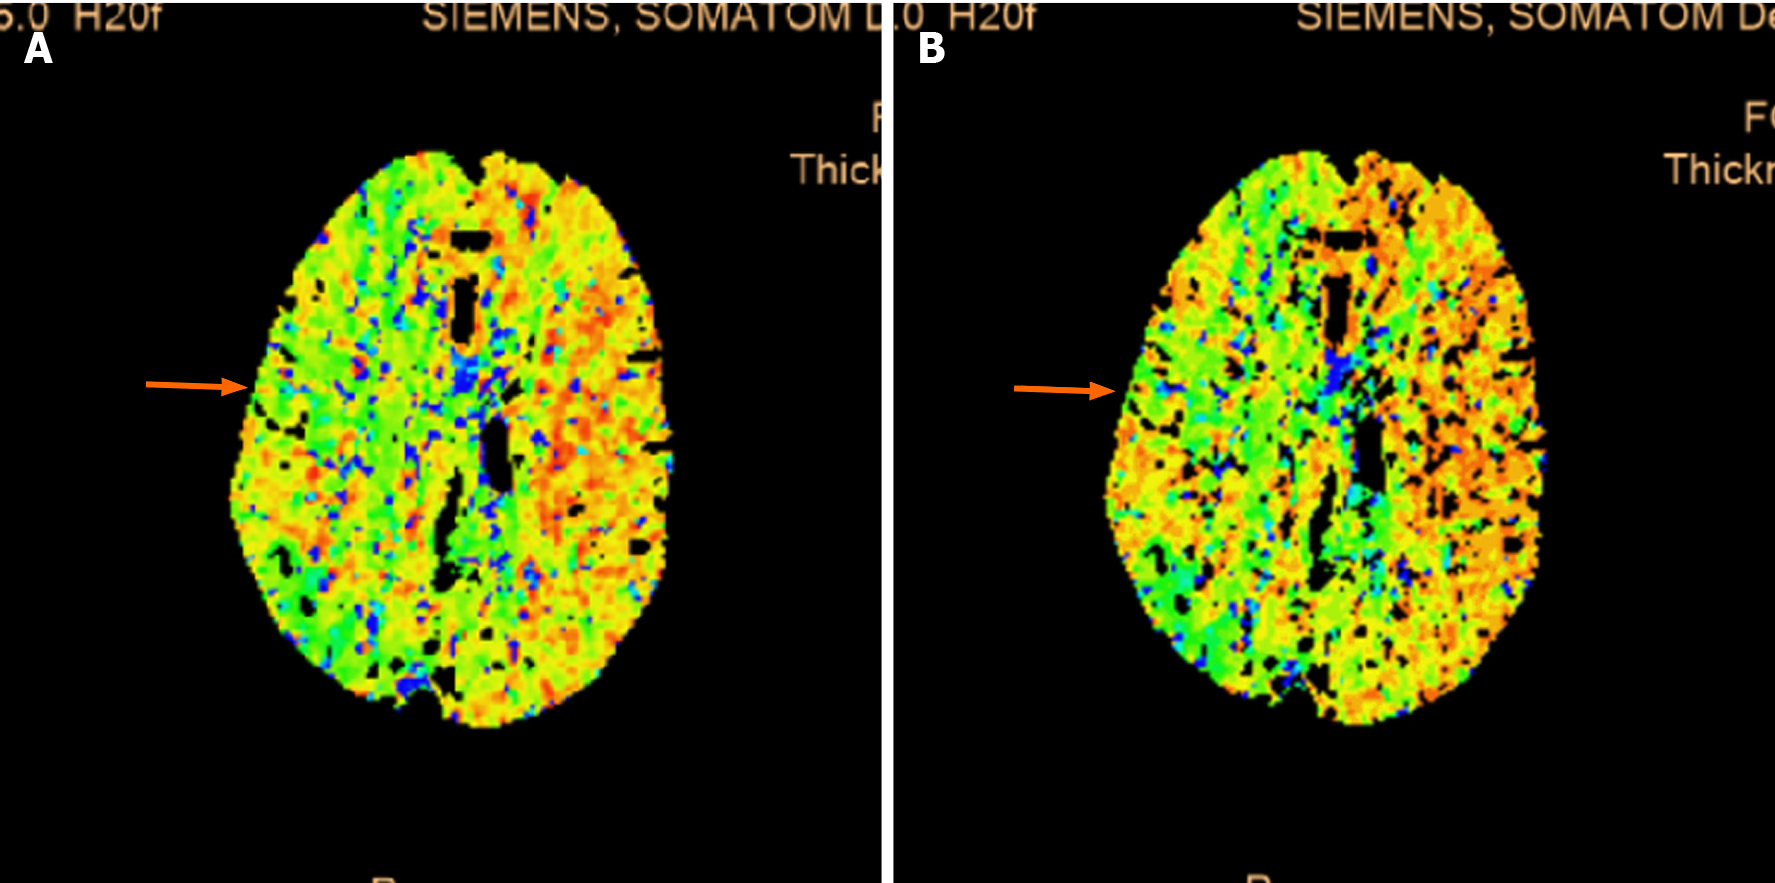
Figure 2 Computed tomography perfusion.
A: The right hemisphere mean transit time (arrow); B: The right hemisphere mean transit time to peak were prolonged (arrow). The cerebral blood flow was slightly decreased in some areas.
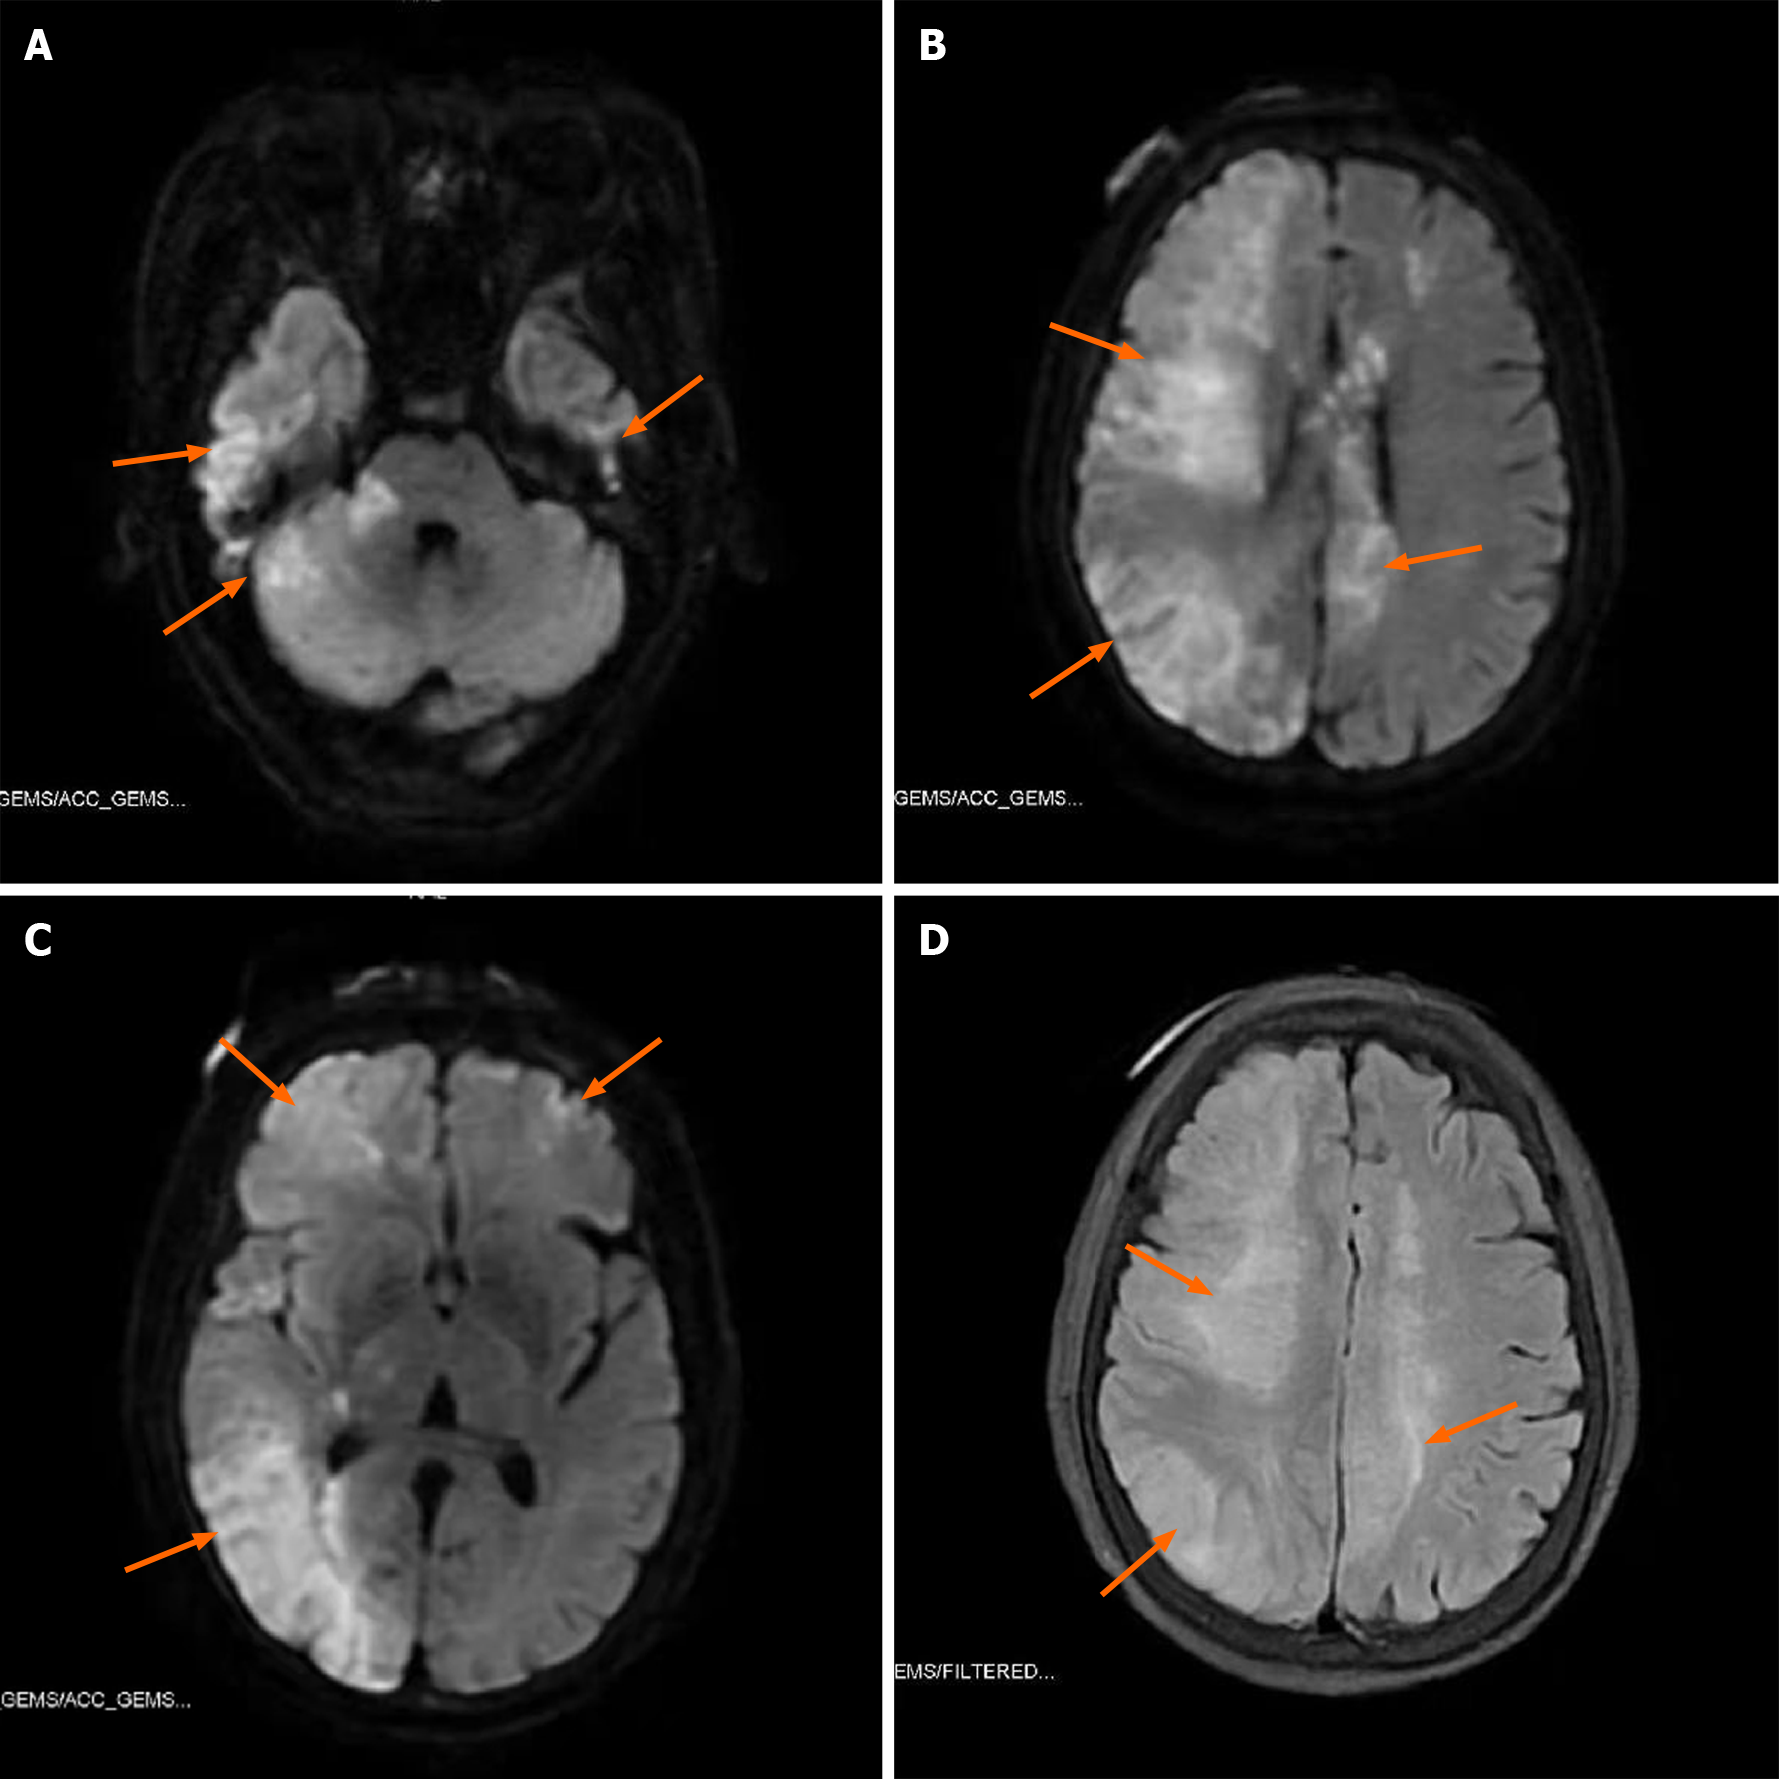
Figure 3 The magnetic resonance imaging.
A, B and C: Bilateral frontal and parietal lobes, right occipital lobe, and right cerebellar hemisphere, with long T1 and T2 signals and restricted diffusion on diffusion-weighted magnetic resonance imaging (MRI) (arrows); D: High signals in the above areas on fluid attenuated inversion recovery MRI (arrows).
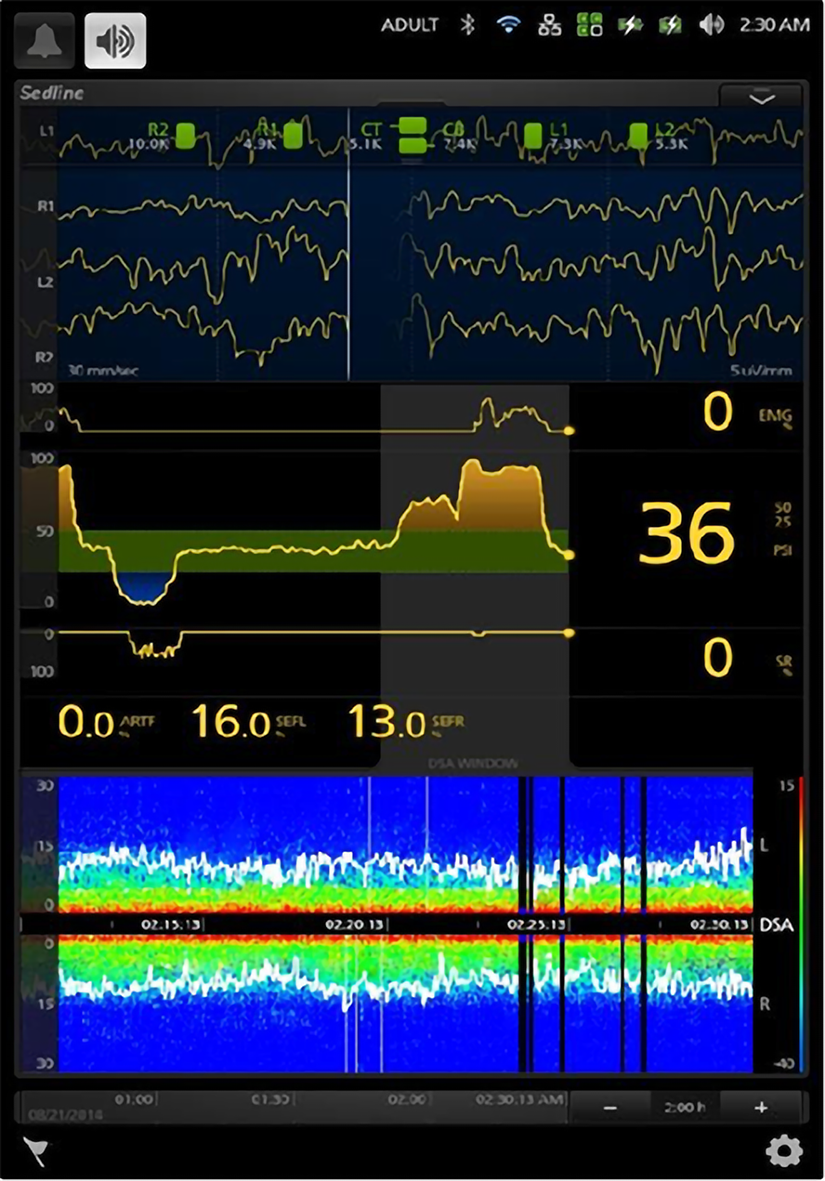
Figure 4 SedLine.
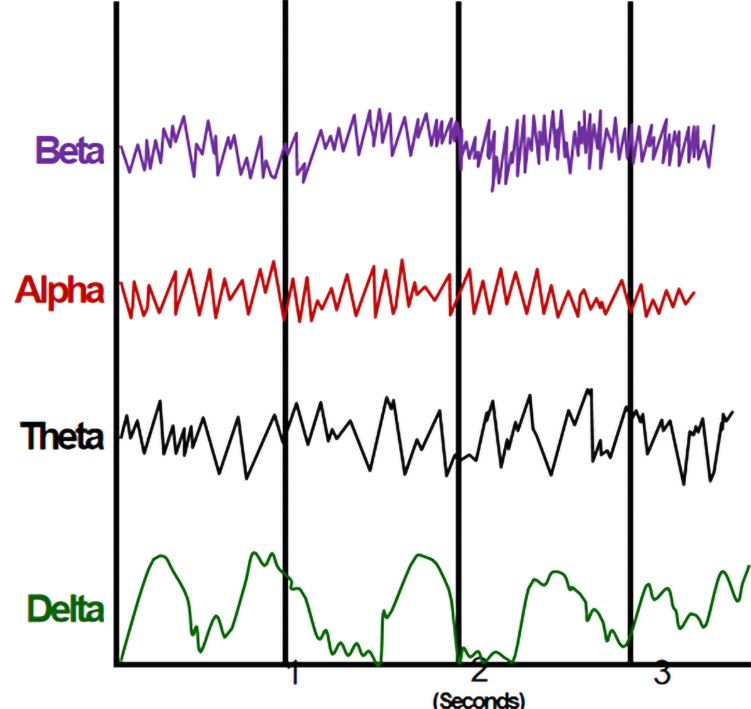
Figure 5 Electroencephalography waveform.
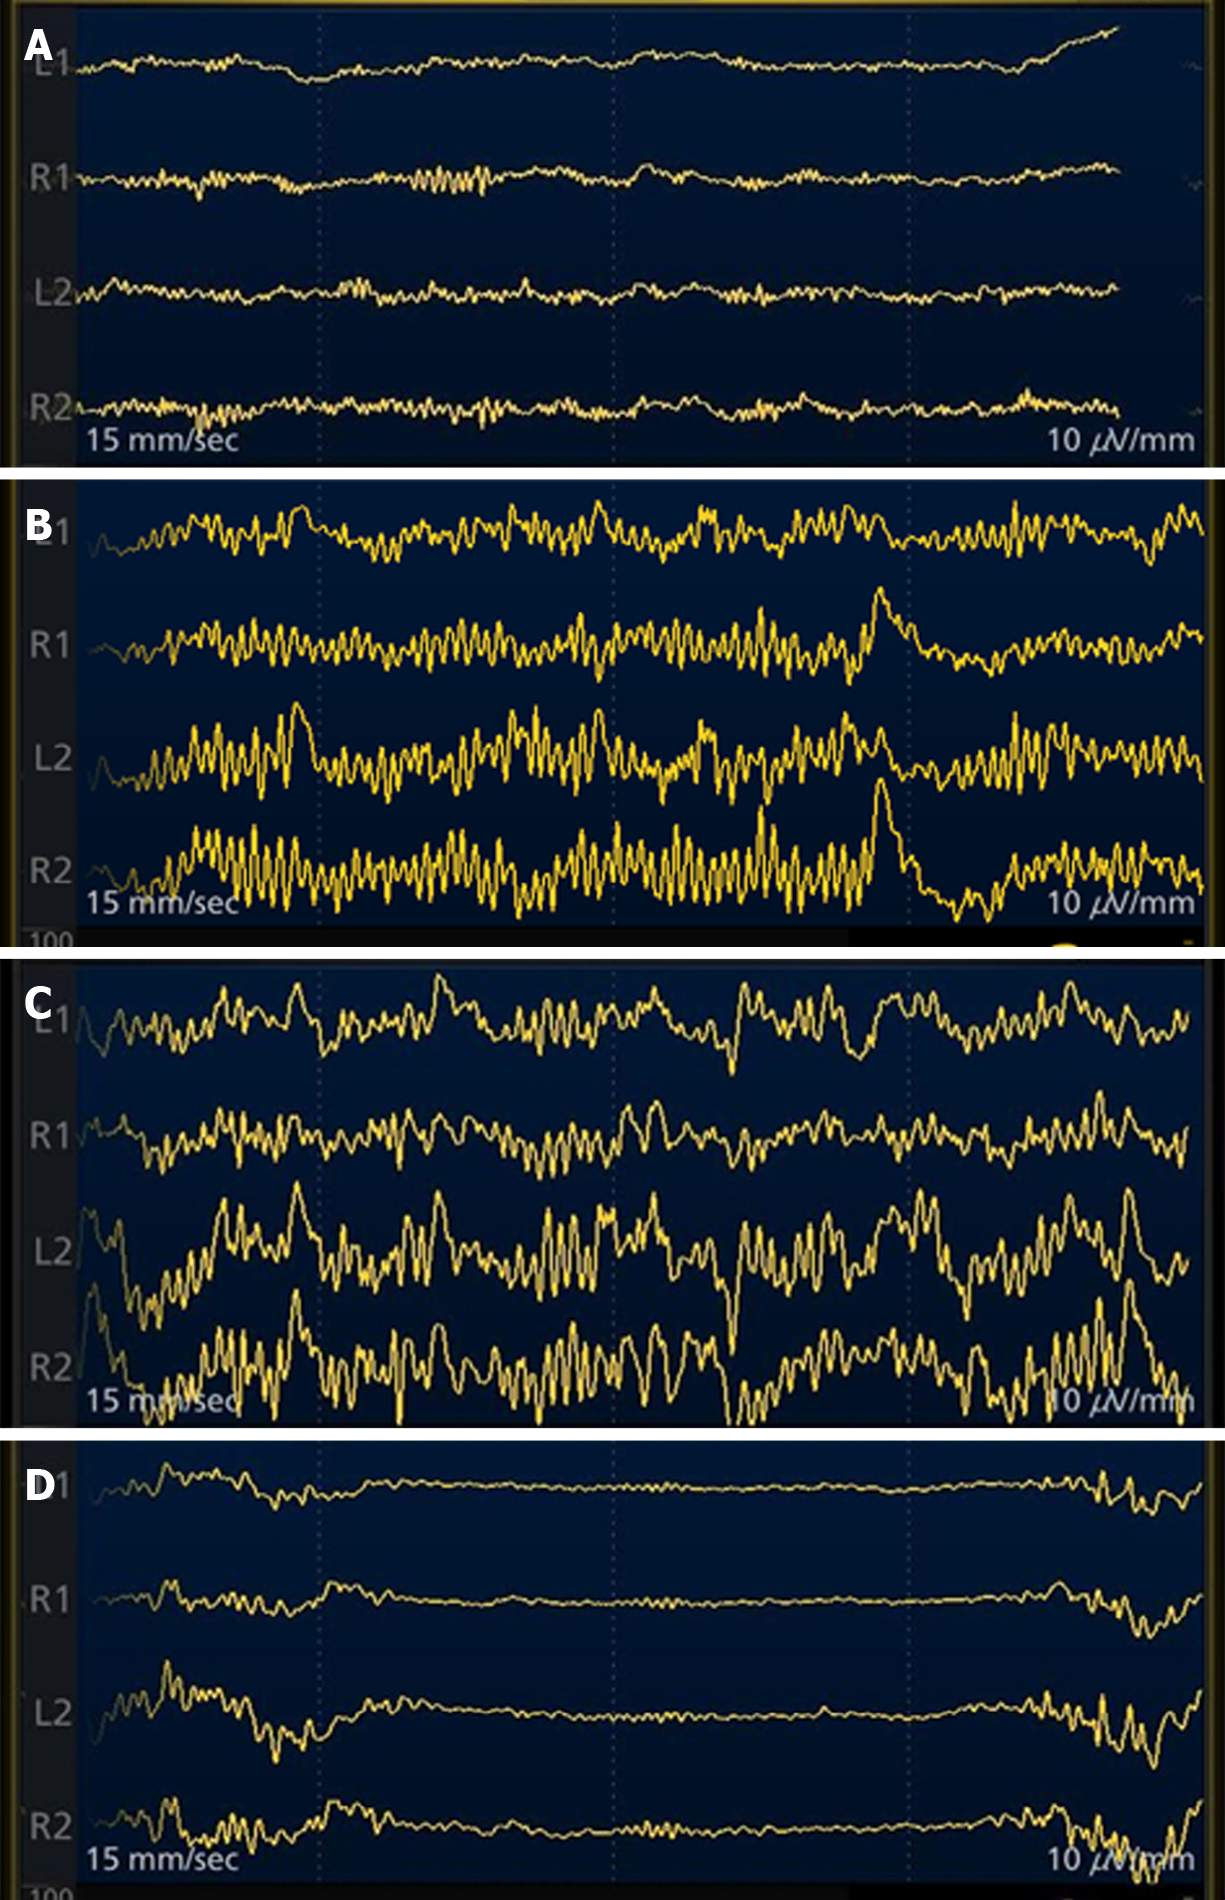
Figure 6 Electroencephalography traces from different levels of sedation.
A: Wakefulness; B: Light general anesthesia; C: Deeper general anesthesia; D: Burst suppressed.
- Citation: Zhang CMJ, Wang X. Suspected cerebrovascular air embolism during endoscopic esophageal varices ligation under sedation with fatal outcome: A case report. World J Clin Cases 2022; 10(1): 371-380
- URL: https://www.wjgnet.com/2307-8960/full/v10/i1/371.htm
- DOI: https://dx.doi.org/10.12998/wjcc.v10.i1.371


