Copyright
©The Author(s) 2022.
World J Clin Cases. Jan 7, 2022; 10(1): 249-253
Published online Jan 7, 2022. doi: 10.12998/wjcc.v10.i1.249
Published online Jan 7, 2022. doi: 10.12998/wjcc.v10.i1.249
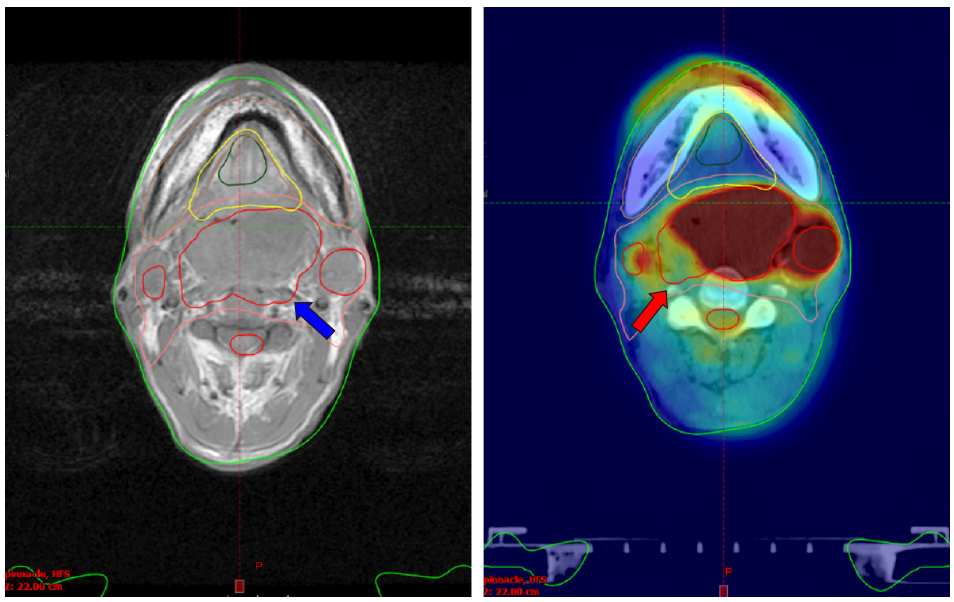
Figure 1 Scan of the patient's skull base and the site of tumor invasion (red circle).
The magnetic resonance imaging-computed tomography (CT) fusion image has a high resolution of soft tissue, including the tumor boundary and lymph nodes. However, compared with the positron emission tomography (PET)-CT fusion image, the bone invasion site is not shown (blue arrow). The PET-CT fusion image shows the tumor and its invasion by hypermetabolism with a high sensitivity for tumor recognition. However, the decreased glucose uptake of tumor necrotic tissues did not develop (red arrow), causing false-negative results.
- Citation: Zhou QP, Zhao YH, Gao L. Positron emission tomography and magnetic resonance imaging combined with computed tomography in tumor volume delineation: A case report. World J Clin Cases 2022; 10(1): 249-253
- URL: https://www.wjgnet.com/2307-8960/full/v10/i1/249.htm
- DOI: https://dx.doi.org/10.12998/wjcc.v10.i1.249


