Copyright
©The Author(s) 2022.
World J Clin Cases. Jan 7, 2022; 10(1): 166-176
Published online Jan 7, 2022. doi: 10.12998/wjcc.v10.i1.166
Published online Jan 7, 2022. doi: 10.12998/wjcc.v10.i1.166
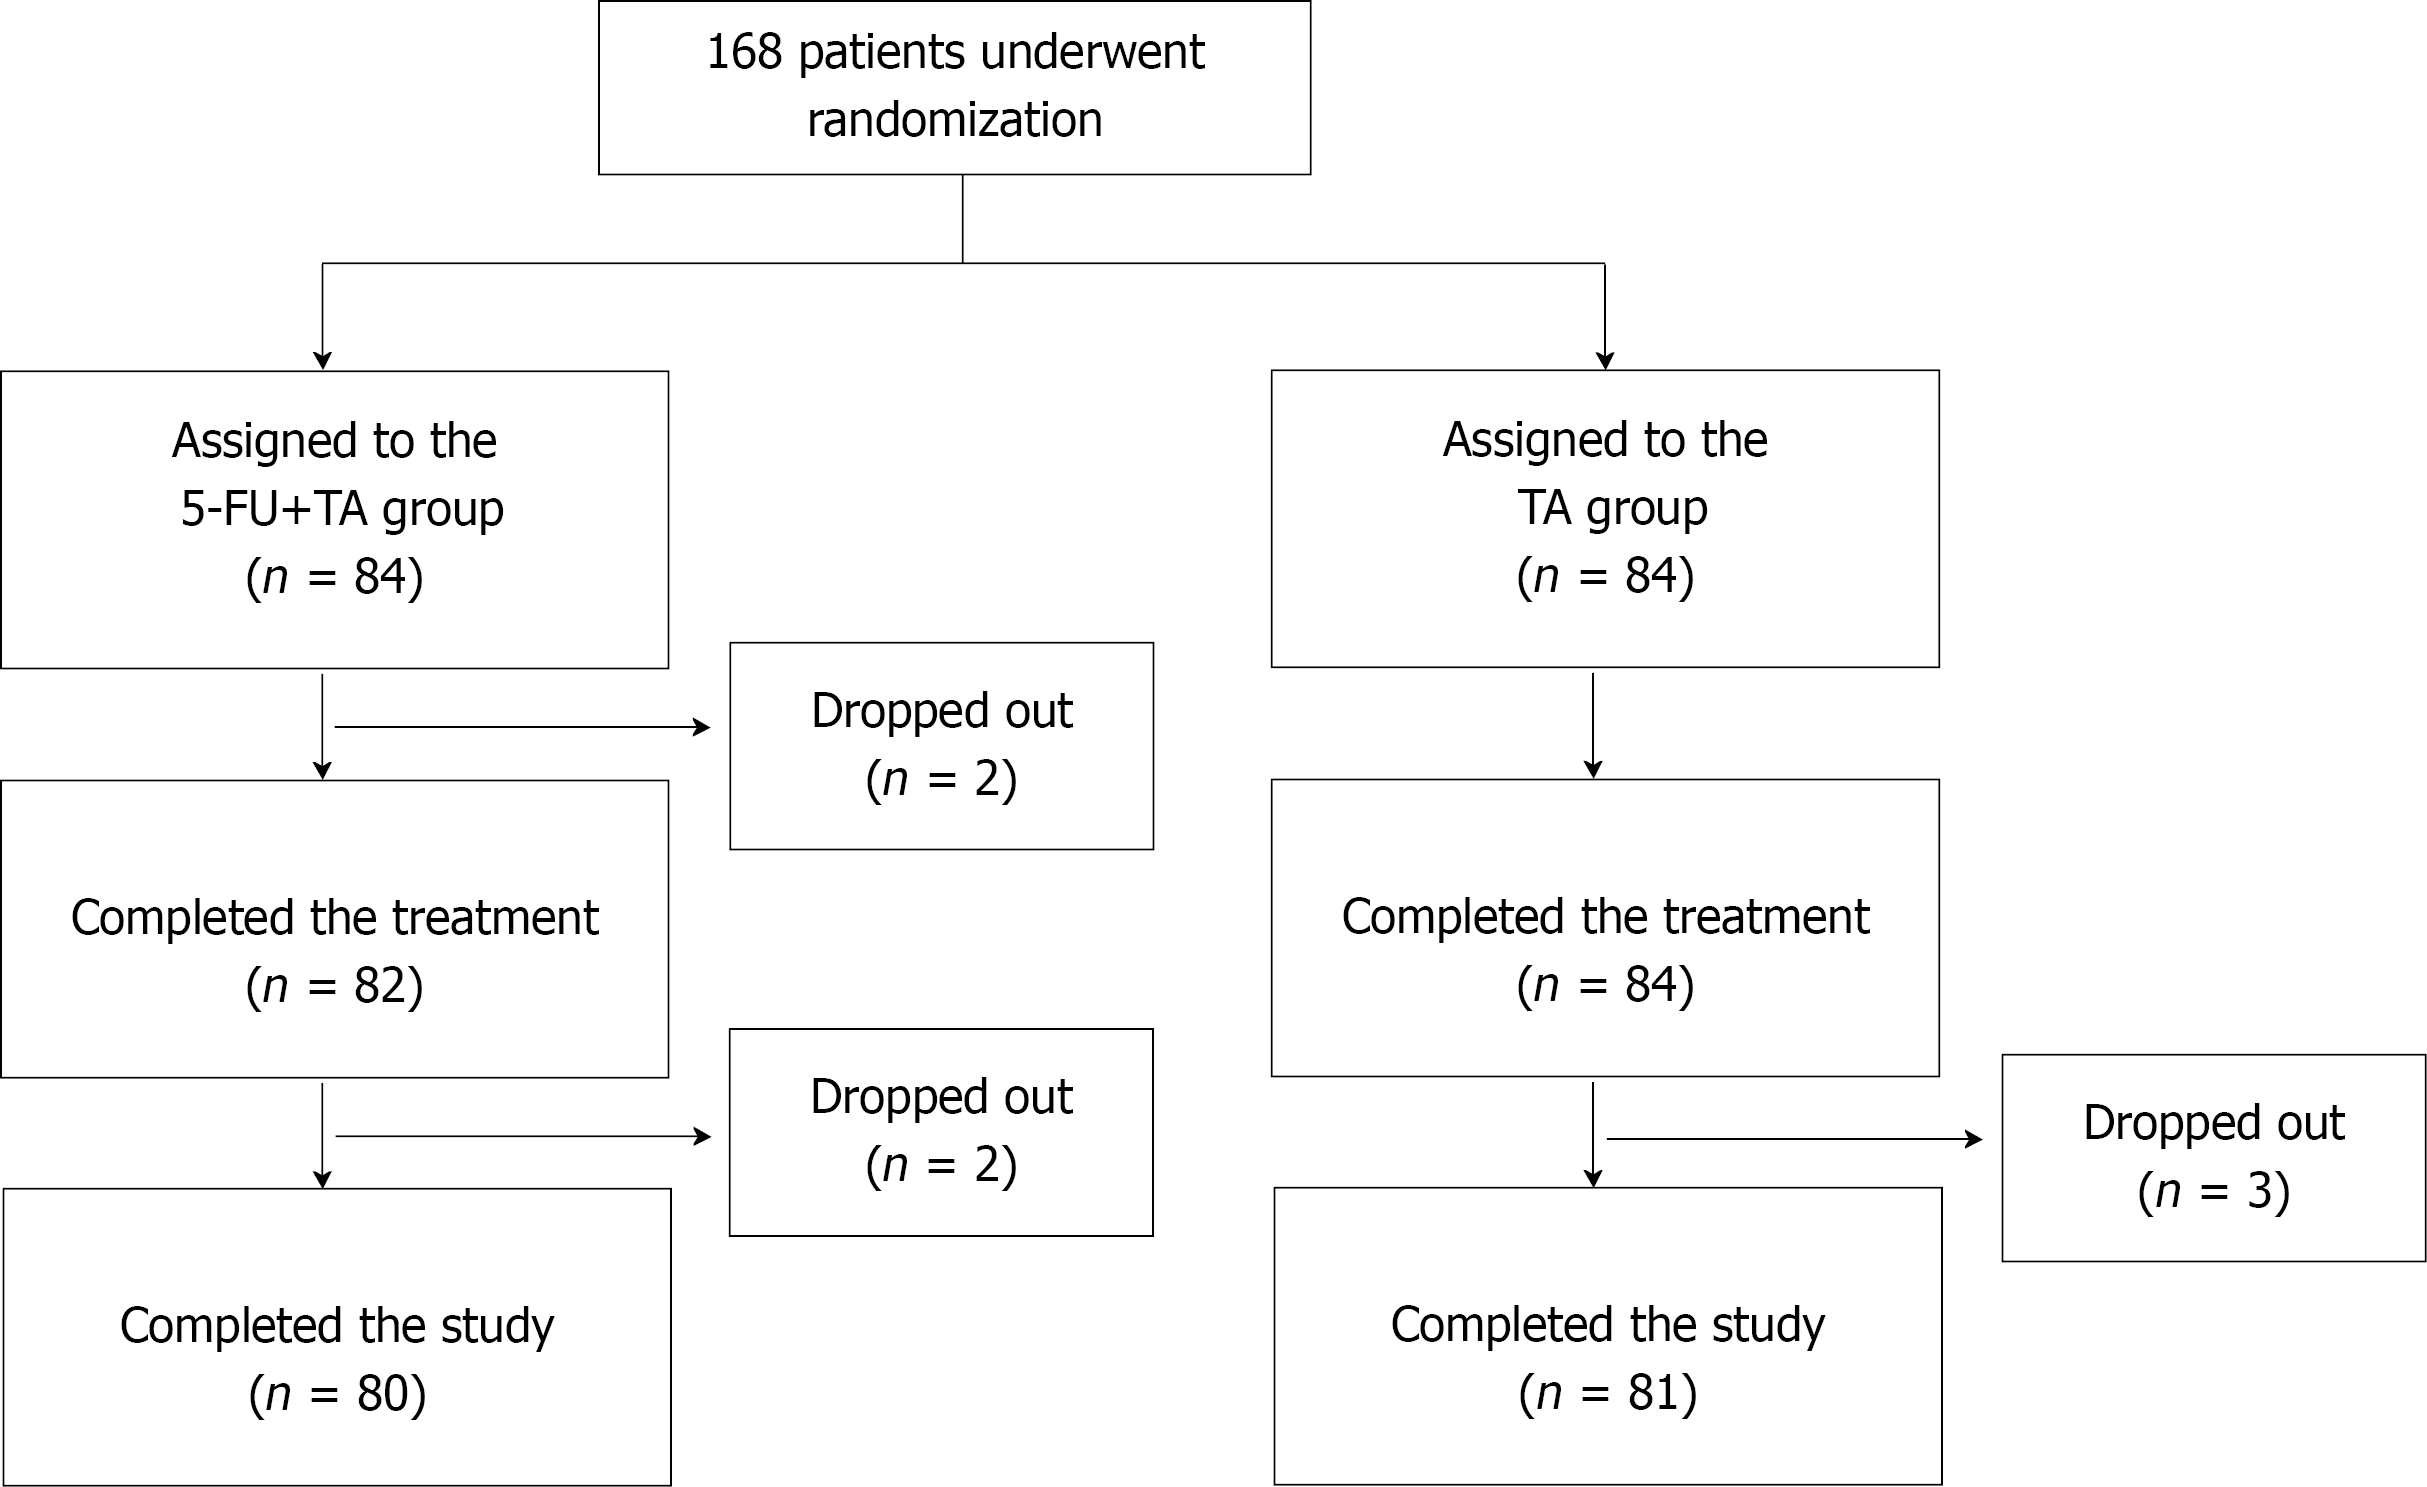
Figure 1 Randomization and allocation of patients to the study groups.
5-FU: 5-fluorouracil; TA: triamcinolone.
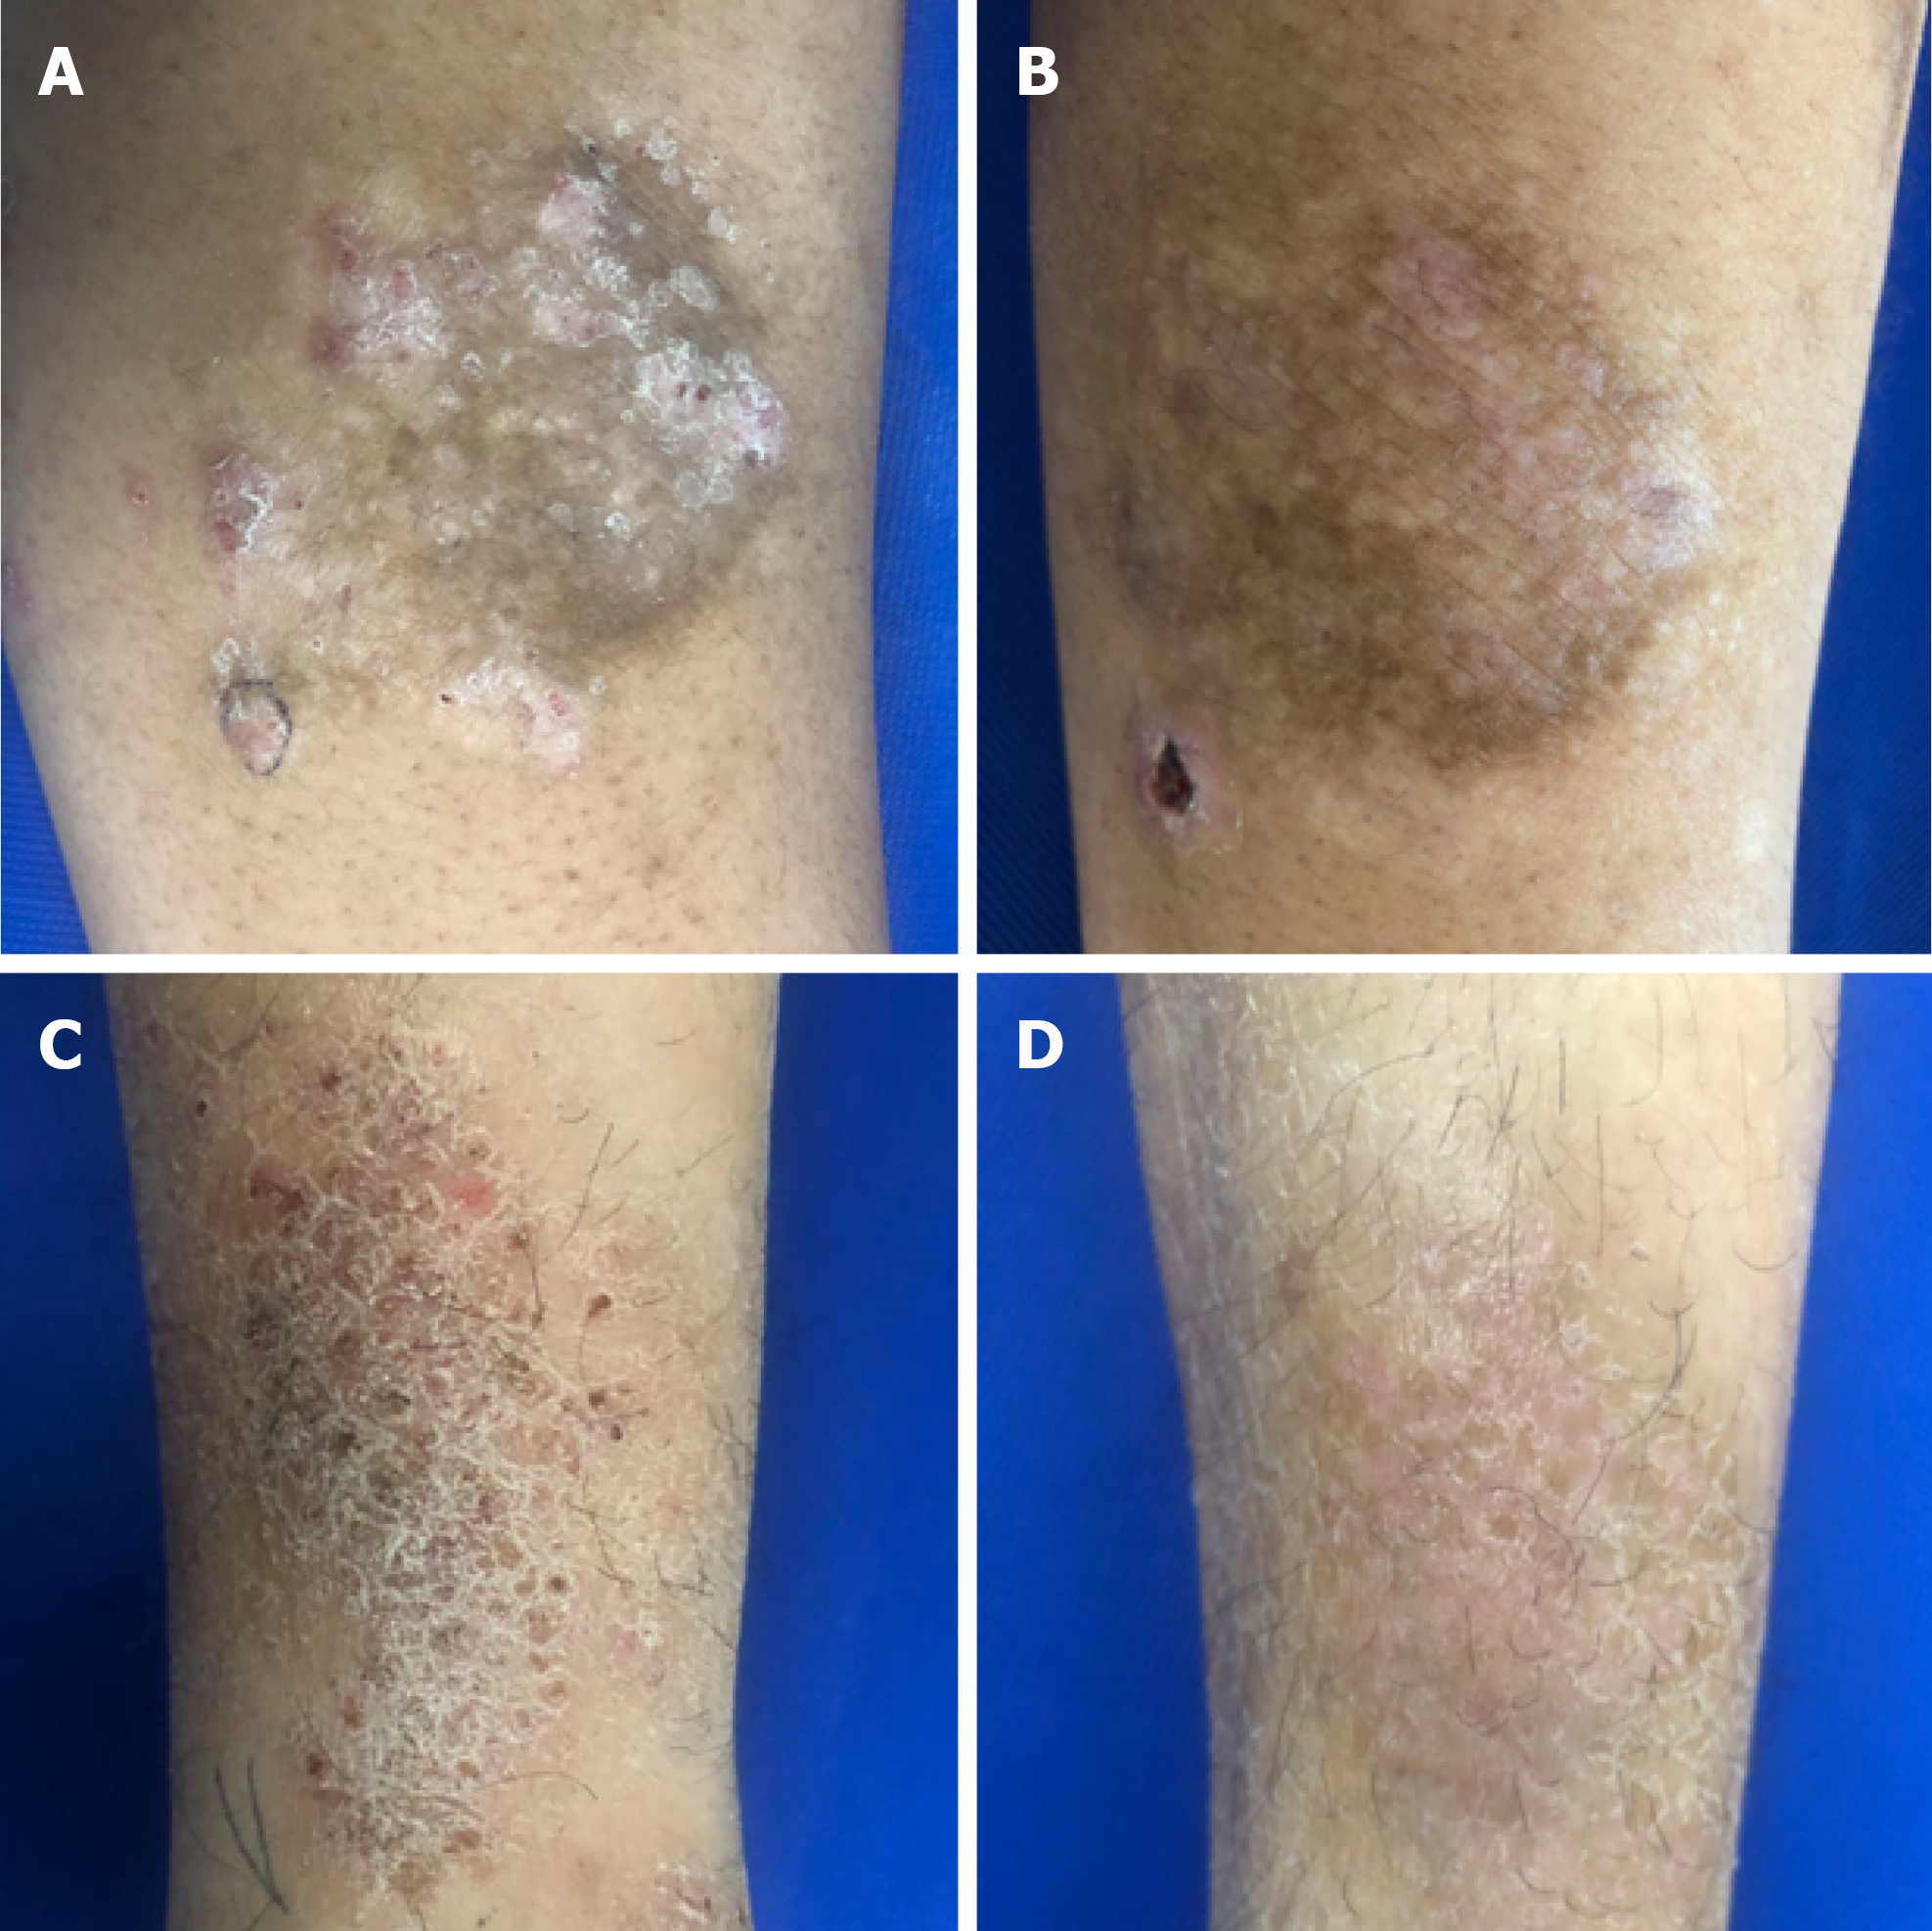
Figure 2 Representative images of localized chronic eczema lesions before and 2 wk after treatment.
Skin lesion of a patient in the intralesional 5-FU+TA treatment group (A) at baseline and (B) 2 wk after 5-FU+TA treatment. Skin lesion of a patient in the intralesional TA treatment group (C) at baseline and (D) 2 wk after TA treatment. 5-FU: 5-fluorouracil; TA: triamcinolone.
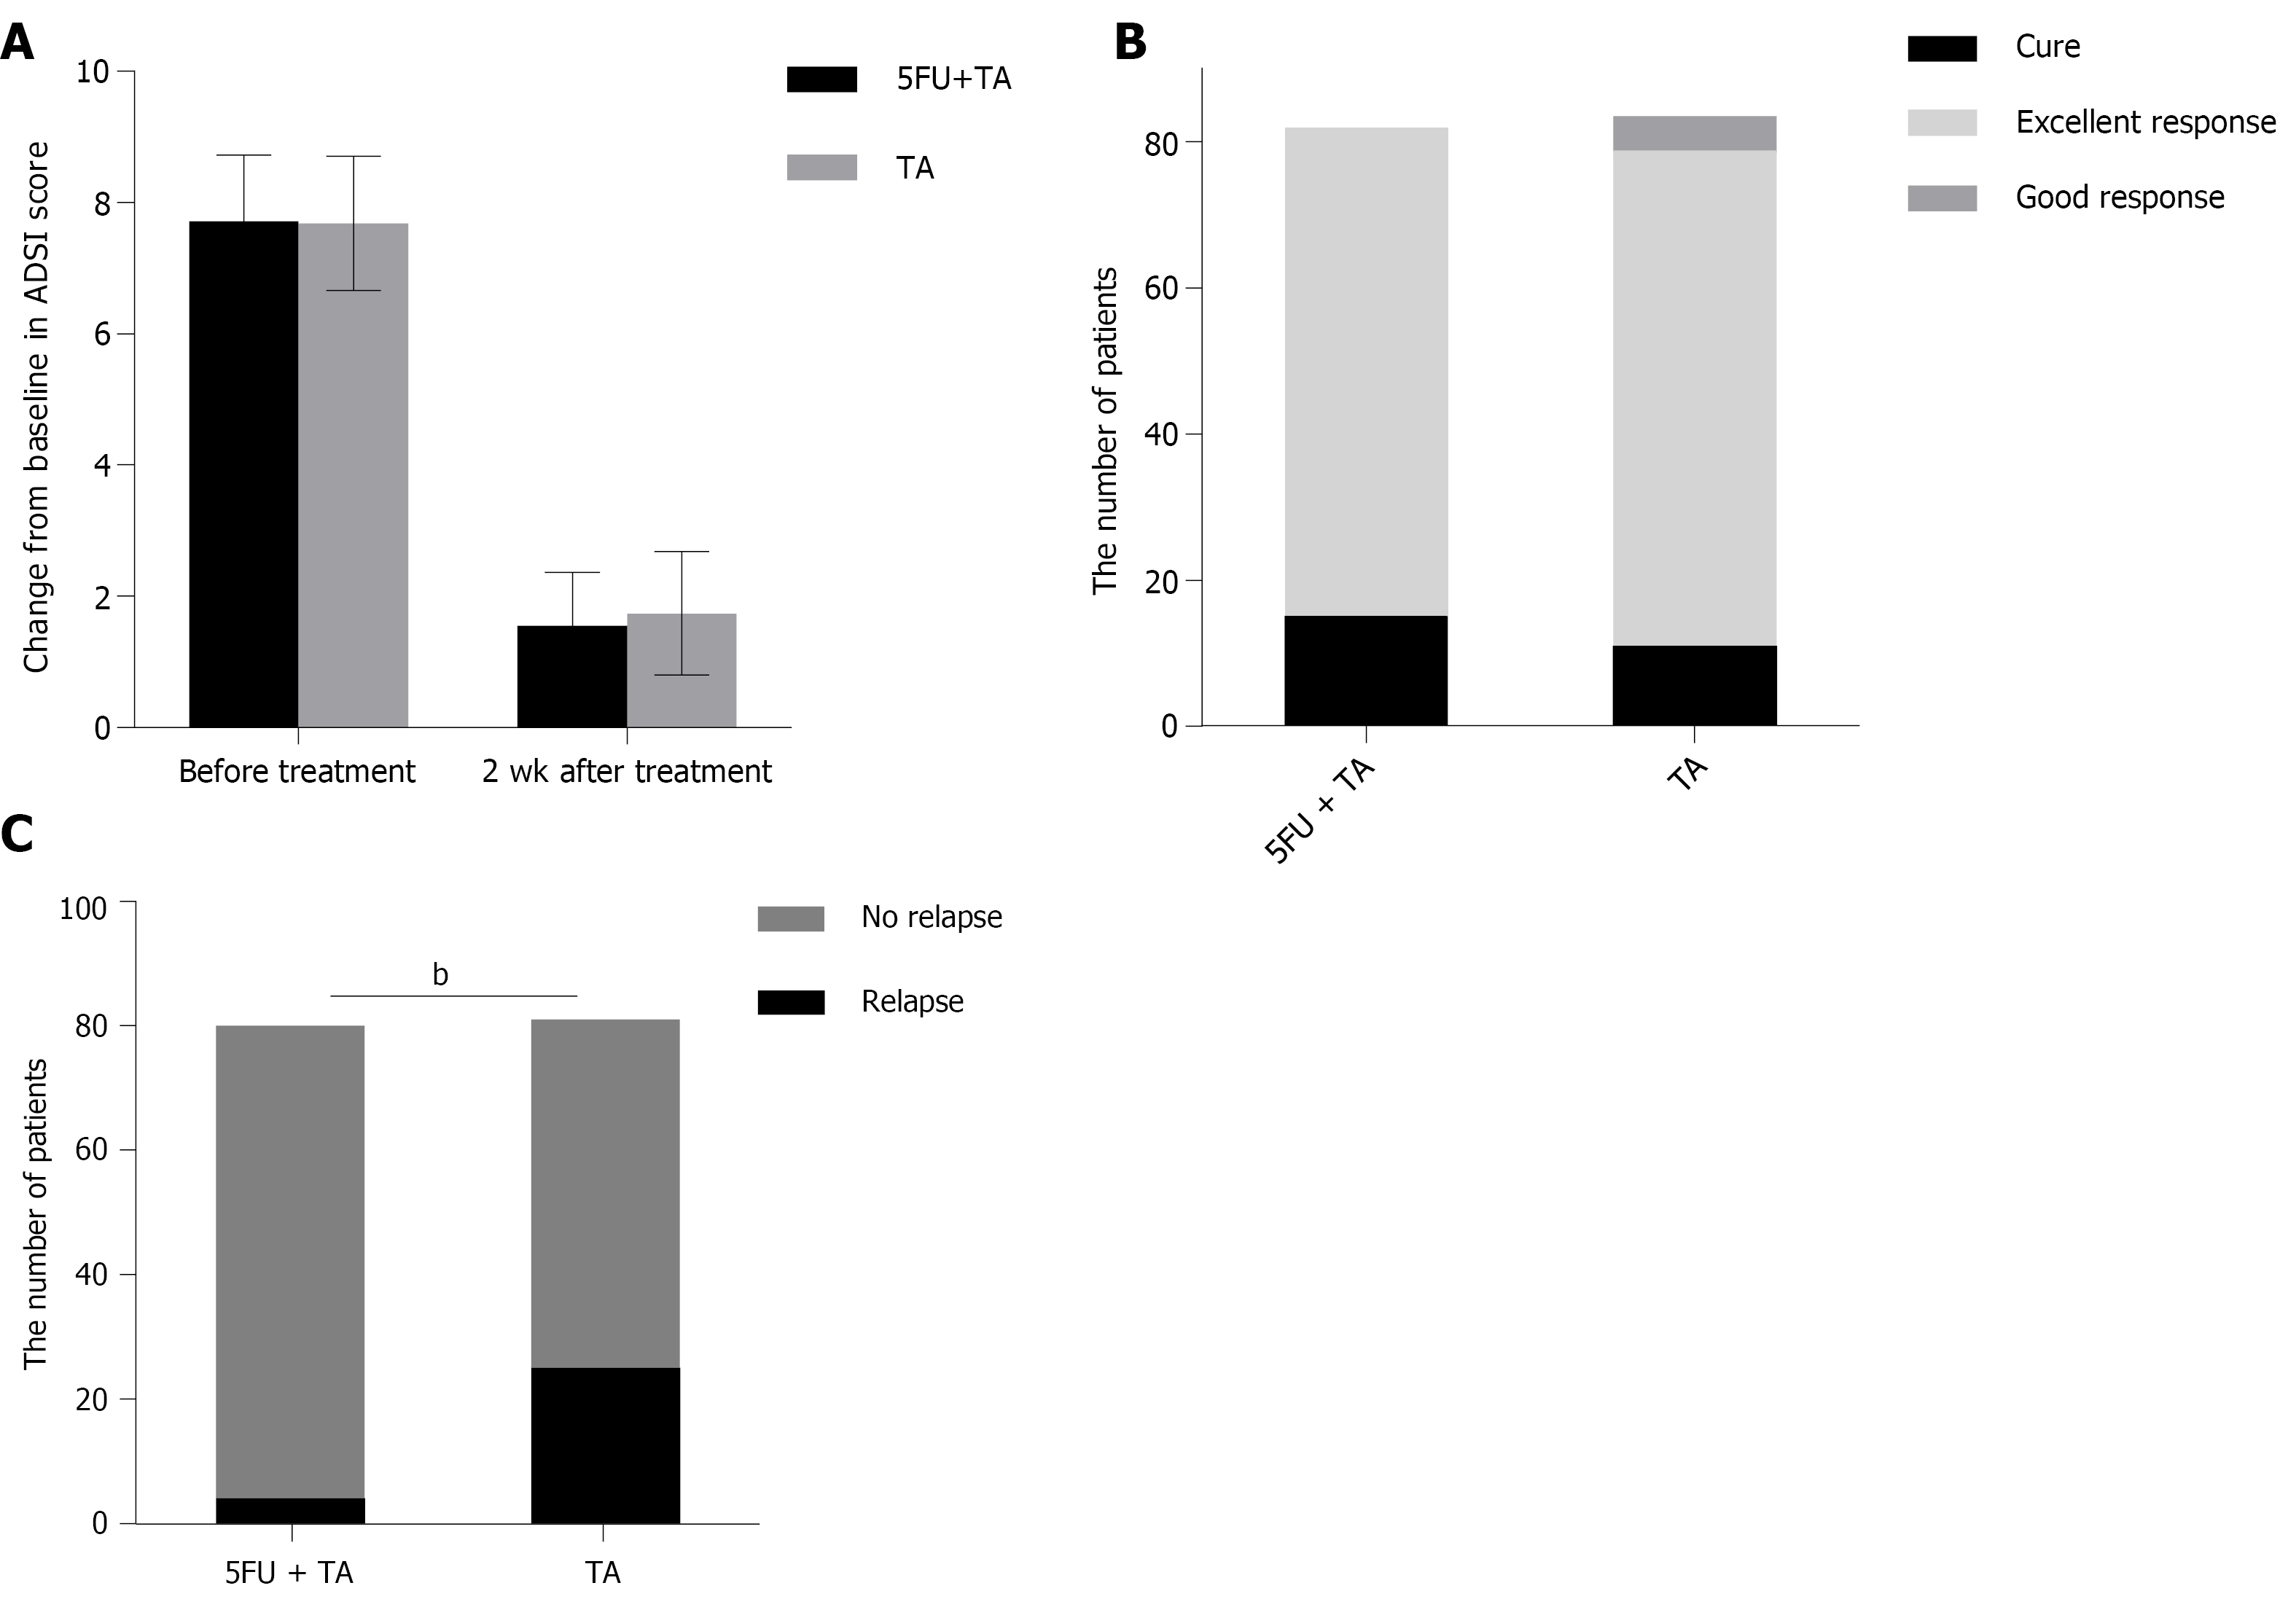
Figure 3 Clinical responses of the localized lesions of chronic eczema to intralesional treatment with low-dose 5-FU+TA and TA at 2 wk after treatment.
(A) Mean atopic dermatitis severity index (ADSI) scores before and 2 wk after treatment. (B) A number of patients who achieved cure, excellent response, and good response 2 wk after treatment with 5-FU+TA or TA. (C) A number of patients who experienced relapse after treatment with 5-FU+TA (n = 4) or TA (n = 25) during 1-year follow-up. (bP < 0.01). 5-FU: 5-fluorouracil; TA: triamcinolone.
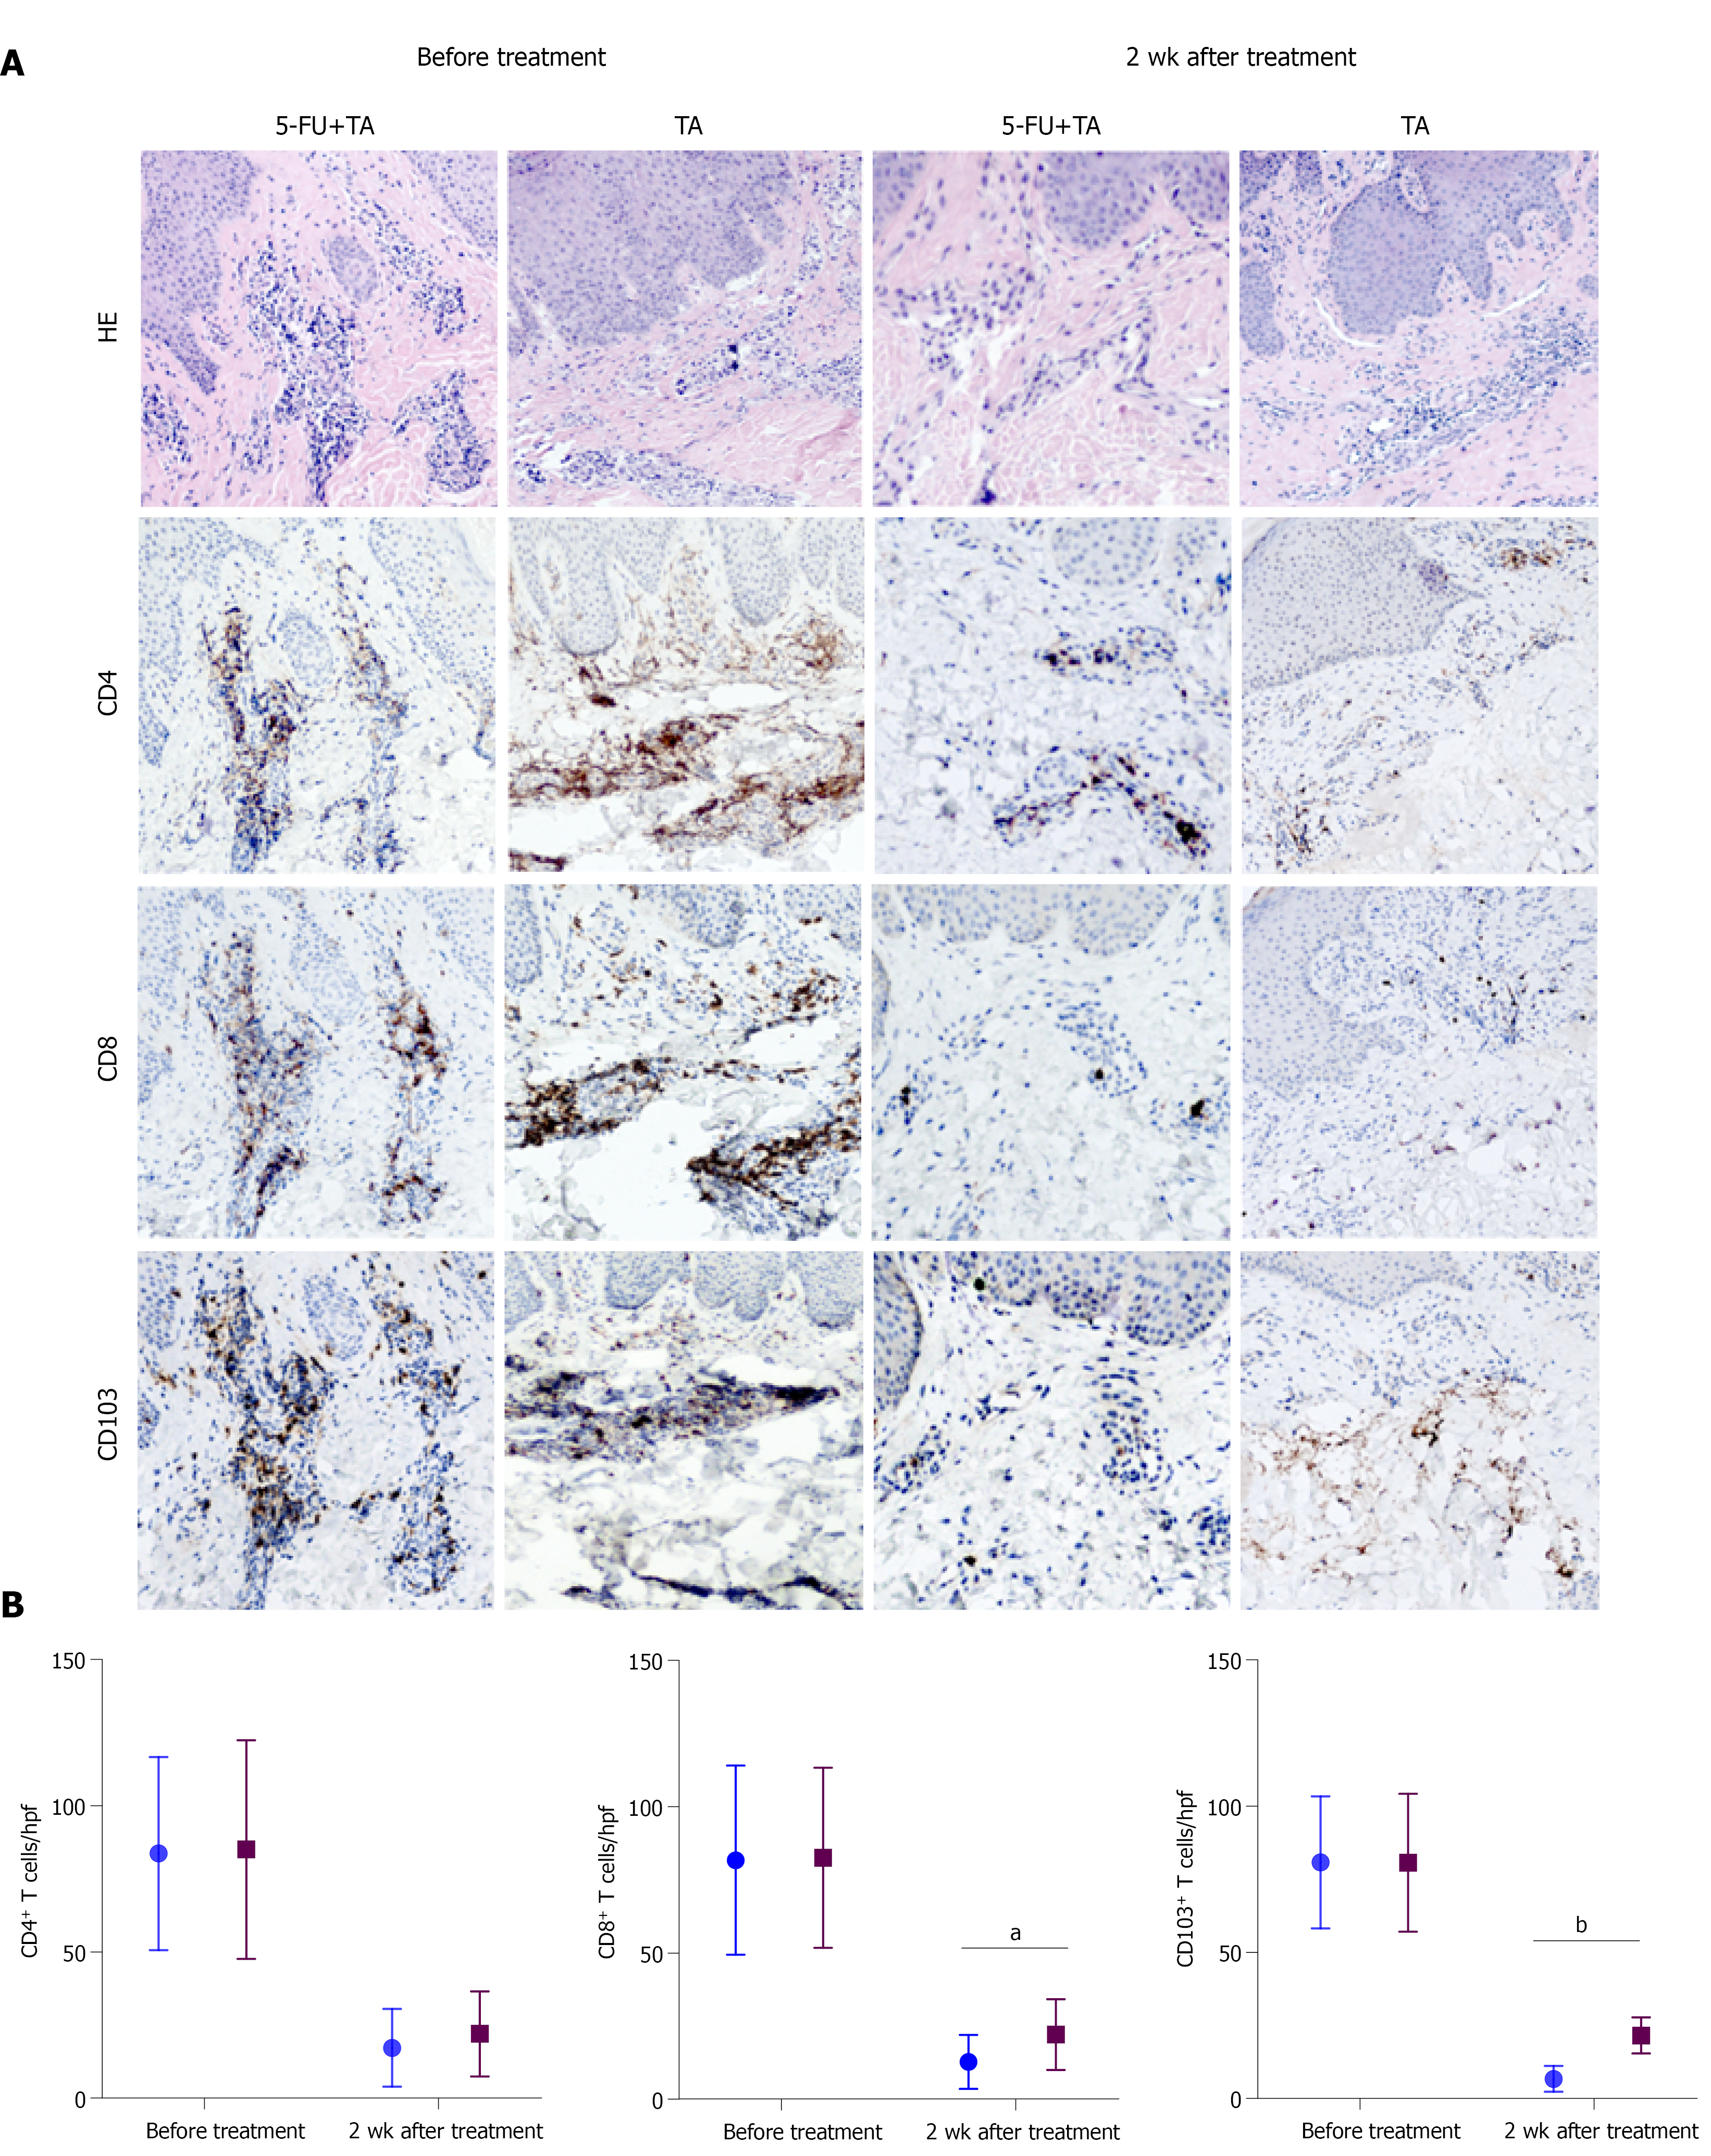
Figure 4 Histopathology and immunohistochemistry of localized lesions of chronic eczema to intralesional treatment with 5-FU+TA and TA before and 2 wk after treatment.
(A) Representative histologic images of biopsy specimens from localized lesions of chronic eczema were collected before and at 2 wk after treatment. Tissue samples (n = 15 for each group) were stained with HE and antibodies against CD4, CD8, or CD103 to detect T-cell infiltration in the lesional skin. (B) CD4+, CD8+, and CD103+ T cell counts were quantified in high-power field images of lesions biopsied before and 2 wk after treatment. Blue points: 5-FU + TA group; Red points: TA group. aP < 0.05, bP < 0.01. 5-FU, 5-fluorouracil; TA, triamcinolone.
- Citation: Wu Y, Wang GJ, He HQ, Qin HH, Shen WT, Yu Y, Zhang X, Zhou ML, Fei JB. Low-dose intralesional injection of 5-fluorouracil and triamcinolone reduces tissue resident memory T cells in chronic eczema. World J Clin Cases 2022; 10(1): 166-176
- URL: https://www.wjgnet.com/2307-8960/full/v10/i1/166.htm
- DOI: https://dx.doi.org/10.12998/wjcc.v10.i1.166


